# 파이썬도 압축파일을 관리하는 툴이 있다

import zipfile

content_zip = zipfile.ZipFile('./data/archive.zip')
content_zip.extractall('./data/') # 파일 풀기

content_zip.close()
# 모듈
import numpy as np
import pandas as pd
import os
import glob
import matplotlib.pyplot as plt
import seaborn as sns
import tensorflow as tf
from tensorflow.keras import Sequential, models
from tensorflow.keras.layers import Flatten, Dense, Conv2D, MaxPool2D
from sklearn.model_selection import train_test_split
from sklearn.metrics import classification_report, confusion_matrix# 파일 정리
path = './data/Face Mask Dataset/'
dataset = {'image_path' : [], 'mask_status' : [], 'where' : []}
for where in os.listdir(path):
for status in os.listdir(path + '/' + where):
for image in glob.glob(path + where + '/' + status + '/' + '*.png'):
dataset['image_path'].append(image)
dataset['mask_status'].append(status)
dataset['where'].append(where)# 경로와 목록 정리
dataset = pd.DataFrame(dataset)
dataset.head()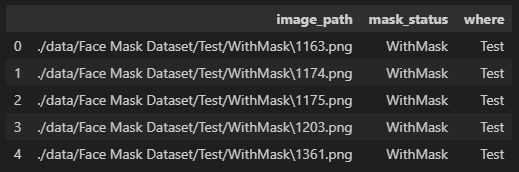
print('With Mask : ', dataset.value_counts('mask_status')[0])
print('Without Mask : ', dataset.value_counts('mask_status')[1])

sns.countplot(x=dataset['mask_status'])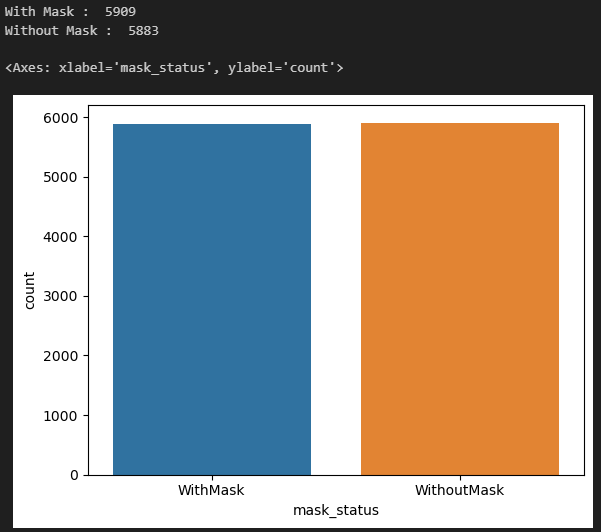
# !pip install opencv-python# 랜덤하게 어떤 그림이 있는지 확인
import cv2
plt.figure(figsize=(15, 10))
for i in range(9):
random = np.random.randint(1, len(dataset))
plt.subplot(3, 3, i+1)
plt.imshow(cv2.imread(dataset.loc[random, 'image_path']))
plt.title(dataset.loc[random, 'mask_status'], size = 15)
plt.xticks([])
plt.yticks([])
plt.show()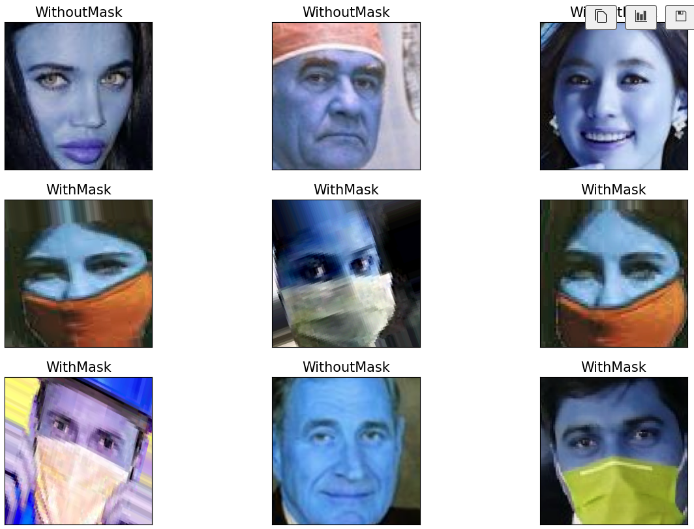
train_df = dataset[dataset['where'] =='Train']
test_df = dataset[dataset['where'] =='Test']
valid_df = dataset[dataset['where'] =='Validation']
train_df
# Train, Test, Validation 데이터 분포 확인
plt.figure(figsize=(15, 5))
plt.subplot(1, 3, 1)
sns.countplot(x=train_df['mask_status'])
plt.title('Training Dataset', size=10)
plt.subplot(1, 3, 2)
sns.countplot(x=test_df['mask_status'])
plt.title('Test Dataset', size=10)
plt.subplot(1, 3, 3)
sns.countplot(x=valid_df['mask_status'])
plt.title('Validation Dataset', size=10)
plt.show()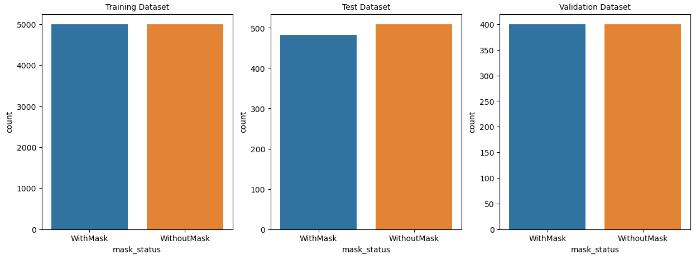
# index 정리

train_df = train_df.reset_index().drop('index', axis=1)
train_df.head()data[0]np.random.shuffle(data)
data[0]fig, ax = plt.subplots(2, 3, figsize=(10, 6))
for row in range(2):
for col in range(3):
image_index = row * 100 + col
ax[row, col].axis('off')
ax[row, col].imshow(data[image_index][0], cmap='gray')
if data[image_index][1] == 0:
ax[row, col].set_title('Without Mask')
else:
ax[row, col].set_title('With Mask')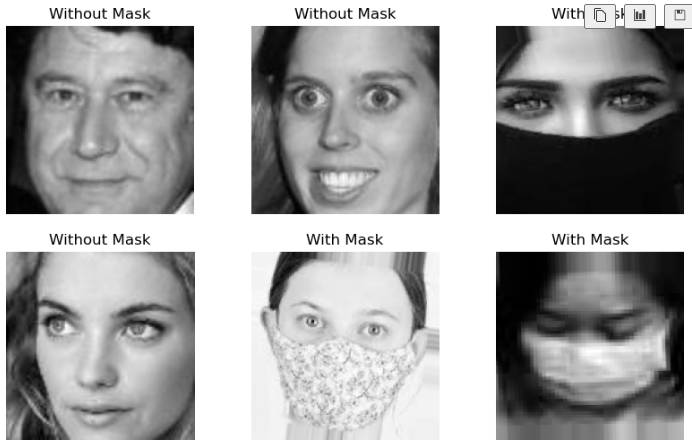
# X, y 데이터 저장

X = []
y = []

for image in data:
    X.append(image[0])
    y.append(image[1])

X = np.array(X)
y = np.array(y)
# 데이터 나누기
X_train, X_val, y_train, y_val = train_test_split(X, y, test_size=0.2, random_state=13)from tensorflow.keras import layers, models
model = models.Sequential(
[
layers.Conv2D(32, kernel_size=(5, 5), strides=(1, 1), padding='same',
activation='relu', input_shape=(150, 150, 1)),
layers.MaxPooling2D(pool_size=(2, 2), strides=(2, 2)),
layers.Conv2D(64, kernel_size=(2, 2), padding='same', activation='relu'),
layers.MaxPooling2D(pool_size=(2, 2)),
layers.Dropout(0.25),
layers.Flatten(), # 펼치기?..
layers.Dense(1000, activation='relu'),
layers.Dense(1, activation='sigmoid'), # 출력에 신경써야 함, sigmoid라서 0, 1 사이의 값이 나와야 함
]
)# compile
model.compile(
optimizer='adam', loss=tf.keras.losses.BinaryCrossentropy(), metrics=['accuracy']
)X_train = X_train.reshape(len(X_train), X_train.shape[1], X_train.shape[2], 1) # 훈련데이터 개수, 해상도, 해상도, 차원 맞추기 위한 1
X_val = X_val.reshape(len(X_val), X_val.shape[1], X_val.shape[2], 1)
history = model.fit(X_train, y_train, epochs=4, batch_size=32) # 4번돌고, 32데이터 가져와서 학습
# validation accuray가 나쁘지 않다

model.evaluate(X_val, y_val)
# 상대적으로 0에 대한 recall이 조금 떨어진다
prediction = (model.predict(X_val) > 0.5).astype('int32')
print(classification_report(y_val, prediction))
print(confusion_matrix(y_val, prediction))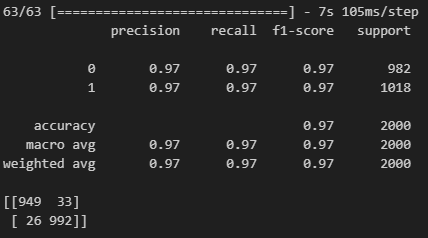
# 틀린 것만 추리기

wrong_result = []

for n in range(0, len(y_val)):
    if prediction[n] != y_val[n]:
        wrong_result.append(n)

len(wrong_result)
import random
samples = random.choices(population=wrong_result, k=6)
plt.figure(figsize=(14, 12))
for idx, n in enumerate(samples):
plt.subplot(3, 2, idx+1)
plt.imshow(X_val[n].reshape(150, 150), interpolation='nearest') # interpolation='nearest' : 최근접 보간법 단순히 가장 가까운 픽셀의 값을 새 픽셀에 할당하는 것
plt.title(prediction[n])
plt.axis('off')
plt.show()
💻 출처 : 제로베이스 데이터 취업 스쿨

#데이터분석 #퍼포먼스마케팅 #데이터 #디지털마케팅