Session Review
Confusion Matrix
a simple way to lay out 'how many predicted categories or classes were correctly predicted and how many were not'
👀 분류 모델을 통해 예측한 결과 중 True Positive(TP), True Negative(TN)의 비중을 늘리는 것이 목적 -> confusion matrix: 분류 모델의 결과를 분석할 때 유용함
사진 하나 넣기
Performance Measures (Classification)
-
Simple Accuracy: num of samples predicted correctly / total num of samples
-
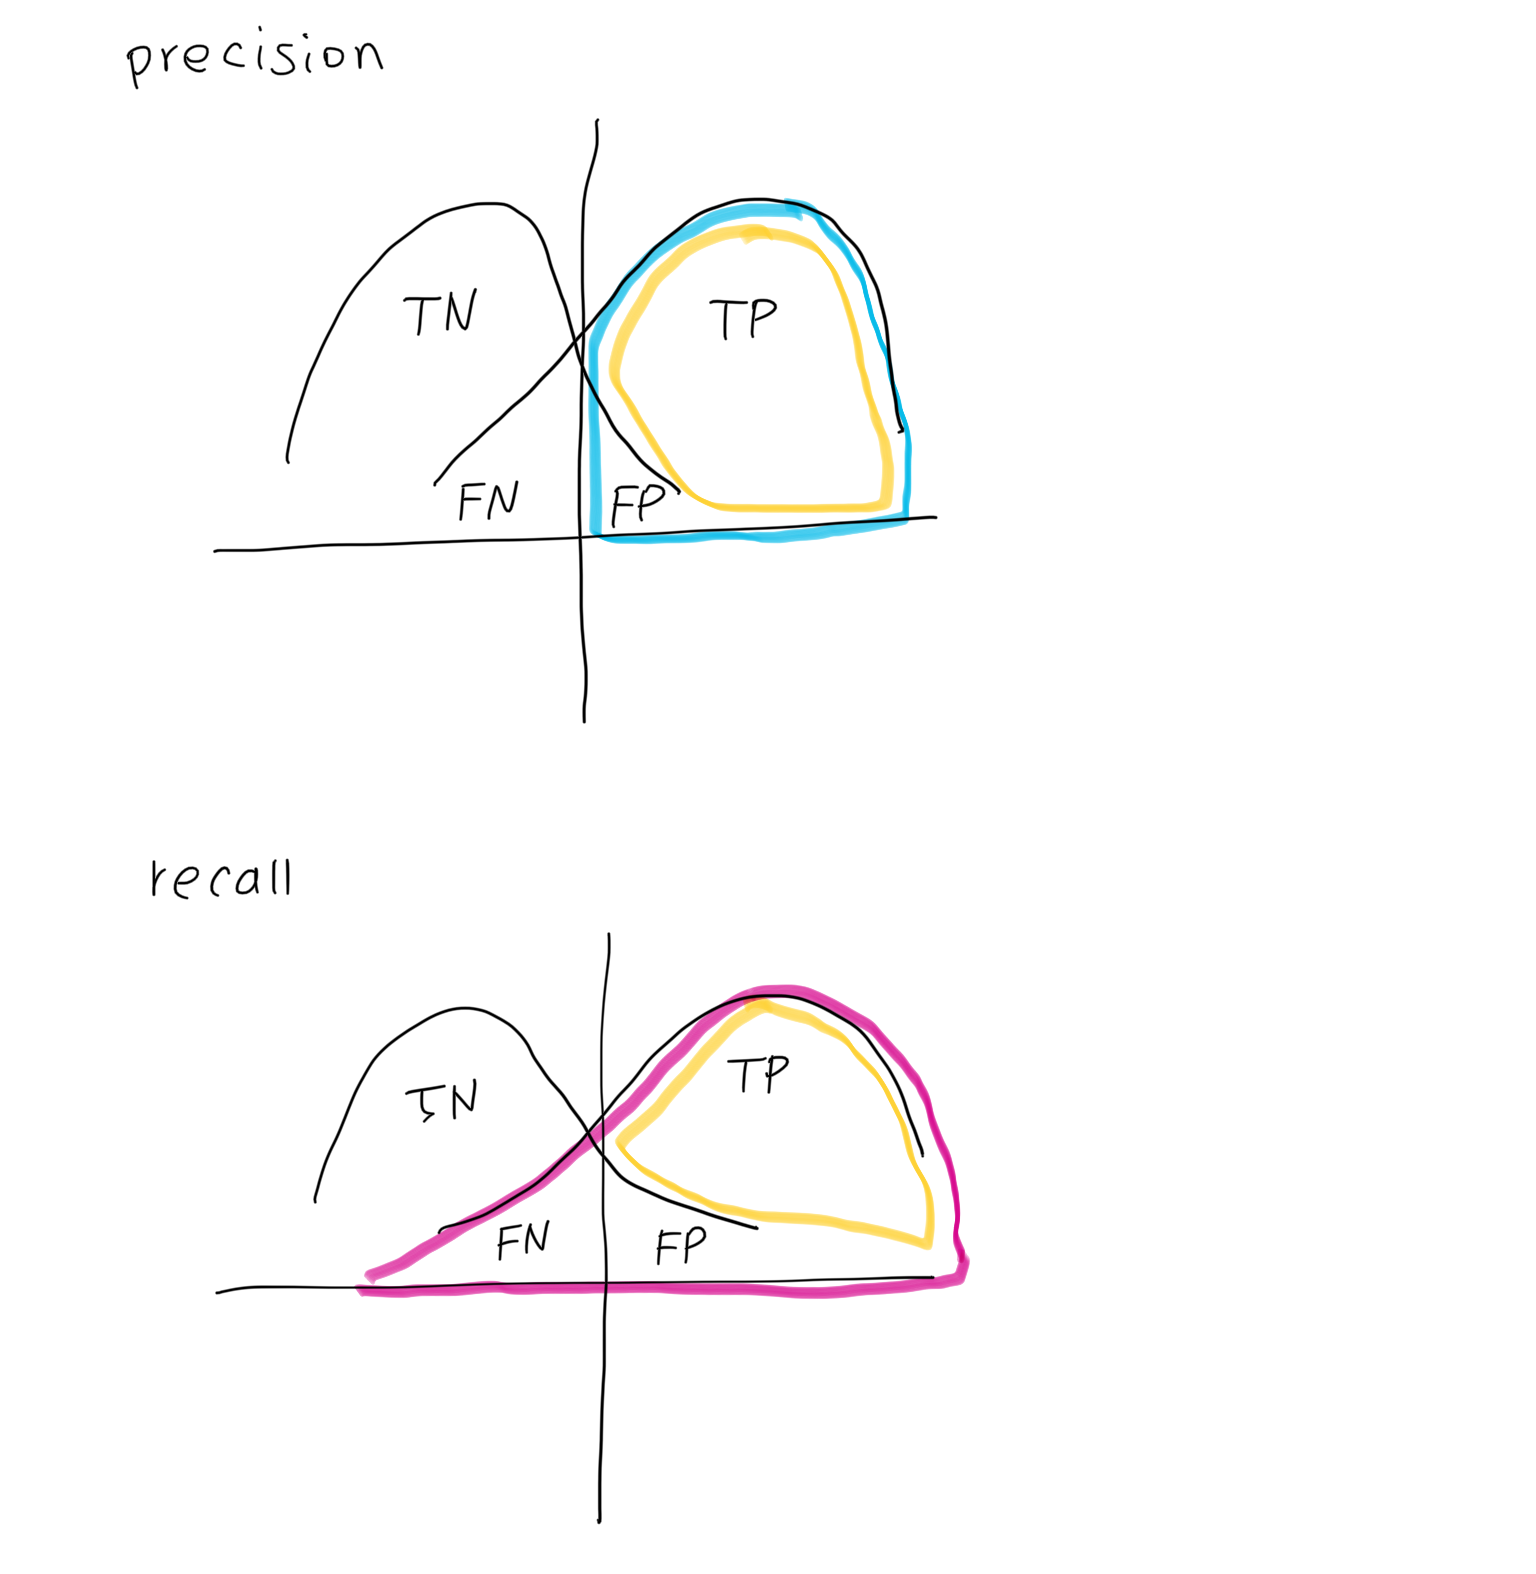
Precision: Of the shoes classified A, how many are actually A?
TP / (TP + FP) -
Recall: Of the shoes that are actually A, how many are classified as A?
TP / (TP + FN)
-
F-beta measure: Precision과 recall 값이 서로 다른 system 들을 비교할 때 사용
e.g. system 1: precision 70%, recall 60% <-> system 2: precision 80%, recall 50% 일 때, 어떤 system이 더 좋은가?-> F-beta에서 베타 값을 키우면, recall 값 줄어듦 / 줄이면, precision 값 줄어듦 (beta 값을 0.5로 하면 F-Measure와 동일한 결과)
-
F1 Score: F-beta measure에서 beta 값이 1인 것
-
ROC, AUC (Reciever Operating Characteristic, Area Under the Curve): 분류 문제에서 여러 임계값 설정에 따른 모델의 성능을 구할 수 있음
ROC curve: 여러 임계값에 대해 TPR(True Positive Rate; recall; 재현율)과 FPR(False Positive Rate; Fall-out; 위양성률) 그래프를 보여줌
-> precision, recall의 trade-off 관계와 달리 TPR-FPR은 임계값의 변화에 따라 상쇄되지 않기 때문에 명확한 임계값을 찾을 수 있다
AUC: ROC 아래의 면적 -> 학습이 잘 될수록 1에 가까워짐
Food for Thought
classification error 줄이는 것
= FN, FP를 줄이는 것 = 이들이 바로 error
-> threshold를 움직임으로써 FP를 줄일수도, FN을 줄일수도 있다 (이는 business context에 따라서 결정)
- FP가 더 중요하다고 생각하면 Precision / FN이 더 중요하다고 생각하면 Recall
but, FP-FN은 trade-off 관계이기 때문에, 둘 다 줄이는 것이 불가능 (어느 한 쪽이 줄어들면, 어느 한 쪽은 늘어남) -> 임계값을 어디로 정해야할지 결정하기 어려움
-> 이 때, 사용하는 것이 ROC curve (ROC curve가 위로 더 볼록해질수록 설명력이 좋아짐 b.c. AUC값이 커지기 때문)
❗️ 모델의 성능을 평가하는 것이 AUC: AUC 값을 통해 모델의 설명력을 비교할 수 있음