Black-Sholes Model Implementation in Python
,
is the cumulative distribution function() for a standard normal distribution shown below.
import numpy as np
import matplotlib.pyplot as plt # https://pythonguides.com/module-matplotlib-has-no-attribute-plot/
from scipy.stats import norm

N = norm.cdf

def BS_CALL(S, K, T, r, sigma):
    d1 = (np.log(S/K) + (r + sigma**2/2)*T) / (sigma*np.sqrt(T))
    d2 = d1 - sigma * np.sqrt(T)
    return S * N(d1) - K * np.exp(-r*T)* N(d2)

def BS_PUT(S, K, T, r, sigma):
    d1 = (np.log(S/K) + (r + sigma**2/2)*T) / (sigma*np.sqrt(T))
    d2 = d1 - sigma* np.sqrt(T)
    return K*np.exp(-r*T)*N(-d2) - S*N(-d1)
Effect of variables on Option Value
Effect of sigma (sigma as x-axis)
K = 100
r = 0.1
T = 1
s = 100

# x-axis
Sigmas = np.arange(0.1, 1.5, 0.01)

# y-axis
calls = [BS_CALL(s, K, T, r, sig) for sig in Sigmas]
puts = [BS_PUT(s, K, T, r, sig) for sig in Sigmas]

plt.plot(Sigmas, calls, label='Call Value')
plt.plot(Sigmas, puts, label='Put Value')
plt.xlabel('$\sigma$')
plt.ylabel('Value')
plt.legend()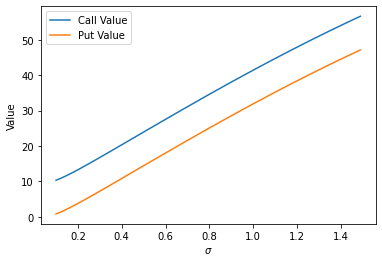
Effect of S (S as x-axis)
K = 100
r = 0.1
T = 1
sigma = 0.3

S = np.arange(60,140,0.1)

calls = [BS_CALL(s, K, T, r, sigma) for s in S]
puts = [BS_PUT(s, K, T, r, sigma) for s in S]

plt.plot(S, calls, label='Call Value')
plt.plot(S, puts, label='Put Value')
plt.xlabel('$S_0$')
plt.ylabel(' Value')
plt.legend()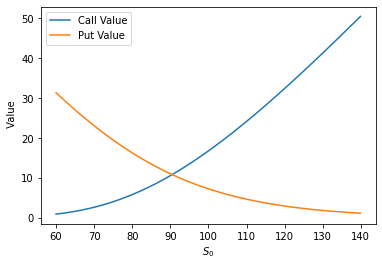

Engineering & Science, Since 2021 | Backend, Data, Economics

글이 많은 도움이 되었습니다, 감사합니다.