
본 포스팅은 elice의 2021 NIPA AI 온라인 교육을 듣고 개인 공부를 위해 정리한 것입니다.
3. 데이터 조작 및 분석을 위한 Pandas 기본
1) Series 데이터
Pandas
구조화 된 데이터를 효과적으로 처리하고 저장할 수 있는 파이썬 라이브러리
Array 계산에 특화된 NumPy를 기반으로 설계, 엑셀과 비슷한 데이터베이스 형태
Pandas의 자료형 중에 Series 데이터와 데이터프레임이 있다.
Series 데이터
NumPy의 array가 보강된 형태 Data와 Index를 가지고 있음, Data + Index!!
Series의 특징
- Series는 값(values)을 ndarray형태로 가지고 있음
✨ 데이터의 형태는 series인데 그 안에 들어가는 value는 ndarray!
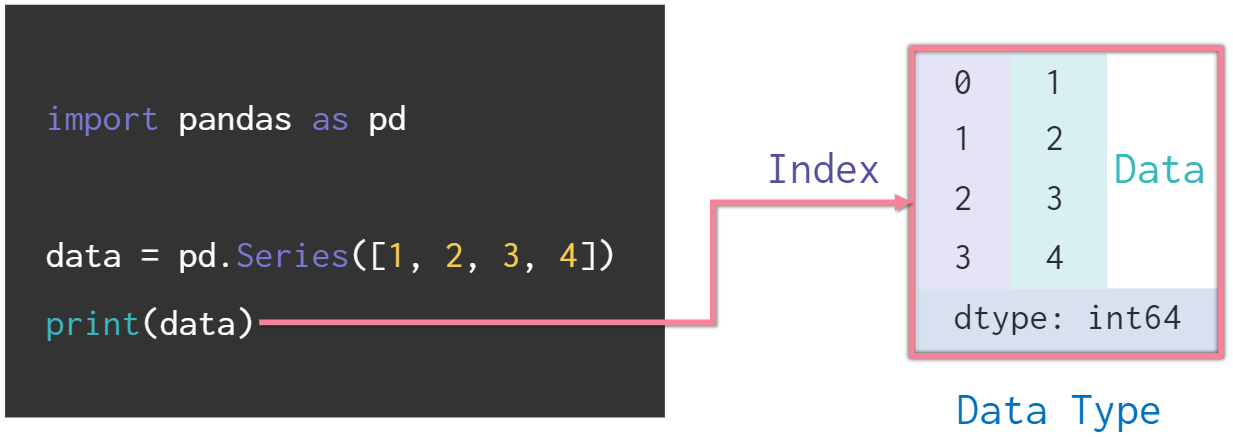
import pandas as pd
data = pd.Series([1, 2, 3 ,4])
print(data)

# 0 1 → index data
# 1 2
# 2 3
# 3 4
# dtype : int 64

print(type(data))
# <class 'pandas.core.series.Series'>
print(data.values)
# [1 2 3 4]
print(type(data.values))
# <class 'numpy.ndarray> - dtype 인자로 데이터 타입을 지정할 수 있음
data = pd.Series([1, 2, 3, 4], dtype = "float")
print(data.dtype) # float64- 인덱스를 지정할 수 있고 인덱스로 접근 가능
data = pd.Series([1, 2, 3, 4], index = ['a', 'b', 'c', 'd'])
data['c'] = 5 # 인덱스로 접근하여 요소 변경 가능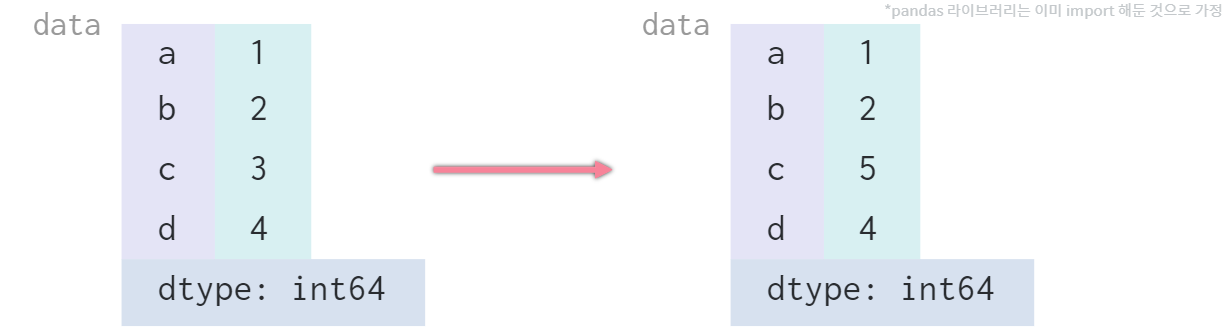
- Dictionary를 활용하여 Series 생성 가능
# 나라별 인구 수 dictionary
import pandas as pd

population_dict = {
    'china' : 141500,
    'japan' : 12718,
    'korea' : 5180,
    'usa' :32676
}

population = pd.Series(population_dict)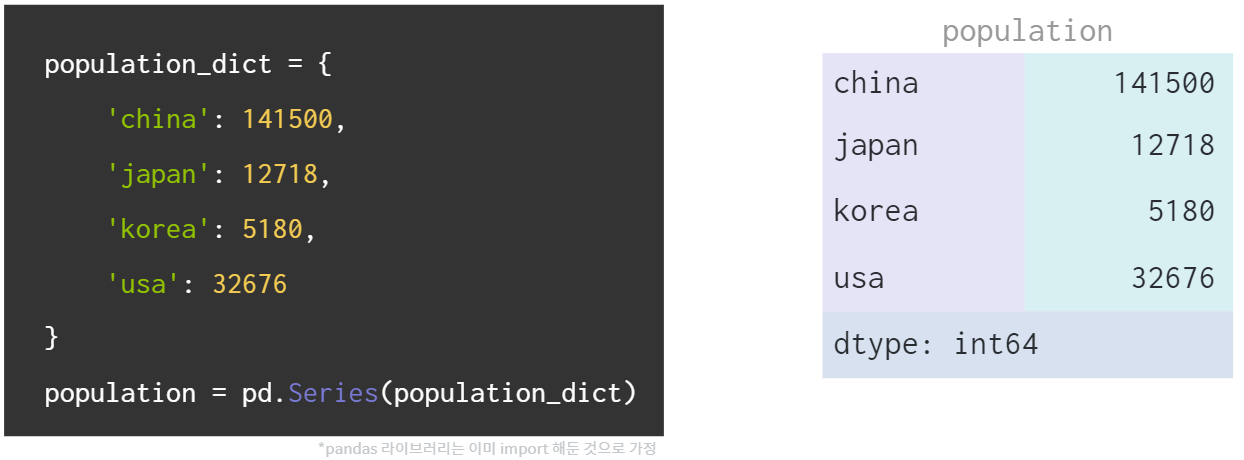
실습✍ Series 데이터
딕셔너리를 이용하여 국가별 인구 수 데이터를 시리즈로 만들어 country라는 변수에 저장해주세요.
그 다음 country 변수를 출력해주세요.
import numpy as np
import pandas as pd

# 예시) 시리즈 데이터를 만드는 방법.
series = pd.Series([1,2,3,4], index = ['a', 'b', 'c', 'd'], name="Title")
print(series, "\n")


# 국가별 인구 수 시리즈 데이터를 딕셔너리를 사용하여 만들어보세요.

country_dict = {
"korea" : 5180,
"japan" : 12718,
"china" : 141500,
"usa" : 32676
}

country = pd.Series(country_dict)

print(country)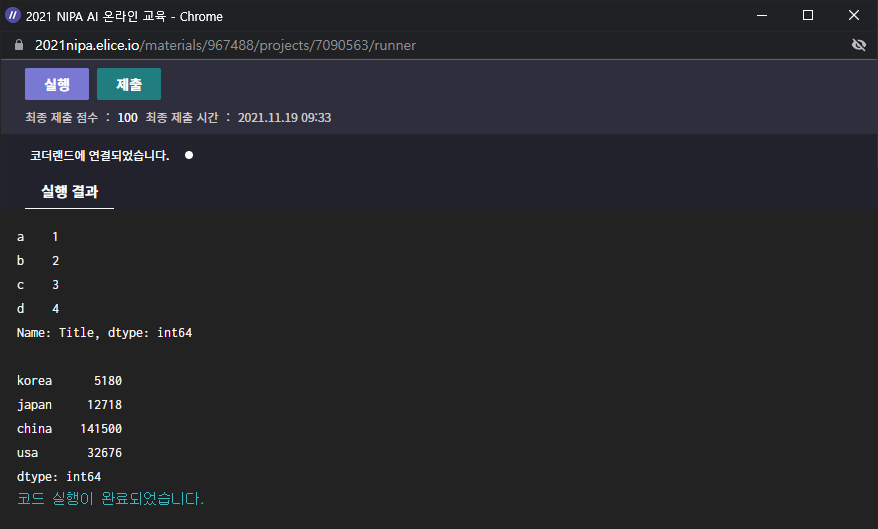
2) 데이터프레임
데이터프레임
여러 개의 Series가 모여서 행과 열을 이룬 데이터
데이터프레임 생성 방법
- 여러 Series를 모아 DataFrame을 만듦
import numpy as np
import pandas as pd
gdp_dict = {
"china" : 1409250000,
"japan" : 516700000,
"korea" : 169320000,
"usa" : 2041280000,
}
population_dict = {
'korea': 5180,
'japan': 12718,
'china': 141500,
'usa': 32676
}
gdp = pd.Series(gdp_dict)
population = pd.Series(population_dict)
country = pd.DataFrame({
"gdp" : gdp,
"population" : population
})
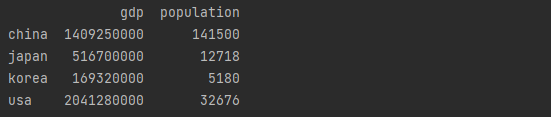
print(country)gdp와 population이 각 column으로 들어가게 된다.
- Dictionary를 활용하여 DataFrame 생성
import numpy as np
import pandas as pd
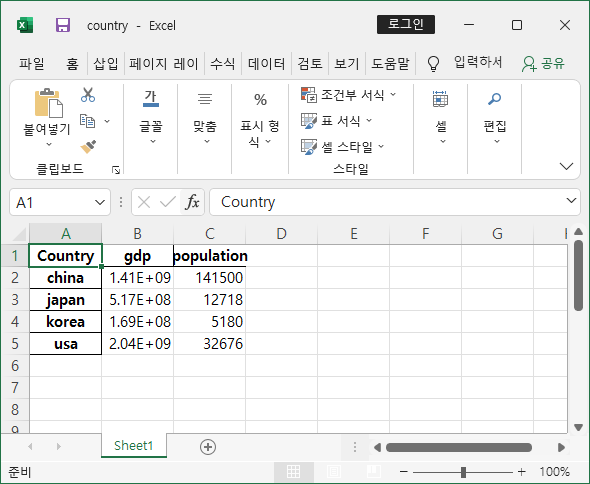
data = {
"country" : ["china", "japan", "korea", "usa"],
"gdp" : [1409250000, 516700000, 169320000, 2041280000],
"population" : [141500, 12718, 5180, 32676]
}
country = pd.DataFrame(data)
country = country.set_index("country") # index setting, country의 column을 인덱스화 하겠다는 뜻
print(country)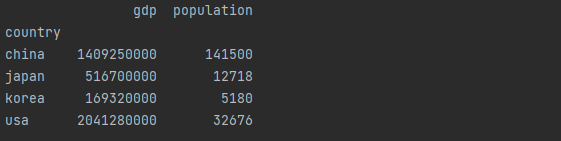
- 데이터프레임 생성 방법 정리
- 시리즈(
pd.Series([1,2,3,4])) → 데이터프레임(pd.Dataframe) - 딕셔너리(
data={key:value}) → 시리즈(pd.Series(data)) → 데이터프레임(pd.Dataframe) - 딕셔너리(
data={key:value}) → 데이터프레임(pd.Dataframe(data))
- 시리즈(
DataFrame 속성 확인하는 방법
shape, size, ndim, values
print(country.shape) # (4, 2) → index와 column은 제외, 즉 value에 해당하는 부분만
print(country.size) # 8 → 전체 요소의 개수
print(country.ndim) # 2 → 2차원
print(country.values)
#[[1409250000     141500]
# [ 516700000      12718]
# [ 169320000       5180]
# [2041280000      32676]]
DataFrame - index, columns 이름 지정
country.index.name = "Country" # 인덱스에 이름 지정
country.columns.name = "Info" # 컬럼에 이름 지정

print(country.index)
# Index(['china', 'japan', 'korea', 'usa'], dtype='object', name='Country')
print(country.column)
# Index(['gdp', 'population'], dtype='object', name='Info')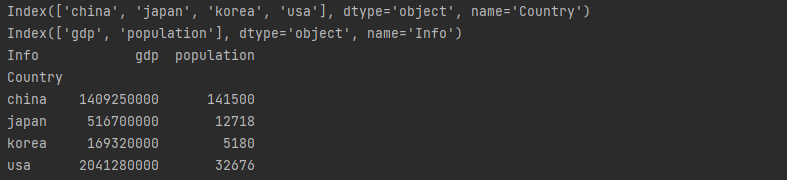
DataFrame - 저장 & 불러오기
csv(comma seperated value), 콤마로 구분된 값
excel 로도 저장 가능 → 확장자 xlsx
저장할 때는 to_, 불러올 때는 pd.read_
country.to_csv("./country.csv")
country.to_excel("country.xlsx")

country = pd.read_csv("./country.csv")
country = pd.read_excel("country.xlsx")- csv 로 저장하고 불러오기
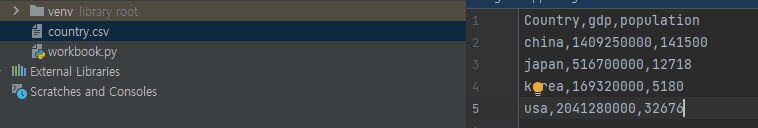
country.to_csv("./country.csv")
country = pd.read_csv("./country.csv")
country.csv 파일이 불러와졌고 데이터가 ,로 구분 된 것을 확인할 수 있다.
excel 로 저장하려고 했더니 오류나서 실패했다. 혹시 패키지를 설치해야하는 것일까?
😊 정답!pip3 install openpyxl로 openpyxl 모듈을 설치해주니 저장도 불러오기도 잘 되었다!
실습✍ 데이터프레임
- 국가별 인구를 나타내는 시리즈 데이터인 population과 국가별 GDP를 나타내는 시리즈 데이터인 gdp가 있습니다. 두 시리즈 데이터로 country라는 데이터 프레임을 만드세요. 반드시 population, gdp의 순서로 만들어주셔야 합니다.
- 완성한 데이터 프레임을 출력해보세요!
import numpy as np
import pandas as pd

# 두 개의 시리즈 데이터가 있습니다.
print("Population series data:")
population_dict = {
    'korea': 5180,
    'japan': 12718,
    'china': 141500,
    'usa': 32676
}
population = pd.Series(population_dict)
print(population, "\n")

print("GDP series data:")
gdp_dict = {
    'korea': 169320000,
    'japan': 516700000,
    'china': 1409250000,
    'usa': 2041280000,
}
gdp = pd.Series(gdp_dict)
print(gdp, "\n")


# 이곳에서 2개의 시리즈 값이 들어간 데이터프레임을 생성합니다.
print("Country DataFrame")
country = pd.DataFrame({
    "population" : population,
    "gdp" : gdp
})
print(country, "\n")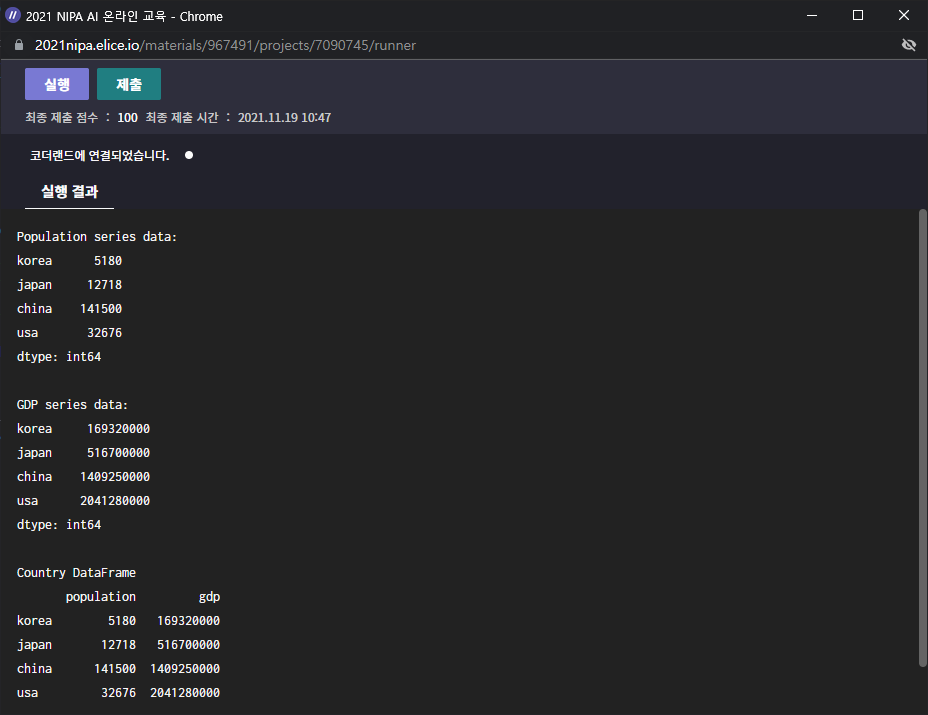
3) 데이터 선택 및 변경하기
데이터 선택 - Indexing & Slicing
.loc : location의 약자, 명시적인 인덱스를 참조하는 인덱싱/슬라이싱 함수,
'china', 'japan':'korea'처럼 특정한 인덱스를 지정하는 것을 명시적이라고 한다.
따라서 인덱스 안에 어떤 인덱스가 있는지 알 때 .loc를 사용한다.
- DataFrame
                gdp  population
china    1409250000      141500
japan     516700000       12718
korea     169320000        5180
usa 2041280000 32676 .loc를 이용한 인덱싱, 슬라이싱
country.loc["china"] # 인덱싱
country.loc['japan' : 'korea', :'population'] # 슬라이싱 .loc[index, column]- 인덱싱 결과값
gdp           1409250000
population        141500
Name: china, dtype: int64 - 슬라이싱 결과값
               gdp  population
japan    516700000       12718
korea    169320000        5180
❔❓ 데이터 프레임에서 슬라이싱할 때
['japan':'korea']이길래 korea는 포함 안되는 줄 알았다. 그런데 포함이네? 리스트랑 NumPy에서 슬라이싱할 때는 stop-1 이었는데.. index number가 아닌 이름으로 지정하면 다른가?
마찬가지로[ :population]도 population은 포함안되는 줄 알았는데 포함이 된다.
👉 명시적인 인덱스라서 그렇다!!!
.iloc는 암묵적인 인덱스, 파이썬 스타일의 정수 인덱스 인덱싱/슬라이싱 함수
암묵적인 순서가 있고 그에 따라 값을 추출하는 것이다.
- DataFrame
                gdp  population
china    1409250000      141500
japan     516700000       12718
korea     169320000        5180
usa 2041280000 32676 .iloc를 이용한 인덱싱, 슬라이싱
country.loc[0] # 인덱싱
country.loc[1:3, :2] # 슬라이싱 .iloc[index, column]- 인덱싱 결과값
gdp           1409250000
population        141500
Name: china, dtype: int64 - 슬라이싱 결과값
               gdp  population
japan    516700000       12718
korea    169320000        5180
데이터 선택 - column 선택
column명을 활용하여 DataFrame에서 데이터 선택이 가능
country
country['gdp'] # Series
country[['gdp']] # DataFrame
country
                gdp  population
china    1409250000      141500
japan     516700000       12718
korea     169320000        5180
usa 2041280000 32676 country['gdp']: Column 즉 Series
china    1409250000
japan     516700000
korea     169320000
usa      2041280000
Name: gdp, dtype: int64 country[['gdp']]: DataFrame 그 자체!
                gdp
china    1409250000
japan     516700000
korea     169320000
usa      2041280000
데이터 선택 - 조건 활용
DataFrame내 Value를 알고 있다면 Masking 연산이나 query 함수를 활용하여 조건에 맞는 DataFrame 행 추출 가능
country[country['population'] < 10000] # masking 연산 활용
country.query("population > 10000") # query 함수 활용
country
                gdp  population
china    1409250000      141500
japan     516700000       12718
korea     169320000        5180
usa 2041280000 32676 - masking 연산 :
country[country['population'] < 10000]
               gdp  population
korea 169320000 5180 - query 함수 활용 :
country.query("population > 100000")
                gdp  population
china    1409250000      141500
데이터 변경 - Column 추가
Series도 NumPy array처럼 연산자 활용 가능
- 1인당 GDP 구하기
gdp_per_capita = country['gdp']/country['population']
country['gdp_per_capita'] = gdp_per_capita
country['gdp_per_capita']
china     9959.363958
japan    40627.457147
korea    32687.258687
usa      62470.314604
Name: gdp_per_capita, dtype: float64country→ gdp_per_capita 라는 새로운 column 추가
                gdp  population  gdp_per_capita
china    1409250000      141500     9959.363958
japan     516700000       12718    40627.457147
korea     169320000        5180    32687.258687
usa      2041280000       32676    62470.314604
데이터 변경 - 데이터 추가/수정
리스트로 추가 or 딕셔너리로 추가
loc함수를 이용한다. iloc는 오류가 나더라고....🙄
- 데이터 추가
import numpy as np
import pandas as pd

df = pd.DataFrame(columns = ["이름","나이","주소"]) # 데이터프레임 생성
df.loc[0] = ["길동","26","서울"] # 리스트로 데이터 추가
df.loc[1] = {"이름":"철수", "나이":"25", "주소":"인천"} # 딕셔너리로 데이터 추가- 데이터 추가 결과
   이름  나이  주소
0  길동  26  서울
1 철수 25 인천- 데이터 수정 (위 데이터프레임에서 수정)
df.loc[1, "이름"] = "영희" # 명시적 인덱스 활용하여 데이터 수정- 데이터 수정 결과 : 철수 → 영희
   이름  나이  주소
0  길동  26  서울
1  영희  25  인천
데이터 변경 - NaN 컬럼 추가
np.nan : NaN값으로 초기화 한 새로운 컬럼 추가
NaN : Not a Number, 숫자가 아니라 비어있는 데이터라는 뜻
- 컬럼 추가
df["전화번호"] = np.nan # 새로운 컬럼 추가 후 초기화- 컬럼 추가 결과
   이름  나이  주소  전화번호
0  길동  26  서울   NaN
1 영희 25 인천 NaN- 데이터 수정
df.loc[0, "전화번호"] = "01012341234" # 명시적 인덱스 활용하여 데이터 수정- 데이터 수정 결과
   이름  나이  주소         전화번호
0  길동  26  서울  01012341234
1  영희  25  인천          NaN
데이터 변경 - column 삭제
DataFrame에서 컬럼 삭제 후 원본 변경, .drop 함수 사용
axis = 1 : 열방향 / axis = 0 : 행방향
inplace 매우 중요! inplace = True : 원본 변경 / inplace = False : 원본 변경 X
보통 원본 데이터를 따로 저장해놓고 사용해야 한다
df.drop("전화번호", axis = 1, inplace = True) # 컬럼 삭제- 컬럼 삭제 결과
   이름  나이  주소
0  길동  26  서울
1  영희  25  인천
실습✍ 조건을 충족하는 값 추출
- A컬럼 값이 0.5보다 작고 B컬럼 값이 0.3보다 큰 값들을 마스킹 연산을 활용하여 출력해보세요.
- 위와 같은 조건의 값들을 query 함수를 활용하여 출력해보세요.
- 주어진 DataFrame
import numpy as np
import pandas as pd

print("Masking & query")
df = pd.DataFrame(np.random.rand(5, 2), columns=["A", "B"])
print(df, "\n")
Masking & query
A B
0 0.685187 0.079008
1 0.796937 0.278779
2 0.699481 0.257803
3 0.025598 0.943518
4 0.067766 0.442099 - 답안 작성하기
# 데이터 프레임에서 A컬럼값이 0.5보다 작고 B컬럼 값이 0.3보다 큰값들을 구해봅시다.
# 마스킹 연산을 활용하여 출력해보세요!

print(df[(df["A"]<0.5) & (df["B"]>0.3)])

# query 함수를 활용하여 출력해보세요!

print(df.query("A < 0.5 and B > 0.3"))- 결과
          A         B
3  0.025598  0.943518
4  0.067766  0.442099

          A         B
3  0.025598  0.943518
4 0.067766 0.442099- query 함수는 잘 했는데 masking 연산은 실패했다.
각 조건을()로 묶어&연결시킨 뒤(df["A"]<0.5)&(df["B"]>0.3)불러올 때는 대괄호[]를 이용하여 데이터프레임을 불러온다.df[(df["A"]<0.5)&(df["B"]>0.3)]
실습✍ 새로운 컬럼 추가하기
- country의 두 컬럼을 이용하여 새로운 컬럼을 만들고자 합니다. 1인당 GDP 를 나타내는 새로운 컬럼인 gdp per capita를 데이터 프레임에 추가해보세요.
1인당 GDP는 gdp를 population으로 나누어 얻을 수 있습니다. - 완성한 데이터 프레임을 출력해보세요!
- 주어진 DataFrame
import numpy as np
import pandas as pd

# GDP와 인구수 시리즈 값이 들어간 데이터프레임을 생성합니다.
population = pd.Series({'korea': 5180,'japan': 12718,'china': 141500,'usa': 32676})
gdp = pd.Series({'korea': 169320000,'japan': 516700000,'china': 1409250000,'usa': 2041280000})
print("Country DataFrame")
country = pd.DataFrame({"population" : population,"gdp" : gdp})
print(country)
Country DataFrame
population gdp
korea 5180 169320000
japan 12718 516700000
china 141500 1409250000
usa 32676 2041280000- 답안 작성하기
# 데이터프레임에 gdp per capita 칼럼을 추가하고 출력합니다.
gdp_per_capita = country["gdp"] / country["population"]

country["gdp per capita"] = gdp_per_capita

print(country)- 결과
       population         gdp  gdp per capita
korea        5180   169320000    32687.258687
japan       12718   516700000    40627.457147
china      141500  1409250000     9959.363958
usa         32676  2041280000    62470.314604