
Data vs. Metrics
Data- collection of raw facts
Metric- single, quantifiable type of data that can be used for measurement
Data-Driven vs. Data-Inspired
Data-Driven Decision MakingData-Inspired Decision Making- explores different data sources to find out what they have in common
Algorithm- a process or set of rules to be followed for a specific task
Qualitative vs. Quantative
-
Quantitative Data- specific and objective measures of numerical facts
- ex. structured interviews, surveys, polls
-
Qualitative Data- subjective or explanaoory measures of qualities and characteristics
- ex. focus group, social media text analysis, in-person interviews
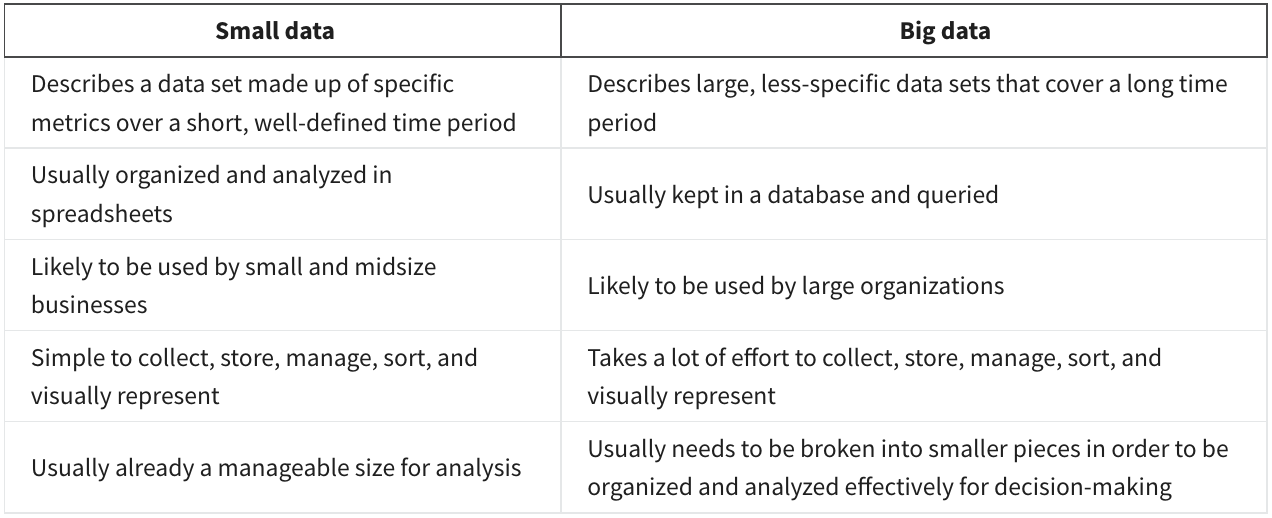
Small Data vs. Big Data
-
Small Data
- specific
- short well-defined-time-period
- day-to-day decisions
-
Big Data
- large and less-specific
- long time-period
- useful for looking at large-scale questions and problems
PROs- help spot the trends of patterns
- help understand the current market conditions
- help apply the feedbacks
CONs- may overload with unimportant and irrelevant information
- important data can be hidden
- not always accessible
- current tools still struggles to provide measurable data leading to unfair algorithmic bias
The Three (or Four) V's For Big Data- Volume : the amount of data
- Variety : the different kinds of data
- Velocity : how fast the data can be processed
- the quality and reliability of the data
Report vs. Dashboard
-
Report
- static collection of data given to stakeholders periodically
PROs- great at giving snapshots of high level historical data for an organization
- can be designed and sent out periodically
- quick to design and easy to use
- uses static data that reflects data that has already been cleaned and sorted
CONs- requires continual maintenance
- less visually pleasing
- static; ergo, does not reflect real-time
Pivot Table_spreadsheet- a data summarization tool that is used in data processing to sort, reorganize, group, count, total or average data stored in a database
-
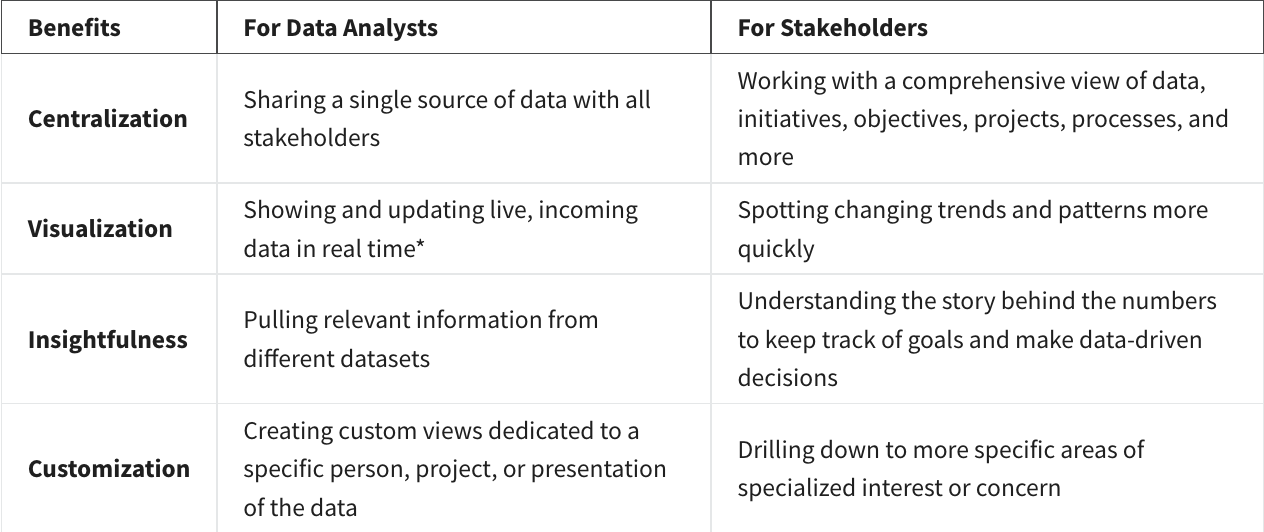
Dashboard
- monitors live and incoming data
PROs- dynamic, automatic, and interactive
- more stakeholder access
- low maintenance
CONs- labor-intensive design
- can be leff efficient than reports
- need to expect various errors
- potentially unlceaned data

데이터 분석가