Logistic Regression - 앙상블 기법
- 앙상블 학습 : 여러 개의 분류기를 생성하고 그 예측을 결합하여 정확한 최종 예측을 기대하는 기법. 다양한 분류기의 예측 결과를 결합함으로써 단일 분류기보다 신뢰성이 높은 예측값을 얻는 것. (정형 데이터를 대상으로 하는 분류기에서는 앙상블 기법이 뛰어난 성과를 보여주고 있다)
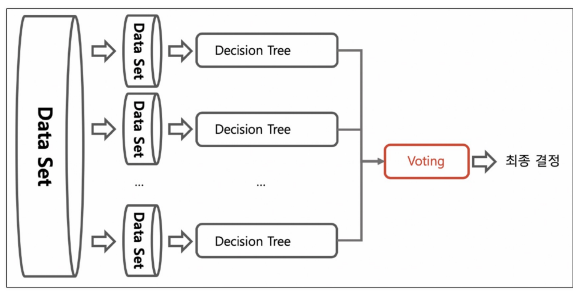
- voting

- bagging : 데이터를 중복으로 허용해서 샘플링하고 그 각각의 데이터에 같은 알고리즘을 적용해서 결과를 투표로 결정함. 각각의 분류기에 데이터를 각각 샘플링해서 추출하는 방식을 부트스트래핑(bootstrapping) 분할 방식이라고 한다
-
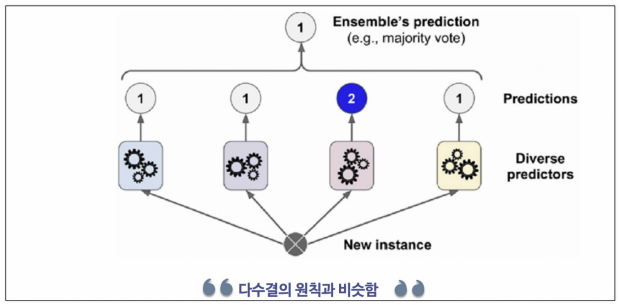
최종 결정에서 하드 보팅
-
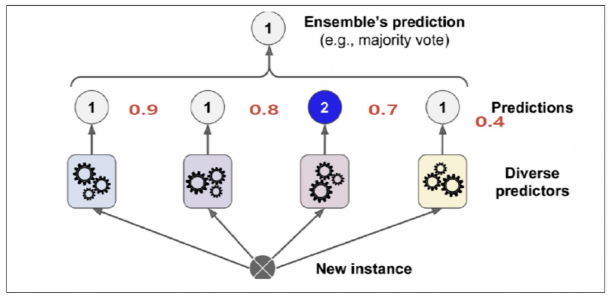
최종 결정에서 소프트보팅 (확률의 평균값(?))
-
랜덤 포레스트 Random Forest : 같은 알고리즘으로 구현하는 배깅(Bagging)의 대표적인 방법.
- 앙상블 방법 중에서 비교적 속도가 빠르며 다양한 영역에서 높은 성능을 보여주고 있다. → 부트스트래핑은 여러 개의 작은 데이터 셋을 중첩을 허용해서 만드는 것.
- 랜덤 포레스트는 결정나무를 기본으로 함 → 부트스트래핑으로 샘플링된 데이터마다 결정나무가 예측한 결과를 소프트보팅으로 최종 예측 결론을 얻음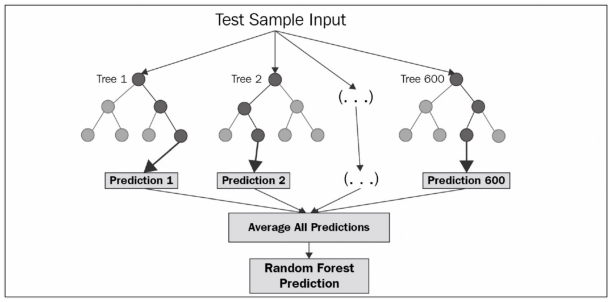
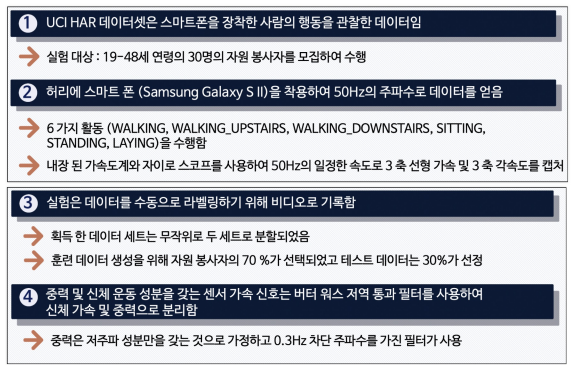
앙상블 기법 - HAR, Human Activity Recognition
-
IMU 센서를 활용해서 사람의 행동을 인식하는 실험
-
폰에 있는 가속도/자이로 센서 사용
-
데이터의 공식 경로 : https://archive.ics.uci.edu/ml/datasets/human+activity+recognition+using+smartphones
-
데이터의 특성
- 가속도계로부터 3축 가속도(총 가속도) 및 추정된 신체 가속도
- 자이로 스코프의 3축 각속도
- 시간 및 주파수 영역 변수가 포함된 561 기능 벡터
- 활동 라벨
- 실험을 수행한 대상의 식별자 -
데이터의 클래스 : Walking Upstairs, Standing, Walking Downstairs, Sitting, Laying, Walking
-
시간 영역의 데이터를 직접 사용하는 것은 어렵다.
- 시간영역 데이터를 머신러닝에 적용하기 위해 여러 통계적 데이터로 변환함
- 시간 영역의 평균, 분산, 피크, 중간 값, 주파수 영역의 평균, 분산 등으로 변환한 수치를 가지고 있다 -
센서 신호 → 특징추출 → 모델학습 → 행동추론
# 데이터 읽기

import pandas as pd
import matplotlib.pyplot as plt

%matplotlib inline
url = 'https://raw.githubusercontent.com/PinkWink/ML_tutorial/master/dataset/HAR_dataset/features.txt'
feature_name_df = pd.read_csv(url, sep='\s+', header=None,
names=['column_index', 'column_name'])
# sep='\s+' : 길이가 정해지지 않은 공백이 구분자인 경우에는 \s+ 정규식(regular expression) 문자열을 사용
# 참고 : https://datascienceschool.net/01%20python/04.02%20%EB%8D%B0%EC%9D%B4%ED%84%B0%20%EC%9E%85%EC%B6%9C%EB%A0%A5.html
# names= : column이름 설정
feature_name_df.head()
# 특성만 561개

len(feature_name_df)
feature_name = feature_name_df.iloc[:, 1].values.tolist()
feature_name[:10]# X 데이터 읽기
X_train_url = 'https://raw.githubusercontent.com/PinkWink/ML_tutorial/master/dataset/HAR_dataset/train/X_train.txt'
X_test_url = 'https://raw.githubusercontent.com/PinkWink/ML_tutorial/master/dataset/HAR_dataset/test/X_test.txt'
X_train = pd.read_csv(X_test_url, sep='\s+', header=None)
X_test = pd.read_csv(X_test_url, sep='\s+', header=None)
X_train.columns = feature_name
X_test.columns = feature_nameX_train.head()X_train.info()X_test.head()X_test.info()# y 데이터 읽기
y_train_url = 'https://raw.githubusercontent.com/PinkWink/ML_tutorial/master/dataset/HAR_dataset/train/y_train.txt'
y_test_url = 'https://raw.githubusercontent.com/PinkWink/ML_tutorial/master/dataset/HAR_dataset/test/y_test.txt'
y_train = pd.read_csv(y_test_url, sep='\s+', header=None, names = ['action'])
y_test = pd.read_csv(y_test_url, sep='\s+', header=None, names=['action'])
X_train.shape, X_test.shape, y_train.shape, y_test.shape# 각 액션별 데이터의 수
# 1. Walking
# 2. WalkingUpstairs
# 3. WalkingDownstairs
# 4. Sitting
# 5. Standing
# 6. Laying
y_train['action'].value_counts()Logistic Regression - 앙상블 기법 - HAR 데이터 - Decisioon Tree 적용
# 결정나무

from sklearn.tree import DecisionTreeClassifier
from sklearn.metrics import accuracy_score

dt_clf = DecisionTreeClassifier(random_state=13, max_depth=4)
dt_clf.fit(X_train, y_train)
pred = dt_clf.predict(X_test)

accuracy_score(y_test, pred)
# max_depth를 다양하게 하기 위해 GridSearchCV 이용

from sklearn.model_selection import GridSearchCV

params = {'max_depth' : [6, 8, 10, 12, 16, 20, 24]}

grid_cv = GridSearchCV(dt_clf, param_grid=params, scoring='accuracy',
                       cv = 5, return_train_score=True) # cv data를 5개로 나눈(?)

grid_cv.fit(X_train, y_train)
# max_depth 16이 좋다고 함(?) 자료와 다름;;;

grid_cv.best_score_grid_cv.best_params_# max_depth 별로 표로 성능을 정리(test데이터는 아직 안함, 여기는 데이터 나눈거를 해본것)
cv_result_df = pd.DataFrame(grid_cv.cv_results_)
cv_result_df[['param_max_depth', 'mean_test_score', 'mean_train_score']]# 실제 test 데이터에서의 결과
max_depths = [6, 8, 10, 12, 16, 20, 24]
for depth in max_depths:
dt_clf = DecisionTreeClassifier(max_depth=depth, random_state=156)
dt_clf.fit(X_train, y_train)
pred = dt_clf.predict(X_test)
accuracy = accuracy_score(y_test, pred)
print('Max_Depth = ', depth, ', Accuracy = ', accuracy)# 베스트 모델 결과
best_dt_clf = grid_cv.best_estimator_
pred1 = best_dt_clf.predict(X_test)
accuracy_score(y_test, pred1)
Logistic Regression - 앙상블 기법 - HAR 데이터 - Random Forest 적용
# 랜덤포레스트 적용

from sklearn.model_selection import GridSearchCV
from sklearn.ensemble import RandomForestClassifier

params = {
    'max_depth' : [6, 8, 10],
    'n_estimators' : [50, 100, 200], # n_estimators : 사용할 tree수
    'min_samples_leaf' : [8, 12], # min_samples_leaf : 가장 마지막 잎(항목)의 최소 데이터 개수
    'min_samples_split' : [8, 12] # min_samples_split : 분할 기준 최소 데이터
}
rf_clf = RandomForestClassifier(random_state=13, n_jobs=-1) # n_jobs : 사용할 cpu 코어 수
grid_cv = GridSearchCV(rf_clf, param_grid=params, cv = 2, n_jobs=-1)
grid_cv.fit(X_train, y_train)
# 결과 정리를 위한 작업
cv_results_df = pd.DataFrame(grid_cv.cv_results_)
cv_result_df.columnscv_result_df.head()# 성능이 좋음
target_col = ['rank_test_score', 'mean_test_score', 'param_n_estimators', 'param_max_depth']
cv_results_df[target_col].sort_values('rank_test_score').head()# best 모델
grid_cv.best_params_grid_cv.best_score_# test 데이터에 적용
rf_clf_best = grid_cv.best_estimator_
rf_clf_best.fit(X_train, y_train)pred1 = rf_clf_best.predict(X_test)
pred1accuracy_score(y_test, pred1)# 중요 특성 확인
# 영향력 높은 feature들 중 20개만 가져오기
best_cols_values = rf_clf_best.feature_importances_
best_cols = pd.Series(best_cols_values, index=X_train.columns)
best_cols_values, best_cols
# 각 특성들의 중요도가 개별적으로 높지 않다.

top20_cols = best_cols.sort_values(ascending=False)[:20]
top20_cols
# 주요 특성 관찰
import seaborn as sns
plt.figure(figsize=(8, 8))
sns.barplot(x=top20_cols, y=top20_cols.index)
plt.show()# 주요 20개 특성
top20_cols.index# 20개의 특성만 가지고 다시 성능 확인
X_train_re = X_train[top20_cols.index]
X_test_re = X_test[top20_cols.index]
# 561개의 특성보다 20개의 특성만 보면 연산속도가 정말 빠를 것이다.
# accuracy는 약간 떨어지더라도

rf_clf_best_re = grid_cv.best_estimator_
rf_clf_best_re.fit(X_train_re, y_train.values.reshape(-1,))

pred1_re = rf_clf_best_re.predict(X_test_re)

accuracy_score(y_test, pred1_re)
많이 어렵...ㅠㅠ
💻 출처 : 제로베이스 데이터 취업 스쿨