다양한 라이브러리 중 Recharts를 사용하여 그래프를 구현했다.
사이트 : https://recharts.org/en-US
1. 라이브러리 설치
$ npm install recharts2. 원하는 형태의 그래프 샘플 가져오기
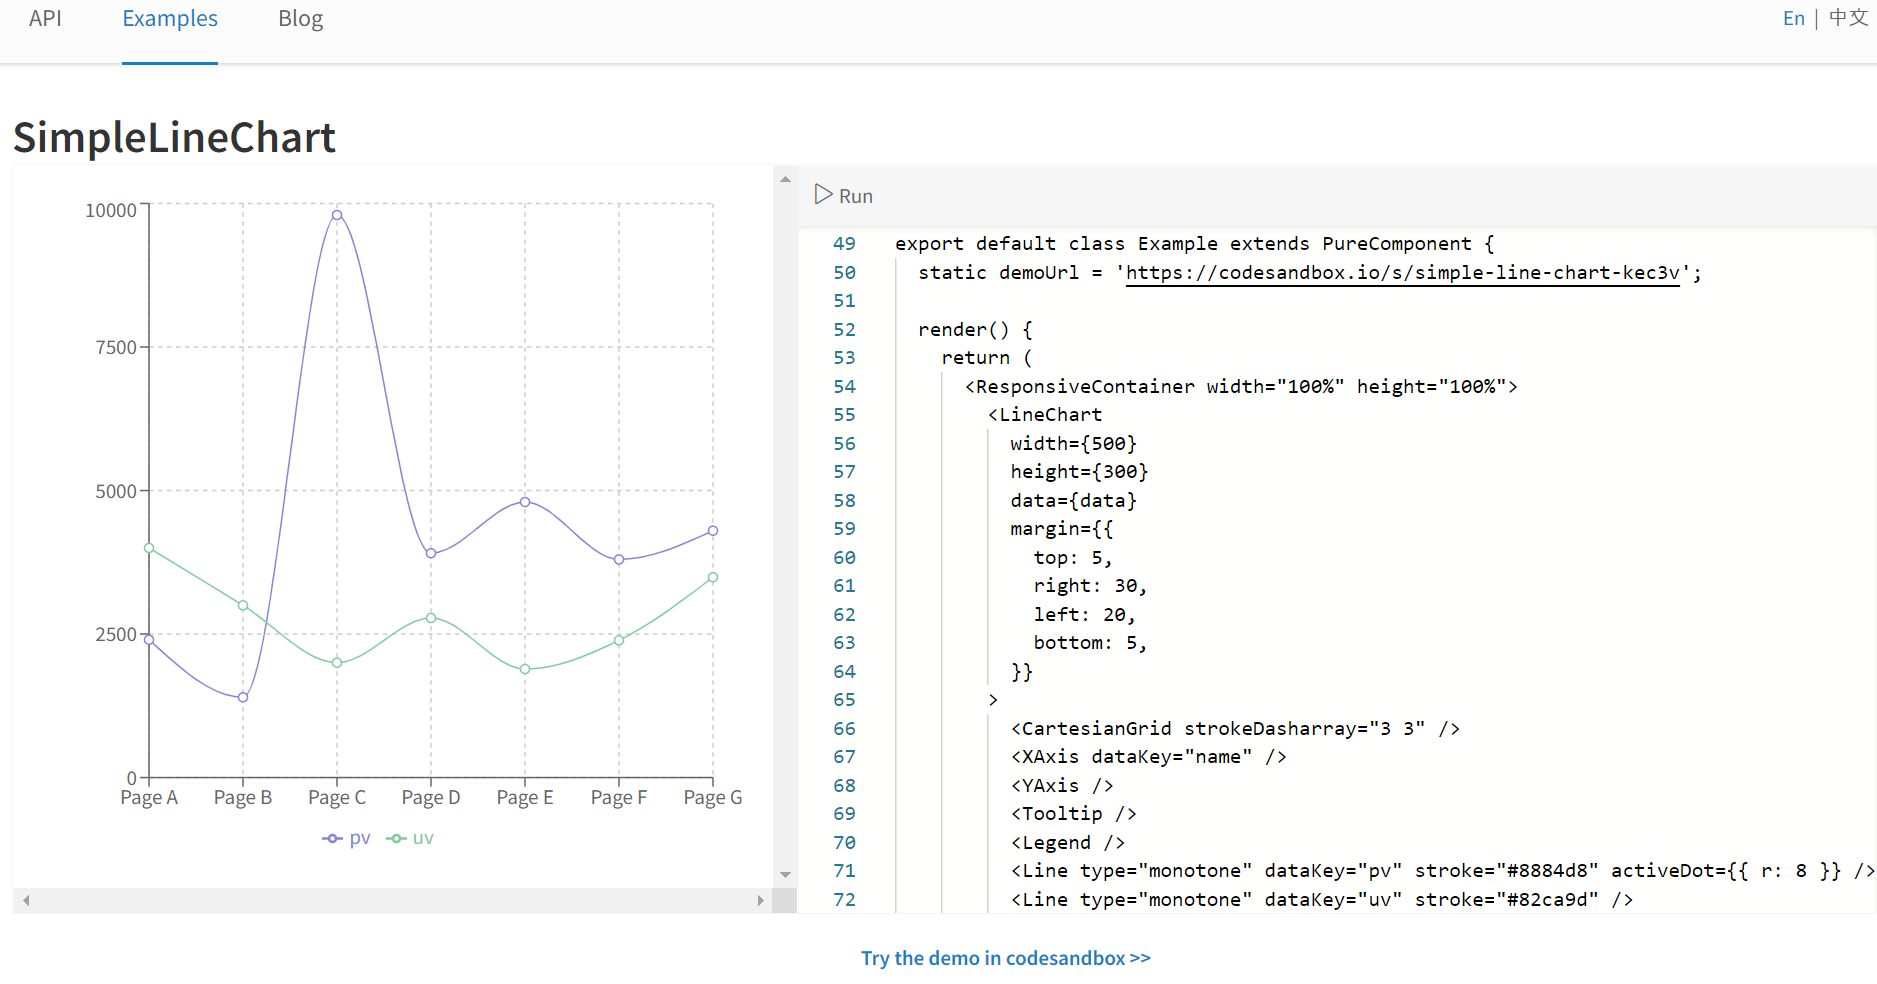
- 샘플 코드는 class형 컴포넌트로 되어 있으나 하단의 codesandbox를 누르면 함수형 컴포넌트로 가져올 수 있다
const data = [
  {
    name: "Page A",
    uv: 4000,
    pv: 2400,
    amt: 2400
  },
  {
    name: "Page B",
    uv: 3000,
    pv: 1398,
    amt: 2210
  },
  {
  ...
  }
];
// 그래프 sample 코드
import "./styles.css";
import React from "react";
import {
  LineChart,
  Line,
  XAxis,
  YAxis,
  CartesianGrid,
  Tooltip,
  Legend
} from "recharts";

export default function App() {
  return (
    <LineChart
      width={500}
      height={300}
      data={data}
      margin={{
        top: 5,
        right: 30,
        left: 20,
        bottom: 5
      }}
    >
      <CartesianGrid strokeDasharray="3 3" />
      <XAxis dataKey="name" />
      <YAxis />
      <Tooltip />
      <Legend />
      <Line
        type="monotone"
        dataKey="pv"
        stroke="#8884d8"
        activeDot={{ r: 8 }}
      />
      <Line type="monotone" dataKey="uv" stroke="#82ca9d" />
    </LineChart>
  );
}
3. 그래프 적용 하기
// GraphLayout.js
import {
  ResponsiveContainer, // 반응형
  LineChart,
  Line,
  XAxis,
  YAxis,
  CartesianGrid,
  Tooltip,
  Legend,
} from 'recharts';

export const GraphLayout = ({ selectedDate, formatXAxis, dataKey, stroke }) => {
  return (
    <ResponsiveContainer width={'100%'} height={'100%'}>
      <LineChart
        width={800}
        height={300}
        data={selectedDate}
        margin={{
          top: 40,
          right: 30,
          left: 0,
          bottom: 20,
        }}
      >
        <CartesianGrid strokeDasharray="3 3" />
        <XAxis dataKey="created_at" tickFormatter={formatXAxis} />
        <YAxis type="number" domain={['dataMin - 5.0', 'dataMax + 15.0']} />
        <Tooltip />
        <Legend />
        <Line
          type="monotone"
          dataKey={dataKey}
          stroke={stroke}
          activeDot={{ r: 8 }}
        />
      </LineChart>
    </ResponsiveContainer>
  );
};
ResponsiveContainer : 반응형 그래프
XAxis : X축 데이터
- datakey : X축의 기준이 되는 데이터
- tickFormatter : 데이터 형태
YAxis : Y축 데이터
- Line의 datakey : Y축의 기준이 되는 데이터
- domain : Y축 범위 (dataMin : 최소, dataMax : 최대)