MNIST를 사용하여 분류(Classification) 작업(1) sklearn 사용.
-
출처: https://box-world.tistory.com/45 -> 자료 오래 되어 업데이트 필요함.
-
데이터 분석: MNIST 데이터셋은 고등학생과 미국 인구조사국 직원들이 손으로 쓴 70000개의 작은
숫자 이미지로 구성되어있습니다.
각 이미지에는 어떤 숫자를 나타내는지 Label은 붙어있지 않습니다.
sklearn에서는 MNIST 데이터셋 등 일반적으로 알려진 데이터셋을 내려받을 수 있는 함수를 제공합니다
# (1)
import pandas as pd
import numpy as np
import sklearn

from sklearn.datasets import fetch_openml   # 버전 업그레이드 -> fetch_openml 으로 변경 되었다.
# (2)
mnist = fetch_openml('mnist_784', version = 1)
mnist.keys()
## -> dict_keys(['data', 'target', 'frame', 'categories', 'feature_names', 'target_names', 'DESCR', 'details', 'url'])# (3)
# data : 데이터가 하나의 행, feature가 하나의 열로 구성된 배열을 가짐
# target : label을 담아놓은 배열
X, y = mnist["data"], mnist["target"]
X.shape
## -> (70000, 784) ## 70000개의 이미지는 28 * 28 픽셀이기 때문에 784개의 feature를 가지고 있습니다.# (4)
y.shape
## -> (70000,)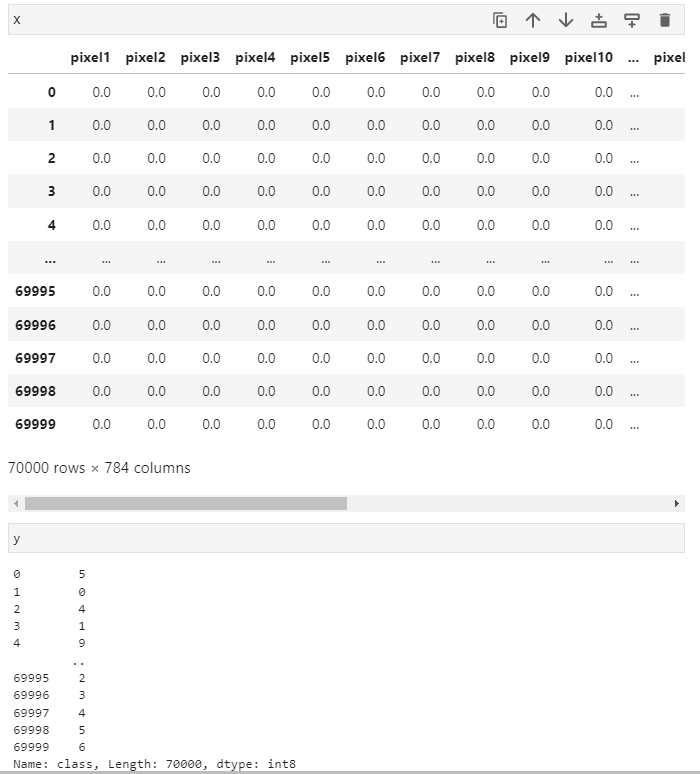
: x가 자동으로 데이터 프라임화 되어있는걸 볼 수 있다.
오류 확인하기(1)
# (5)  1) 이미지의 feature 벡터를 28 * 28 배열로 크기를 바꾸고,
#     2) matplotlib의 imshow() 함수를 사용해 그려줍니다.

import matplotlib as mpl
import matplotlib.pyplot as plt

some_digit = X[0]     # 자동으로 데이터 프라임 되어서 넘파이로 바꿔주어야함.
some_digit_image = some_digit.reshape(28,28)  # 벡터의 크기를 바꾸고(28,28)

plt.imshow(some_digit_image, cmap="binary")   # imshow 그려줌, cmap: heatmap 색설정
plt.axis("off") # 좌표가 사라진다.
plt.show()-
KeyError: 0
-
X[0] -> X.to_numpy()[0] # 자동으로 데이터 프라임 되어서 넘파이로 바꿔주어야함.
# (6)
y[0]

## ->'5'  #  위 이미지의 label을 확인해보겠습니다.
# (7)
y = y.astype(np.uint8) # 이때 label은 문자열입니다. 그러나 머신러닝 알고리즘에서는 숫자를 사용해야하기 때문에 y를 정수로 변환해줘야 합니다.오류 확인하기(2)
# (8) 전체적인 MNIST 이미지 샘플들을 보면 분류 작업

from sklearn.model_selection import StratifiedKFold
from sklearn.base import clone
skfolds = StratifiedKFold(n_splits=3, ~shuffle=True~, random_state = 42)

for train_index, test_index in skfolds.split(X_train, y_train_5):
    clone_clf = clone(sgd_clf)
    X_train_folds = X_train~.loc~[train_index]
    y_train_folds = y_train_5.loc[train_index]
    X_test_fold = X_train.loc[test_index]
    y_test_fold = y_train_5.loc[test_index]

    clone_clf.fit(X_train_folds, y_train_folds)
    y_pred = clone_clf.predict(X_test_fold)
    n_correct = sum(y_pred == y_test_fold)
print(n_correct / len(y_pred))-
ValueError: Setting a random_state has no effect since shuffle is False. You should leave random_state to its default (None), or set shuffle=True.
-> shuffle=True.추가함. 디폴트값이 (shuffle=False) 이였음. -
KeyError: "None of [Int64Index([ 1, 3, 4, 5, 7, 8, 10, 11, 12,\n 13,\n ...\n 59984, 59985, 59987, 59988, 59989, 59991, 59993, 59994, 59996,\n 59998],\n dtype='int64', length=40000)] are in the [columns]"
-
X_train[train_index] -> X_train.loc[train_index] 붙여줌.
데이터 변환의 문제. 기본 넘파이였으나 자동으로 데이터 프레임 됨. 그렇기에 데이터프라임 상태에서 값을 가져오려면 loc로 가져와야한다.
# (6)
def plot_digits(instances, images_per_row=10, **options):
    size = 28
    images_per_row = min(len(instances), images_per_row)
    images = [instance.reshape(size,size) for instance in instances]
    n_rows = (len(instances) - 1) // images_per_row + 1
    row_images = []
    n_empty = n_rows * images_per_row - len(instances)
    images.append(np.zeros((size, size * n_empty)))
    for row in range(n_rows):
        rimages = images[row * images_per_row : (row + 1) * images_per_row]
        row_images.append(np.concatenate(rimages, axis=1))
    image = np.concatenate(row_images, axis=0)
    plt.imshow(image, cmap = mpl.cm.binary, **options)
    plt.axis("off")

plt.figure(figsize=(9,9))
example_images = X.to_numpy()[:100]
plot_digits(example_images, images_per_row=10)
save_fig("more_digits_plot")
plt.show()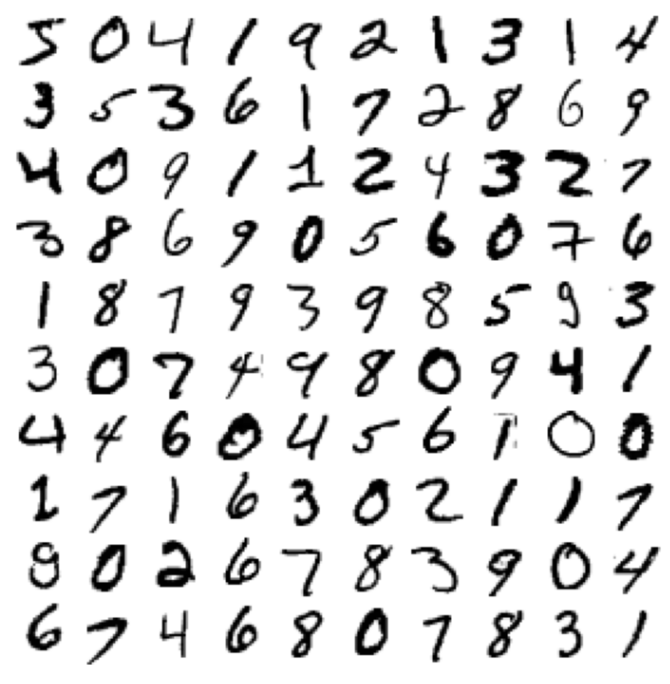
# (7) 데이터셋을 6:1 비율의 training set과 test set으로 분리하겠습니다.
# 우리가 사용할 training set의 경우 이미 섞여 있어 별도의 함수를 사용하지 않았습니다.
X_train, X_test, y_train, y_test = X[:60000], X[60000:],y[:60000],y[60000:]
# (8) 이진 분류기 훈련, target vector를 만들어 보겠습니다
y_train_5 = (y_train == 5) # 5는 True, 다른 숫자는 모두 False
y_test_5 = (y_test == 5)# (9) 분류 모델을 만들어 훈련시켜보겠습니다.
#sklearn의 SGDClassifier 클래스의 확률적 경사 하강법(Stochastic Gradient Descent)입니다.
# SGD는 Loss function 계산 시 전체가 아닌 일부 데이터셋을 이용하기 때문에 속도가 빨라서 매우 큰 데이터셋을 다루는데 효과적입니다.
from sklearn.linear_model import SGDClassifier
sgd_clf = SGDClassifier(random_state = 42)
sgd_clf.fit(X_train, y_train_5)# (10) 훈련된 모델을 이용해 숫자 5의 이미지를 감지해보겠습니다.
sgd_clf.predict([some_digit])
## -> array([ True])MNIST를 사용하여 분류(Classification) 작업(2) tensorflow 사용.
## 0. tensorflow 불러오기

# tensorflow 라이브러리를 불러옵니다.
import tensorflow as tf
## 1. MNIST 데이터셋 임포트
#tensorflow에서 직접 MNIST 손글씨 이미지 데이터셋을 불러와서 사용합니다.
#load_data() 함수는 x_train, y_train, x_test, y_test 네 개의 NumPy 어레이를 반환합니다.
mnist = tf.keras.datasets.mnist
(x_train, y_train), (x_test, y_test) = mnist.load_data()## 2. 데이터 전처리
#0~255.0 사이의 값을 갖는 픽셀값들을 0~1.0 사이의 값을 갖도록 변환합니다.
x_train, x_test = x_train/255.0, x_test/255.0
## 3. 모델 구성

# tf.keras.models.Sequential()을 이용해서 인공신경망 모델을 구성합니다.
# 입력층 (Input layer)에서 Flatten()을 이용해서 28×28 픽셀의 값을 784개의 1차원 배열로 변환합니다.
# 다음 두 개의 뉴런 층 (Neuron layer)은 Dense()를 이용해서 완전 연결된 층 (Fully-connected layer)를 구성합니다.
# 각 층은 512개와 10개의 인공 뉴런 노드를 갖고 활성화 함수 (activation function)로는 각각 ReLU (tf.nn.relu)와 소프트맥스 (tf.nn.softmax)를 사용합니다.
model = tf.keras.models.Sequential([
    tf.keras.layers.Flatten(input_shape=(28, 28)),
    tf.keras.layers.Dense(512, activation=tf.nn.relu),
    tf.keras.layers.Dense(10, activation=tf.nn.softmax)
])
## 4. 모델 컴파일
# 손실 함수를 줄이기 위해 사용되는 optimizer로는 Adam을 사용합니다
# 손실 함수는 ‘sparse_categorical_crossentropy’를 지정하고,
# 평가 지표로는 정확도 (accuracy)를 사용합니다
model.compile(optimizer='adam',
loss='sparse_categorical_crossentropy',
metrics=['accuracy'])## 5. 모델 훈련
# model.fit() 메서드에 학습 데이터와, 레이블, 에포크를 순서대로 입력하면, 학습이 이루어집니다.
# 에포크(epoch)는 60,000개의 전체 학습 데이터를 몇 번 반복해서 학습할지를 의미합니다.
model.fit(x_train, y_train, epochs=5)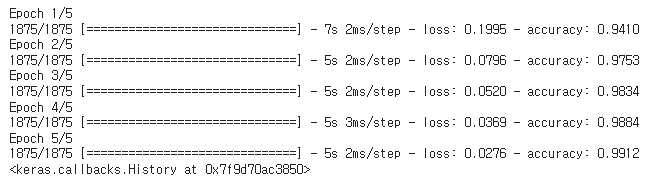
## 정확도 평가

# 10,000개의 테스트 샘플에 대해 손실 (loss)과 정확도 (accuracy)를 평가합니다.
test_loss, test_acc = model.evaluate(x_test, y_test)
print('테스트 정확도:', test_acc)
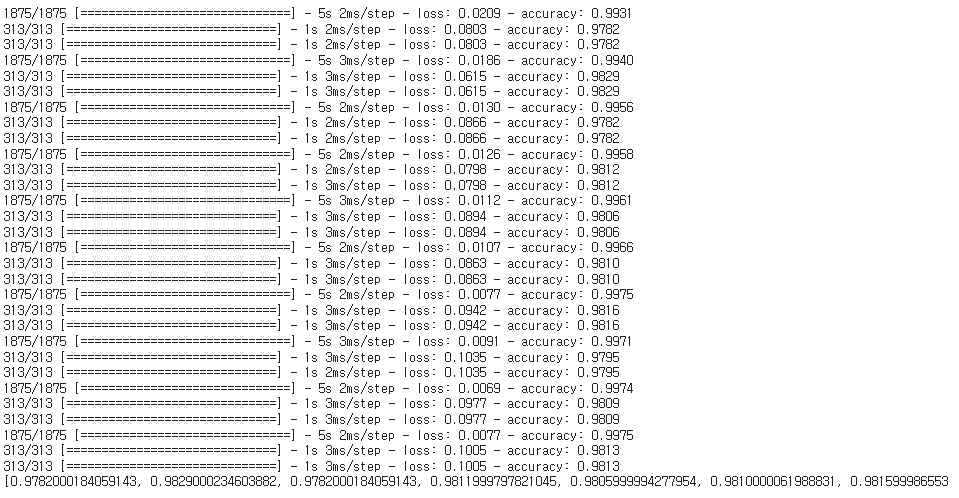
# Matplotlib을 이용해서 에포크에 따른 정확도 (accuracy)와 손실 (loss) 값을 확인할 수 있습니다.
# 1회의 에포크마다 model.evaluate()의 loss, accuracy 값을 저장합니다.
loss, accuracy = [], []
for i in range(10):
    model.fit(x_train, y_train, epochs=1)
    loss.append(model.evaluate(x_test, y_test)[0])
    accuracy.append(model.evaluate(x_test, y_test)[1])
print(accuracy)