vm에 Ops Agent설치
config 파일 변경해 Prometheus target resource 타입으로 생성 및 전송
cloud monitoring을 통해 확인
하는 작업을 합니다.
Ops Agent 설치
https://cloud.google.com/stackdriver/docs/solutions/agents/ops-agent/installation
최신버전 설치
curl -sSO https://dl.google.com/cloudagents/add-google-cloud-ops-agent-repo.sh
sudo bash add-google-cloud-ops-agent-repo.sh --also-install
설치 완료

metric이 제대로 수집되고 있는지 확인합니다.
값이 잘 들어오고 있습니다.
JSON exporter 설치
Prerequisites
sudo apt-get update && sudo apt-get install -y git curl make python3 golang-gojson exporter
# clone repo
git clone https://github.com/prometheus-community/json_exporter.git
cd json_exporter
git checkout v0.5.0


# build binary
make build


# run simple web server
python3 -m http.server 8000 &


# run exporter
./json_exporter --config.file examples/config.yml &
설치 테스트
설가 잘 됐다면 exporter는 7979번에서 metric을 공개하고 있습니다.
curl "http://localhost:7979/probe?module=default&target=http://localhost:8000/examples/data.json"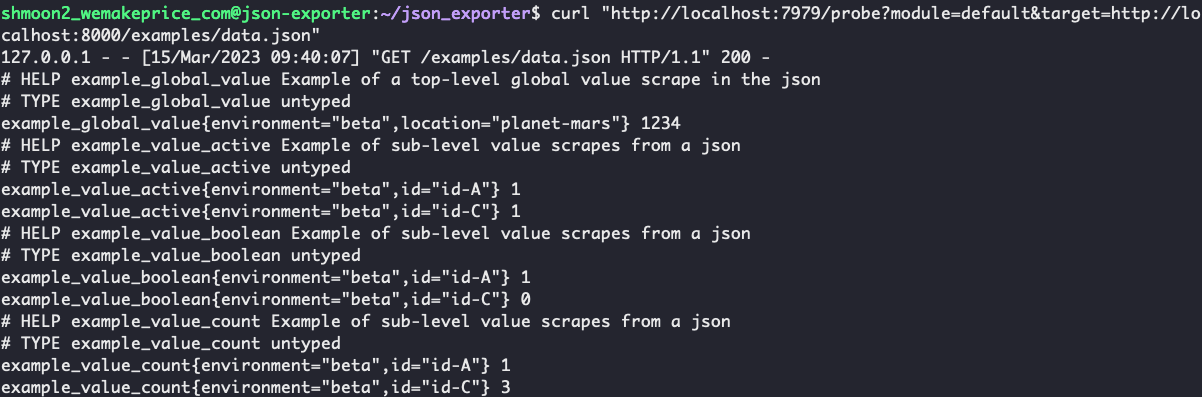
configure Ops Agent
https://cloud.google.com/monitoring/agent/ops-agent/prometheus#oagent-prom-receiver-config
https://cloud.google.com/monitoring/agent/ops-agent/configuration#config-intro
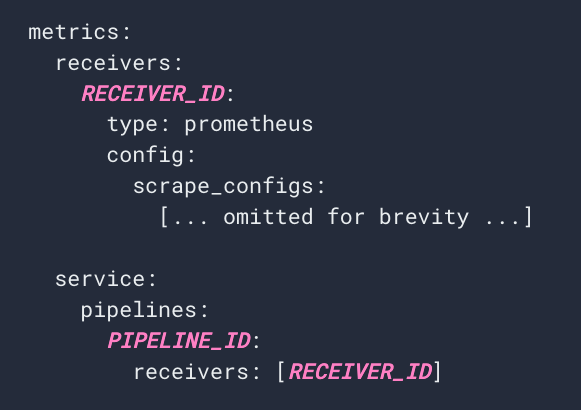
prometheus receiver를 설정해줄때는 processor 부분은 따로 정의해주지 않아도 괜찮습니다.
prometheus 쪽에서 relabel 등을 할 때 처리해주기 때문입니다.
그렇기 때문에 service에서 pipeline을 정의할 때 receiver만 작성해주면 됩니다.
예시
ops agent의 config.yaml파일을 수정해줍니다.

type과 pipeline을 prometheus 로 설정해줍니다.
config.yaml 파일 내용
metrics:
  receivers:
    prometheus:
        type: prometheus
        config:
          scrape_configs:
            - job_name: 'json_exporter'
              scrape_interval: 10s
              metrics_path: /probe
              params:
                module: [default]
                target: [http://localhost:8000/examples/data.json]
              static_configs:
                - targets: ['localhost:7979']
  service:
    pipelines:
      prometheus_pipeline:
        receivers:
          - prometheus
config 적용을 위해 서비스를 재시작합니다.
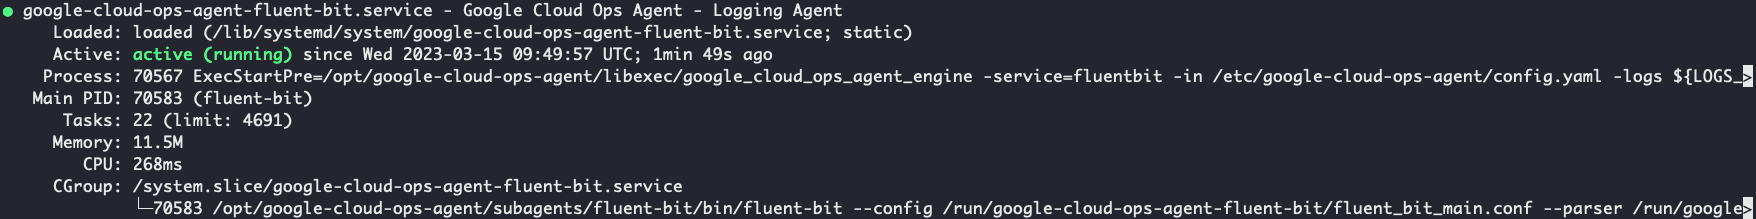
sudo service google-cloud-ops-agent restartmetrics agent와 logging agent가다시 잘 올라왔는지 확인합니다.
sudo systemctl status google-cloud-ops-agent"*"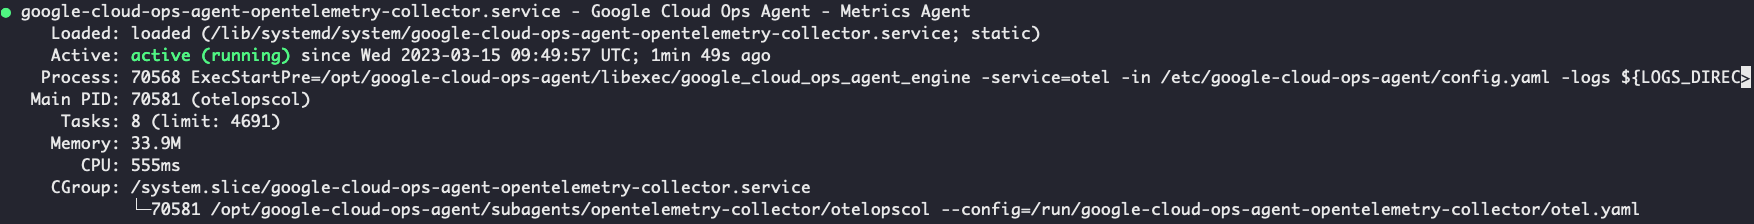
Cloud Monitoring
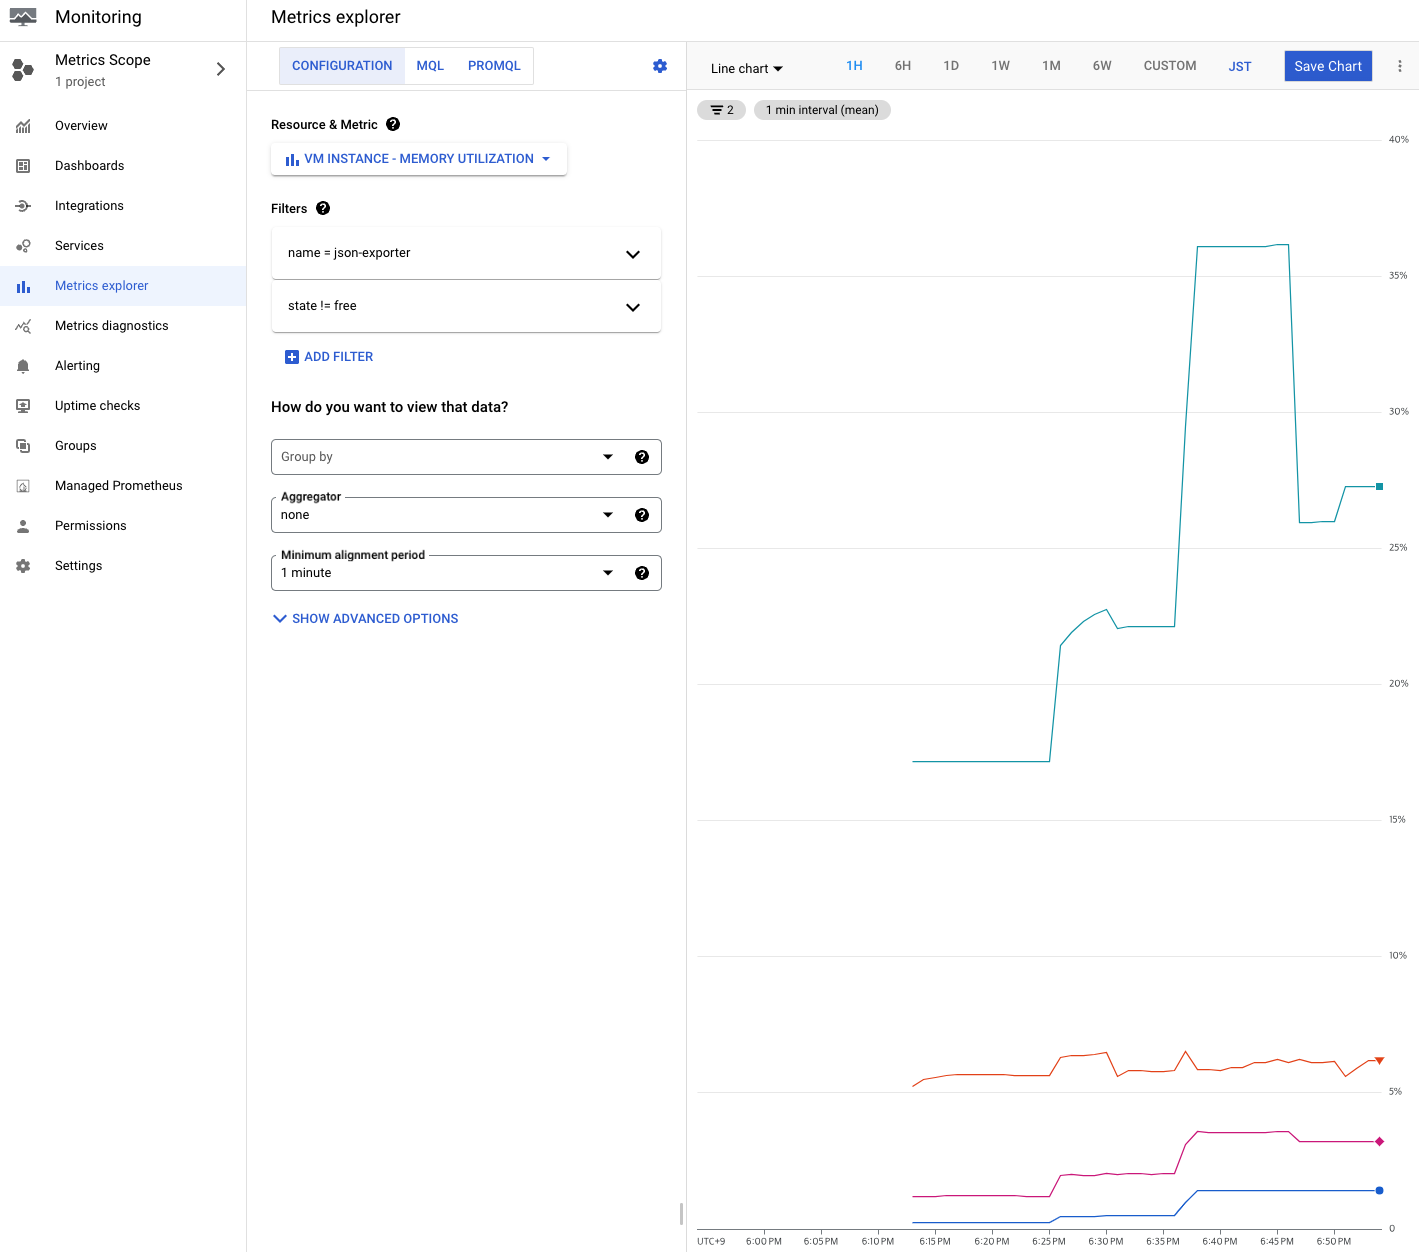
클라우드 모니터링에서 prometheus 메트릭을 확인해봅니다.
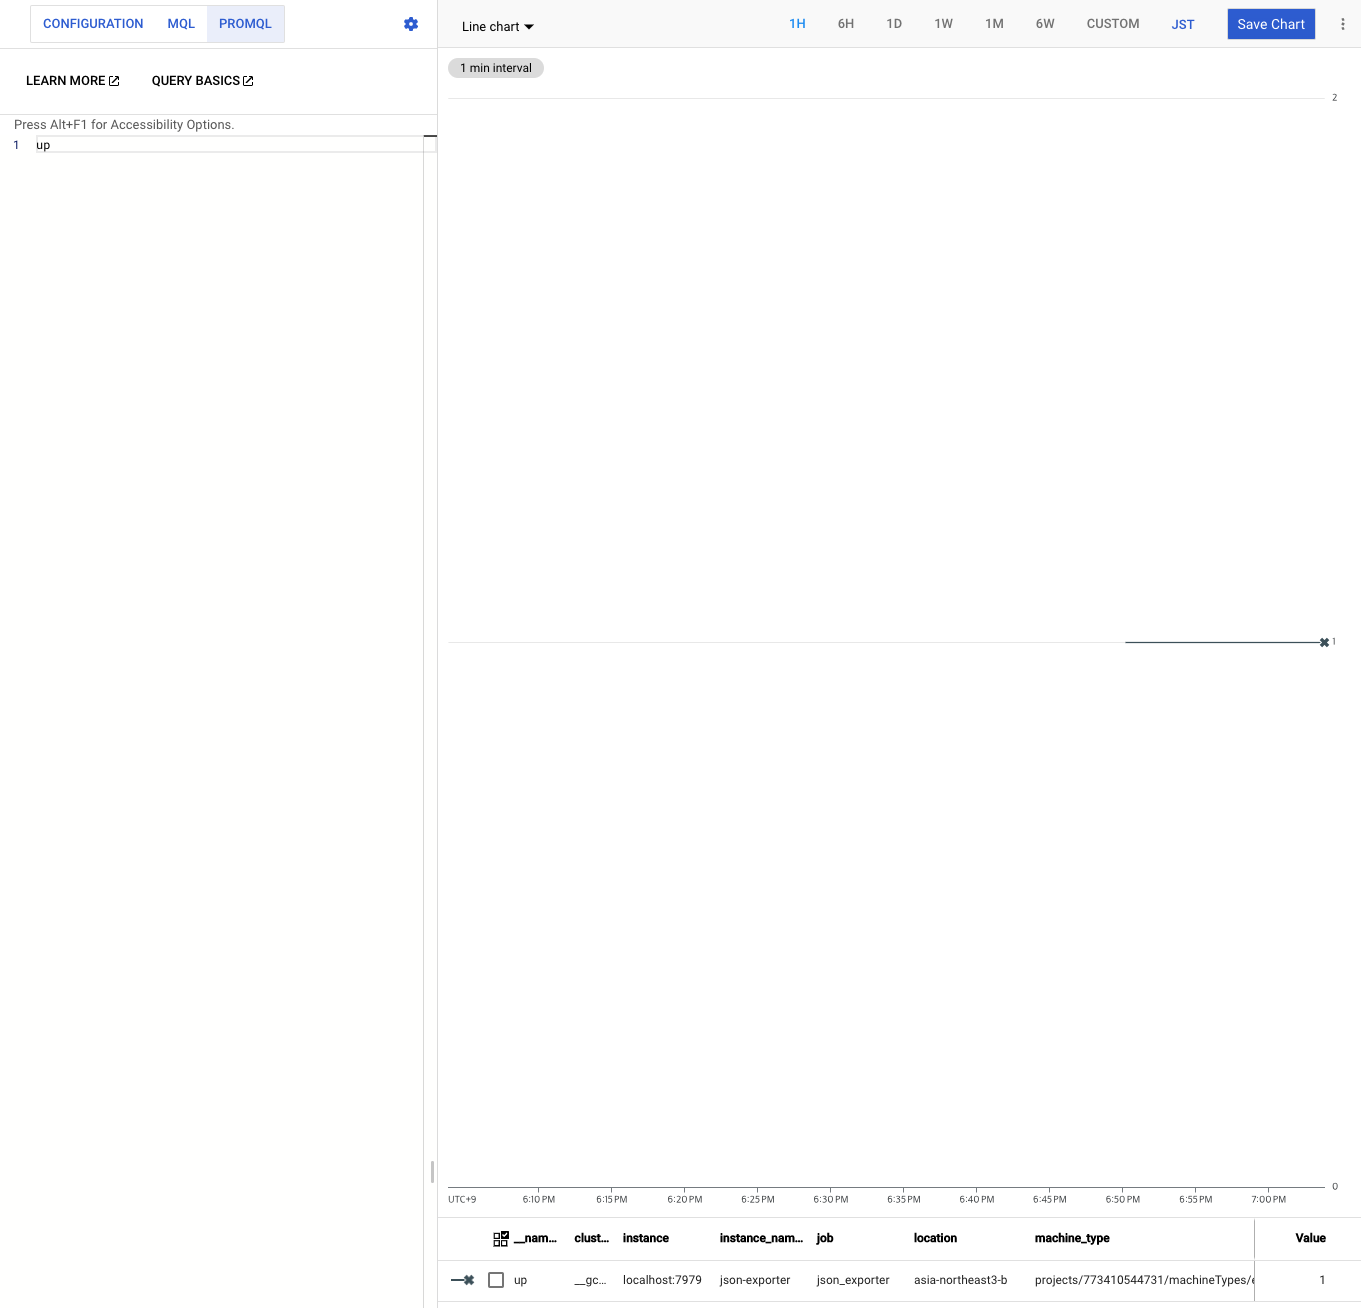
수집하고 있는걸 확인할 수 있습니다.
custom exporter 설정
4000포트의 /metrics에서 prometheus metric을 노출하고 있는 app을 배포합니다.
Prerequisites
#docker install
sudo apt-get install     ca-certificates     curl     gnupg     lsb-release
sudo mkdir -m 0755 -p /etc/apt/keyrings
curl -fsSL https://download.docker.com/linux/debian/gpg | sudo gpg --dearmor -o /etc/apt/keyrings/docker.gpg
echo   "deb [arch=$(dpkg --print-architecture) signed-by=/etc/apt/keyrings/docker.gpg] https://download.docker.com/linux/debian \
$(lsb_release -cs) stable" | sudo tee /etc/apt/sources.list.d/docker.list > /dev/null
sudo apt-get update
sudo apt-get install -y docker-ce docker-ce-cli containerd.io docker-buildx-plugin docker-compose-plugin
sudo docker run hello-world


#install kubectl
sudo apt-get install -y kubectl google-cloud-sdk-gke-gcloud-auth-plugin bash-completion
cat >> ~/.bashrc <<EOL
export USE_GKE_GCLOUD_AUTH_PLUGIN=True
export PROJECT_ID=prj-sandbox-devops-9999
source <(kubectl completion bash)
alias k=kubectl
complete -o default -F __start_kubectl k
EOL
source ~/.bashrc
sample app deploy
# deploy container
sudo docker run --name test -d -p 4000:4000 gcr.io/ops-demo-330920/flask_telemetry:61a2a7aabc7077ef474eb24f4b69faeab47deed9
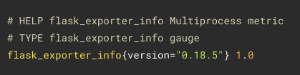
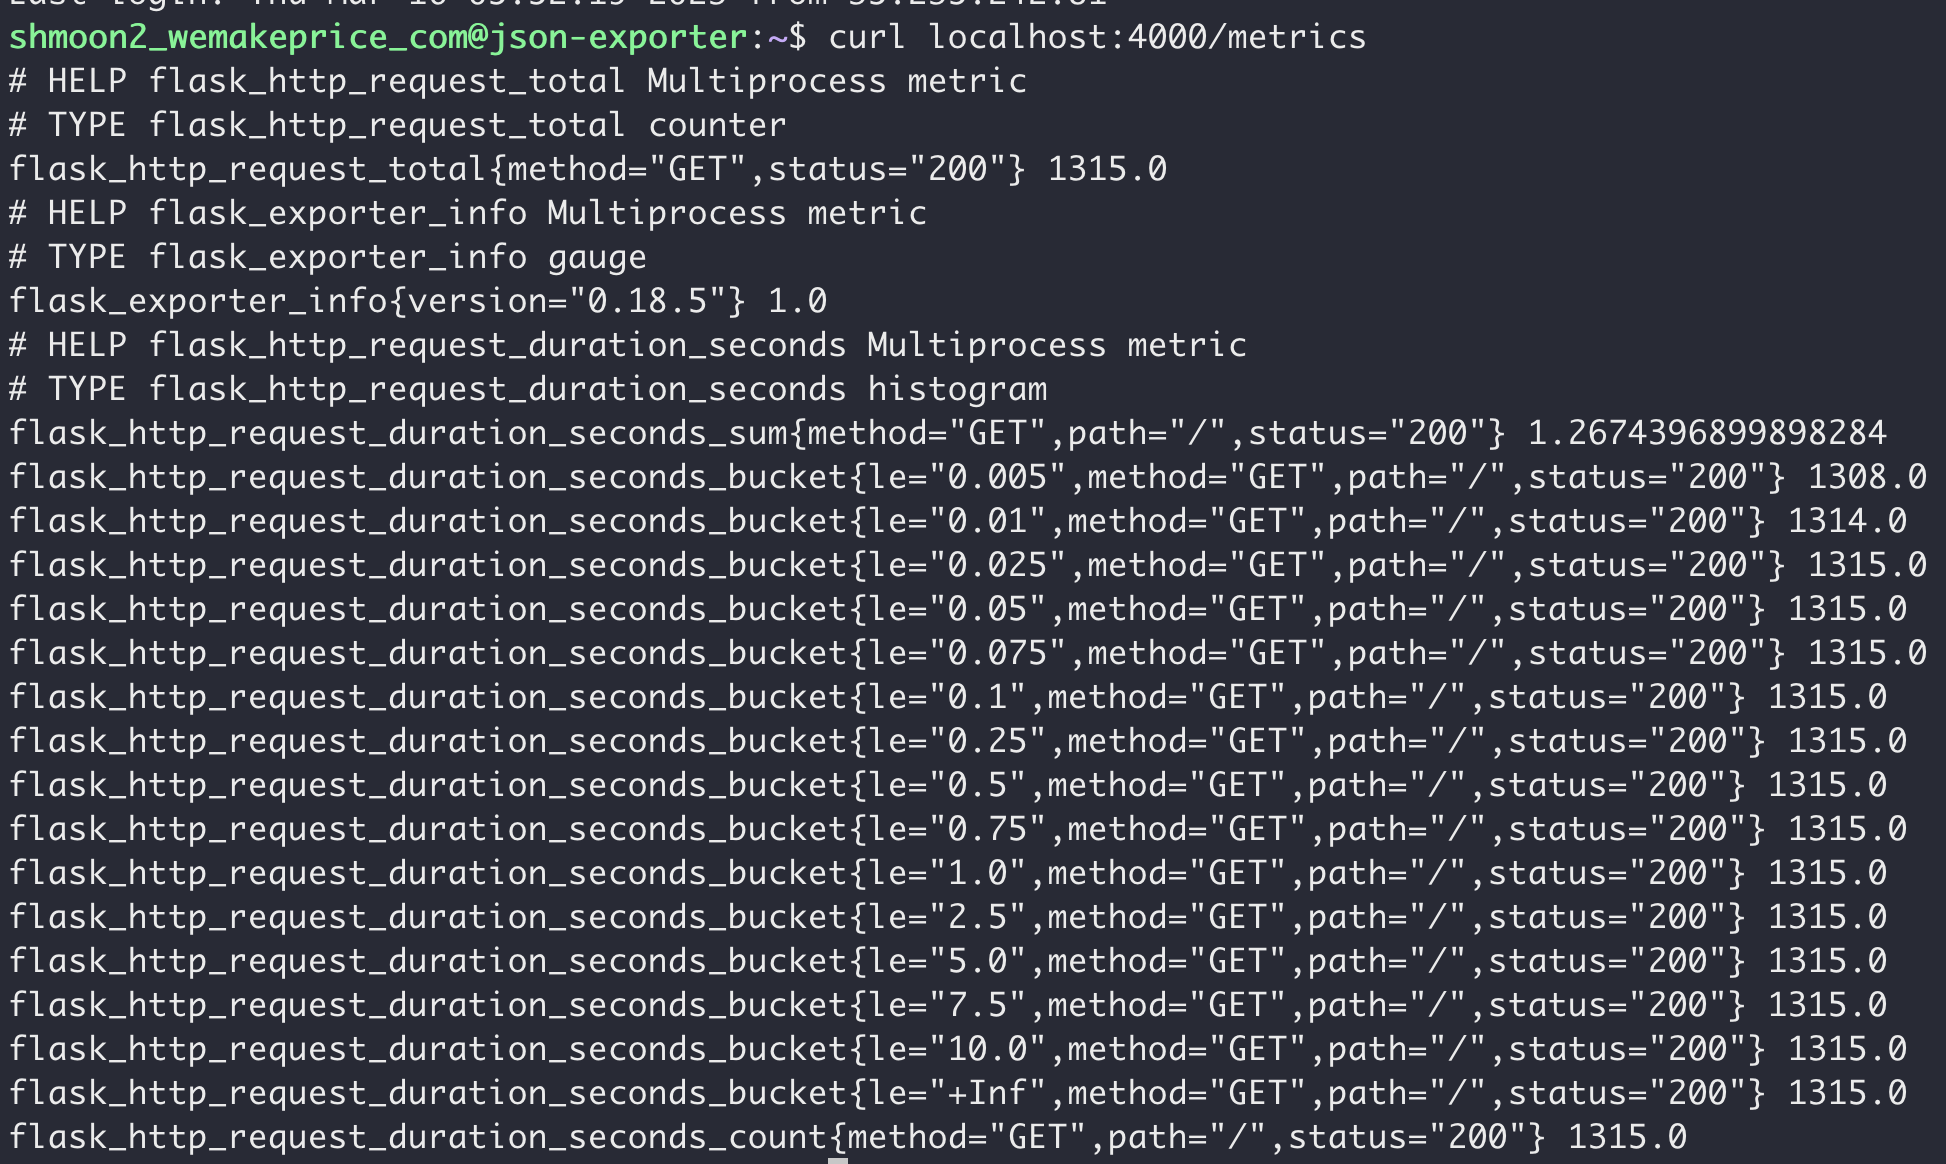
# server response test
curl localhost:4000아래와 같은 응답이 나오면 정상적으로 배포된것입니다.
Ops Agent 설정 파일에 scrape config entry를 추가해줍니다.
- job_name: 'flask_exporter'
  scrape_interval: 10s
  metrics_path: /metrics
  static_configs:
    - targets: ['localhost:4000']
config.yaml 내용
metrics:
  receivers:
    prometheus:
        type: prometheus
        config:
          scrape_configs:
            - job_name: 'json_exporter'
              scrape_interval: 10s
              metrics_path: /probe
              params:
                module: [default]
                target: [http://localhost:8000/examples/data.json]
              static_configs:
                - targets: ['localhost:7979']
            - job_name: 'flask_exporter'
              scrape_interval: 10s
              metrics_path: /metrics
              static_configs:
                - targets: ['localhost:4000']

  service:
    pipelines:
      prometheus_pipeline:
        receivers:
          - prometheus
Ops Agent를 재시작합니다.
sudo service google-cloud-ops-agent restartCloud Monitoring에 제대로 수집되고 있는지 확인합니다.
monitoring > metric explorer > resource type : prometheus target
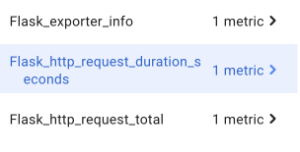
curl localhost:4000 에서 나오던 type 값과 일치하는 메트릭을 조회할 수 있습니다.
트래픽을 발생시킨 후 그래프를 조회합니다.
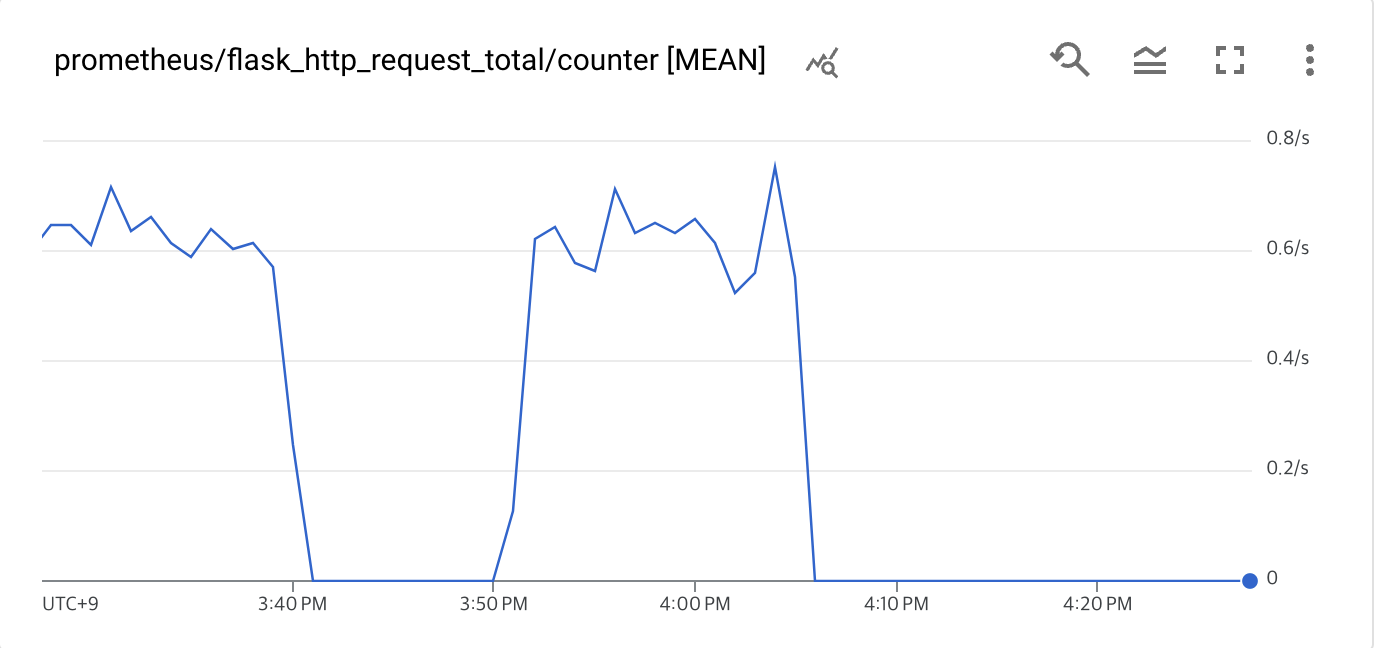
#트래픽 발생
timeout 120 bash -c -- 'while true; do curl localhost:4000; sleep $((RANDOM % 4)) ; done'#대시보드 생성
gcloud monitoring dashboards create --config='''
{
"category": "CUSTOM",
"displayName": "Prometheus Dashboard Example",
"mosaicLayout": {
  "columns": 12,
  "tiles": [
    {
      "height": 4,
      "widget": {
        "title": "prometheus/flask_http_request_total/counter [MEAN]",
        "xyChart": {
          "chartOptions": {
            "mode": "COLOR"
          },
          "dataSets": [
            {
              "minAlignmentPeriod": "60s",
              "plotType": "LINE",
              "targetAxis": "Y1",
              "timeSeriesQuery": {
                "apiSource": "DEFAULT_CLOUD",
                "timeSeriesFilter": {
                  "aggregation": {
                    "alignmentPeriod": "60s",
                    "crossSeriesReducer": "REDUCE_NONE",
                    "perSeriesAligner": "ALIGN_RATE"
                  },
                  "filter": "metric.type=\"prometheus.googleapis.com/flask_http_request_total/counter\" resource.type=\"prometheus_target\"",
                  "secondaryAggregation": {
                    "alignmentPeriod": "60s",
                    "crossSeriesReducer": "REDUCE_MEAN",
                    "groupByFields": [
                      "metric.label.\"status\""
                    ],
                    "perSeriesAligner": "ALIGN_MEAN"
                  }
                }
              }
            }
          ],
          "thresholds": [],
          "timeshiftDuration": "0s",
          "yAxis": {
            "label": "y1Axis",
            "scale": "LINEAR"
          }
        }
      },
      "width": 6,
      "xPos": 0,
      "yPos": 0
    }
  ]
}
}
'''
참고
https://cloud.google.com/monitoring/agent/ops-agent/prometheus#oagent-prom-receiver-config
https://prometheus.io/docs/prometheus/latest/configuration/configuration/#scrape_config
https://cloud.google.com/monitoring/promql/promql-in-monitoring
https://blog.searce.com/monitor-your-applications-on-google-managed-prometheus-4416070f9fd0