System Overview
Prometheus metrics를 위한 Google Cloud의 완전 관리형 멀티 클라우드 솔루션입니다. Prometheus를 사용하고, 대규모 Prometheus 관리 및 운영을 수동으로 수행할 필요 없이 워크로드를 모니터링하고 알림을 설정할 수 있습니다.
Prometheus exporters를 통해 metrics을 수집하고 PromQL을 사용해 데이터를 쿼리할 수 있습니다. 기존의 Grafana 대시보드, PromQL 기반 알림, 워크플로를 계속 사용할 수 있습니다. 또한 하이브리드 및 멀티 클라우드와 호환되고 Kubernetes 및 VM 워크로드를 모두 모니터링할 수 있으며 24개월 동안 데이터를 보존하고 업스트림 Prometheus와 호환됩니다. PromQL을 사용해 Cloud Monitoring에서 무료 GKE 시스템 측정항목을 비롯한 1,500개 이상의 무료 측정항목을 쿼리하여 Prometheus 모니터링을 보완할 수도 있습니다.
Managed Service for Prometheus는 Cloud Monitoring과 동일한 백엔드 및 API를 사용하므로 Cloud Monitoring 측정항목과 Managed Service for Prometheus에서 수집한 측정항목 모두 Cloud Monitoring, Grafana 또는 Prometheus API를 읽을 수 있는 기타 도구에서 PromQL을 사용하여 쿼리할 수 있습니다.
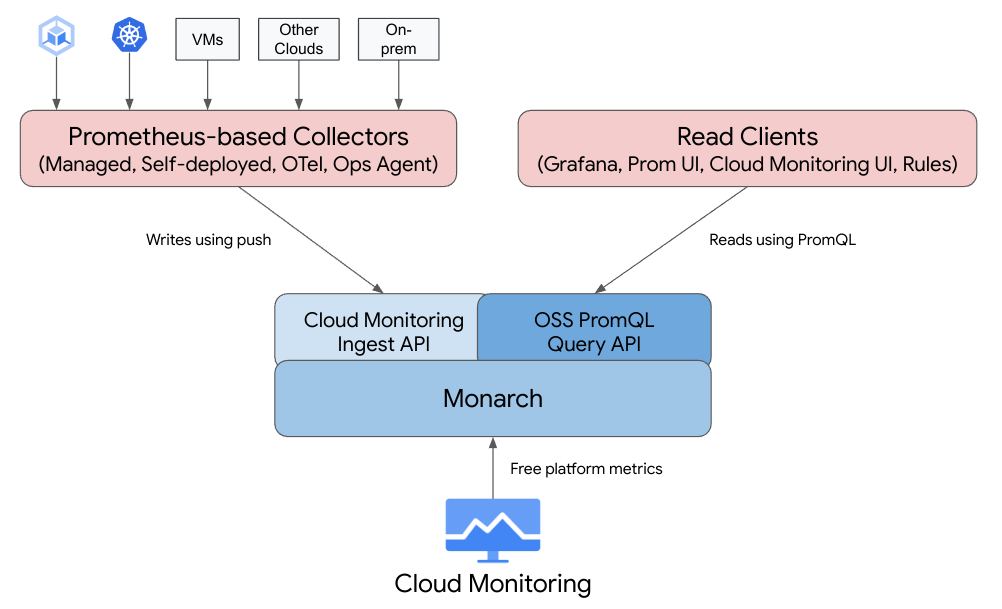
기존 Prometheus 에서는 데이터 수집, 쿼리 평가, 규칙 및 알림 평가, 데이터 스토리지 모두 단일 Prometheus 서버 내에서 처리됩니다.
이와 반대로 Managed Service for Prometheus는 여러 구성요소로 분할합니다.
Data collection은 3가지 종류의 collector에 의해 처리됩니다. collector는 local exporter에서 metric을 scrape 하고 수집된 데이터를 Monarch로 전달합니다. 이러한 collectors는 Kubernetes를 비롯해 기존 워크로드에 사용할 수 있으며 다른 클라우드와 온프렘 배포를 포함하여 어디서나 실행할 수 있습니다.
Query evaluation는 모든 Google Cloud 리전 및 최대 1,000개의 Google Cloud 프로젝트에서 결과 쿼리 및 통합을 실행하는 Monarch에서 처리합니다.
Rule and alert evaluation는 전역 Monarch 데이터 저장소에 대해 규칙 및 경고를 실행하고 발생된 경고를 Prometheus AlertManager로 전달하는 로컬 실행 및 로컬 구성 규칙 평가기 구성 요소에 의해 처리됩니다.
Data storage는 추가 비용 없이 24개월 동안 모든 Prometheus 데이터를 저장하는 Monarch에서 처리합니다.
Grafana는 Prometheus 서버에 연결하는 대신 global Monarch 데이터 스토어에 연결합니다. 모든 리소스에서 Managed Service for Prometheus collectors를 배포하고 사용중인 경우, 단일 Grafana 인스턴스에서 모든 클라우드에 대한 모든 측정항목을 통합해서 보여줍니다.
Data Collection
managed collectors, self-deployed collectors, or the Ops Agent 세가지로 수집할 수 있습니다.
managed data collection은 Prometheus 서버 배포, 확장, 샤딩, 구성, 유지보수의 복잡성을 줄여주므로 권장합니다. managed data collection은 GKE 및 비GKE Kubernetes 환경 모두에서 지원됩니다.
self-deployed data collection 은 기존 업스트림 Prometheus에서와 같이 설치를 관리합니다. 업스트림 Prometheus과의 유일한 차이점은 scrape 해온 데이터를 Managed Service for Prometheus 바이너리를 실행해 통해 GCP managed side로 전달하는 부분에 대한 설정이 필요합니다.
the Ops Agent를 GCE에 배포해 metric scrape, forward to Managed Service for Prometheus를 할 수 있습니다.
managed and self-deployed collection option 은 모두 온프렘과 다른 클라우드에서도 사용가능합니다.
managed collection
https://cloud.google.com/stackdriver/docs/managed-prometheus/setup-managed
관리형 컬렉션은 Prometheus 기반 collector를 Daemonset으로 실행하고 확장성을 보장합니다. pull 방식을 사용하는 경량의 collector는 Custom Resource를 사용해 배포되고 exporter를 scrape합니다. 그 후 collector는 GCP(data sotre Monarch)로 데이터를 push 합니다. Google Cloud는 클러스터에 직접 액세스하여 측정항목 데이터를 가져오거나 스크래핑하지 않습니다. 관리형 및 자체 배포 데이터 수집에 대한 자세한 내용은 Managed Service for Prometheus를 사용한 데이터 수집과 관리형 및 자체 배포 컬렉션을 사용한 수집 및 쿼리를 참조하세요.
설정은 GKE의 경우 --enable-managed-prometheus 를 설정해주고, non GKE의 경우 CRD 와 오퍼레이터를 설치합니다.
operator 설치
관리형 컬렉션을 사용 설정하면 클러스터 컴포넌트는 실행되지만 metric은 아직 생성되지 않습니다. PodMonitoring 리소스를 배포해야 metrics endpoint를 scrpae 합니다. 문제 해결 정보는 수집 측 문제를 참조하세요.
Configure a PodMonitoring resource
To ingest the metric data emitted by the example application, you use target scraping. Target scraping and metrics ingestion are configured using Kubernetes custom resources. The managed service uses PodMonitoring custom resources (CRs).
A PodMonitoring CR scrapes targets only in the namespace the CR is deployed in. To scrape targets in multiple namespaces, deploy the same PodMonitoring CR in each namespace. You can verify the PodMonitoring resource is installed in the intended namespace by running kubectl get podmonitoring -A.
For reference documentation about all the Managed Service for Prometheus CRs, see the prometheus-engine/doc/api reference.
The following manifest defines a PodMonitoring resource, prom-example, in the NAMESPACE_NAME namespace. The resource uses a Kubernetes label selector to find all pods in the namespace that have the label app with the value prom-example. The matching pods are scraped on a port named metrics, every 30 seconds, on the /metrics HTTP path.
애플리케이션이 내보내는 metric data를 수집하려면 target scraping을 사용합니다. 대상 스크래핑 및 측정항목 수집은 PodMonitoring(=Kubernetes 커스텀 리소스)을 사용하여 구성됩니다.
PodMonitoring CR은 CR이 배포된 네임스페이스에서만 대상을 스크래핑합니다. 여러 네임스페이스에서 대상을 스크래핑하려면 각 네임스페이스에 동일한 PodMonitoring CR을 배포합니다.