(1) RANSAC
RANSAC (RANdom SAmple Consensus) is a learning technique to estimate parameters of a model by random sampling of observed data.
The RANSAC Algorithm is as follows:
- Sample the number of points required to fit the model.
- Solve for model parameters using samples.
- Score by the fraction of inliers within a preset threshold of the model.
Repeat 1-3 until the best model is found with high confidence.
Let's set the number of points to sample to 2.
Select points randomly.
Then you can find model parameters and by substituting the sample points into the equation .
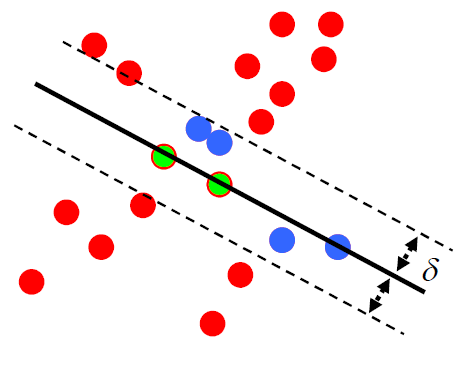
Use the preset threshold to obtain the fraction of inliers:
If the distance between the point and y=ax+b is less than the preset threshold value,
the point is considered as an inlier.
A model with a high percentage of inliers is considered as an optimal model.
How to choose the number of trials S?
How many times do we have to repeat this algorithm?
For the number of sampled points ,
outlier ratio ,
probability of having one or more outliers in a single subset of samples ,
S is as follows :
✔ Since inlier ratio is and the number of sampling is ,
the probability that the sample subset contains only inliers is .
👍 Good
- RANSAC is robust to outliers: not heavily influenced by outliers.
- RANSAC is applicable for larger number of objective function parameters than Hough transform.
- Optimization parameters are easier to choose than Hough transform.
👎 Bad
- Computational time grows quickly in proportion to fraction of outliers and the number of parapeters.
- RANSAC is not good for getting multiple fits.
(2) Hough Transform
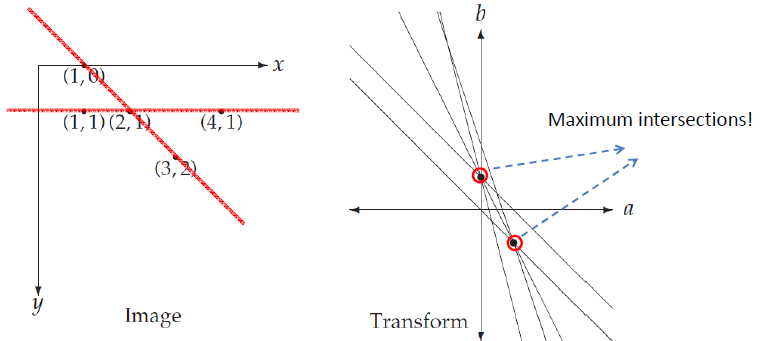
If is converted to an vector space of a and b, the equation is .
All straight lines that the point is included can be expressed as one straight line, , at the vector space for a and b.
Then what does the intersection of the two straight lines means in the vector space of a and b?
If the intersection of and is ,
the point and will be on the straight line .
This means that the more straight lines overlap at the intersection , the higher the possibility that a straight line exists in the image.
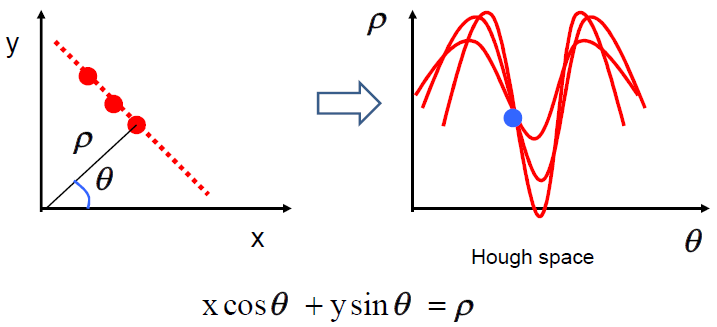
Hough Transform use a polar representation for the parameter space.
Hough space is nearly equal to a-b vector space described above,
but each parameter has a finite range :
and (d: the diagonal length of the bitmap)
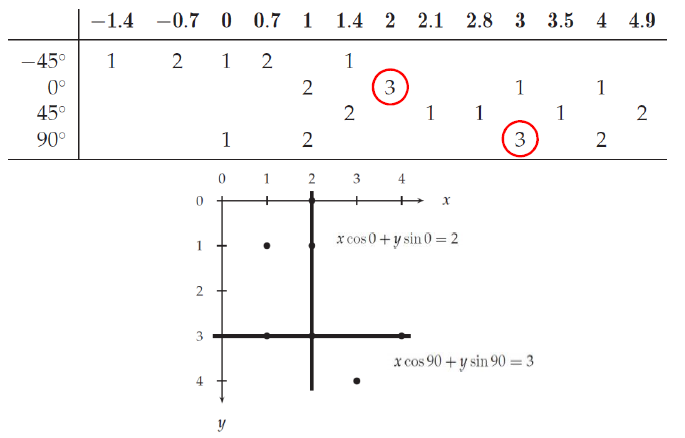
There are too many possible , we just use a few number of quantized . (ex) -45, 0, 45, 90
The accumulator array contains how many times each value of appears in the table.
The more values appear in , the higher the possibility that a straight line exists in the image.
The following is the example of table :
If there are spurious peaks due to uniform noise, user needs to adjust grid size larger or smooth the image.
The Hough Transform Algorithm is as follows :
- Create a grid of parameter values.
- Each point votes for a set of parameters, incrementing those values in grid.
- Find maximum or local maxima in grid.
👍 Good
- Robust to outliers: each point votes separately.
- Fairly efficient (much faster than trying all sets of parameters).
- Provides multiple good fits.
👎 Bad
- Some sensitivity to noise.
- Bin size trades off between noise tolerance, precision, and speed/memory.
: Can be hard to find sweet spot - Not suitable for more than a few parameters.
: grid size grows exponentially
