
Case2
함수
# fill_missing_values
def fill_missing_values(df):
    for col in df.columns:
        if df[col].dtype == float or df[col].dtype == int:
            mean = df[col].mean()
            df[col].fillna(mean, inplace=True)
        elif df[col].dtype == object:
            mode = df[col].mode().iloc[0]
            df[col].fillna(mode, inplace=True)
        else:
            continue

    return df

# chi2test
def chi2test(X, y, alpha=0.05):
    # X: DataFrame
    # y: series

    target = y.name
    test_df = []
    for index, col in X.select_dtypes(include=['object']).columns.to_series().items():
        df = pd.concat([y, X[col]], axis=1)
        contingency_table = df.value_counts().rename('counts').reset_index().pivot(index=target, columns=col, values='counts').fillna(0)
        stat, p, dof, expected = chi2_contingency(contingency_table.values)
        test_df.append([target, col, stat, p,
                      'Dependent (reject H0)' if p <= alpha else 'Independent (H0 holds true)','include' if p <= alpha else 'drop'])

    test_df = pd.DataFrame(test_df, columns=["variable1", "variable2", "chi2-stat", "p-value", "result", "recommendation"])
    return test_df

# t_test
def t_test(X, y, alpha=0.05):
    target = y.name
    print('t_test with alpha', alpha)
    test_df = []
    for index, col in X.select_dtypes(exclude=['object']).columns.to_series().items():
        df = pd.concat([y, X[col]], axis=1)
        ttest_df = df.set_index(target, drop=True).fillna(0)
        # Perform Welch's t-test
        stat, p = ttest_ind(ttest_df.loc["Yes"], ttest_df.loc["No"], equal_var=False)
        test_df.append([target, col, stat, p,
                     'Dependent (reject H0)' if p <= alpha else 'Independent (H0 holds true)', 'include' if p <= alpha else 'drop'])

    test_df = pd.DataFrame(test_df, columns=['variable1', 'variable2', 't-test', 'p-value', 'result', 'recommendation'])
    return test_df

################################################
# report
def report(y_test, pred):

    from sklearn.metrics import accuracy_score, precision_score, recall_score, f1_score

    # Accuracy
    accuracy = accuracy_score(y_test, pred)
    print("Accuracy:", accuracy)

    # Precision
    precision = precision_score(y_test, pred)
    print("Precision:", precision)

    # Recall
    recall = recall_score(y_test, pred)
    print("Recall:", recall)

    # F1 Score
    f1 = f1_score(y_test, pred)
    print("F1 Score:", f1)

    # Specificity (True Negative Rate)
    tn = ((y_test == 0) & (pred == 0)).sum()
    fp = ((y_test == 0) & (pred == 1)).sum()
    specificity = tn / (tn + fp)
    print("Specificity:", specificity)

# df_add
def df_add(model_name, y_test, pred):
	results_df = pd.DataFrame(columns=['Model', 'Accuracy', 'Precision', 'Recall', 'F1 Score', 'Specificity'])

    accuracy = accuracy_score(y_test, pred)
    precision = precision_score(y_test, pred)
    recall = recall_score(y_test, pred)
    f1 = f1_score(y_test, pred)
    tn = ((y_test == 0) & (pred == 0)).sum()
    fp = ((y_test == 0) & (pred == 1)).sum()
    specificity = tn / (tn + fp)

    results_df.loc[len(results_df)] = [model_name, accuracy, precision, recall, f1, specificity]
결측치 최빈값 및 평균으로 변경
train1= fill_missing_values(train1)

# null(None) 값이 들어있는 데이터 각 컬럼별로 집계
null_rows_selector = train1.isnull().any(axis=1)
null_row_count = train1[null_rows_selector].shape[0]

df_null = train1.isnull().groupby(train1.Churn).sum().transpose()
df_null['total'] = train1.isnull().sum()
df_null['percent'] = (df_null['total'] / len(train1)) * 100
df_null = df_null[df_null.total != 0]

print("rows with null values: ", null_row_count, ", {:.2f}%".format((null_row_count / len(train1) * 100)))
print('columns with null values: ', df_null.shape[0])

pd.concat([train1.Churn.value_counts(normalize=True).rename("Overall"), train1[null_rows_selector].Churn.value_counts(normalize=True).rename("within_null_rows")], axis=1)

contingency_table = pd.concat([train1.Churn.value_counts().rename("Overall"), train1[null_rows_selector].Churn.value_counts()
                               .rename("within_null_rows")], axis=1).transpose()

stat, p, dof, expected = chi2_contingency(contingency_table.values)

# p-value 확인
alpha = 0.05 # 유의값 수준
print("p value is " + str(p))

chi2test(train1.drop('Churn', axis=1), train1['Churn'])
t_test(train1.drop('Churn', axis=1), train1['Churn'])
include recommendation이 된 컬럼만 선정하여 train2 재 정의
train2 = train1[['ChildrenInHH', 'HandsetRefurbished','HandsetWebCapable', 'Homeownership', 'BuysViaMailOrder', 'RespondsToMailOffers', 'HandsetPrice', 'MadeCallToRetentionTeam',
                'CreditRating', 'PrizmCode', 'MaritalStatus', 'MonthlyRevenue', 'MonthlyMinutes', 'TotalRecurringCharge', 'DirectorAssistedCalls', 'OverageMinutes', 'RoamingCalls', 'PercChangeMinutes',
                'PercChangeRevenues', 'DroppedCalls', 'UnansweredCalls', 'CustomerCareCalls', 'ThreewayCalls', 'ReceivedCalls', 'OutboundCalls', 'InboundCalls', 'PeakCallsInOut', 'OffPeakCallsInOut',
                'DroppedBlockedCalls', 'CallWaitingCalls', 'MonthsInService', 'UniqueSubs', 'ActiveSubs', 'Handsets', 'HandsetModels', 'CurrentEquipmentDays', 'RetentionCalls', 'RetentionOffersAccepted',
                'ReferralsMadeBySubscriber', 'IncomeGroup', 'AdjustmentsToCreditRating', 'Age','Churn']]

train2.to_csv('train2.csv', index=False)

binary_cols = ['ChildrenInHH', 'HandsetRefurbished','HandsetWebCapable', 'BuysViaMailOrder',
               'RespondsToMailOffers', 'HandsetPrice', 'MadeCallToRetentionTeam','Churn']
for i in binary_cols :
    train2[i] = train2[i].replace({'Yes' : 1, 'No' : 0})

train2['Homeownership'] = train2['Homeownership'].replace({"Known" : 1, "Unknown" : 0})

train_cat = train2[['CreditRating', 'PrizmCode', 'MaritalStatus']]
from sklearn.preprocessing import LabelEncoder
le = LabelEncoder()
le_train_cat = train_cat.apply(le.fit_transform)

train2[['CreditRating', 'PrizmCode', 'MaritalStatus']] = le_train_cat[['CreditRating', 'PrizmCode', 'MaritalStatus']]

# Calculate the mean of HandsetPrice excluding the 'Unknown' values
mean_price = train2.loc[train2['HandsetPrice'] != 'Unknown', 'HandsetPrice'].astype(float).mean()

# Replace 'Unknown' values with the mean price
train2.loc[train2['HandsetPrice'] == 'Unknown', 'HandsetPrice'] = mean_price

cor = train2.corr()

abs_correlation_with_churn = cor['Churn'].abs().sort_values(ascending=False)

for column, correlation in abs_correlation_with_churn.items():
    if column != 'Churn':
        print(f"'{column}': {correlation}")

scaler = StandardScaler()
train2_ss = pd.DataFrame(scaler.fit_transform(train2), columns=train2.columns)
이상치 제거 IsolationForest
# n_estimators : 노드 수 (50 - 100사이의 숫자면 적당하다.)
# max_samples : 샘플링 수
# contamination : 이상치 비율
# max_features : 사용하고자 하는 독립변수 수 (1이면 전부 사용)
# random_state : seed를 일정하게 유지시켜줌(if None, the random number generator is the RandomState instance used by np.random)
# n_jobs : CPU 병렬처리 유뮤(1이면 안하는 것으로 디버깅에 유리. -1을 넣으면 multilple CPU를 사용하게 되어 메모리 사용량이 급격히 늘어날 수 있다.)

clf_ss = IsolationForest(n_estimators=100,
                      max_samples="auto",
                      contamination=0.01,
                      max_features=1,
                      bootstrap=False,
                      n_jobs=1,
                      random_state=None,
                      verbose=0)

# fit 함수를 이용하여, 데이터셋을 학습시킨다.
clf_ss.fit(train2_ss)

# predict 함수를 이용하여, outlier를 판별해 준다. 0과 1로 이루어진 Series형태의 데이터가 나온다.
y_pred_outliers = clf_ss.predict(train2_ss)

# 이상치의 개수를 Count하는 과정
collections.Counter(y_pred_outliers)

# 원래의 DataFrame에 붙히기. out행의 값이 -1인 것을 제거하면 이상치가 제거된 DataFrame을 얻을 수 있다.
train2_ss['out']=y_pred_outliers
outliers=train2_ss.loc[train2_ss['out']== -1]
outlier_index=list(outliers.index)

train_ss = train2_ss[train2_ss['out'] != -1]

train_ss['Churn'] = train2["Churn"]
oversampling
# Separate features (X) and target variable (y)
X = train_ss.drop('Churn', axis=1)
y = train_ss['Churn']

# Apply SMOTE to balance the target variable
smote = SMOTE(random_state=70)
X_resampled, y_resampled = smote.fit_resample(X, y)

# Create a new DataFrame with the balanced data
train_ss_ov = pd.concat([X_resampled, y_resampled], axis=1)
데이터 나누기
y = train_ss_ov['Churn']
X = train_ss_ov.drop(columns=['Churn'])
X_train, X_test, y_train, y_test = train_test_split(X, y, test_size=0.3, random_state=70)
evals = [(X_train, y_train)]
start_time = time.time()
lgbm = LGBMClassifier(n_estimators=400)
lgbm.fit(X_train, y_train, early_stopping_rounds=100, eval_set=evals)report(y_test, grid.best_estimator_.predict(X_test))
df_add('LGBMClassifier', y_test, lgbm.predict(X_test))
results_df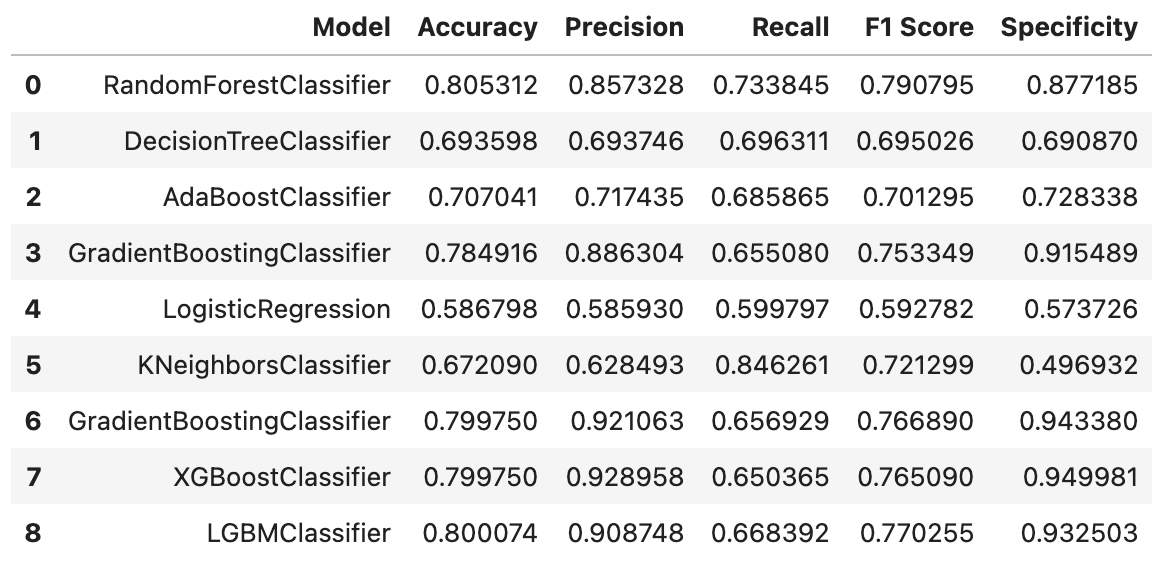

21세기 주인공