
1. 넘파이(numpy) 기초
NumPy
: the fundamental package for scientific computing with Python
: 행렬이나 다차원 배열 연산
- NumPy 임포트
import numpy as np
파이썬 리스트
- 리스트에 있는 값에 10 곱하기
data = [1,2,3,4]
result = []

for i in data: #반복
	result.append(i*10)

print(result)
ndarray
- 넘파이에서 제공하는 자료궂
import numpy as np

arr = np.array([1,2,3,4])
arr = arr*10

print(arr10)
ㄴ 반복문이 필요가 없다
2차원 데이터
- 리스트로 2차원 데이터를 표현하기
price = [
	[100,80,70,90], #첫 번째 행
    [120,110,100,110] # 두 번째 행
]

print(price[0])
ㄴ 데이터를 행 단위로 구성하는 경우 열 단위로 접근할 수가 없음
ndarray로 2차원 데이터 표현하기
price = [
	[100,80,70,90], #첫 번째 행
    [120,110,100,110] # 두 번째 행
]

arr = np.array(price)
넘파이 인덱싱
- 행단위로 인덱싱
arr2[0]
arr2[1]- 행->열 순서로 접근
arr2[0][0]
arr2[0,0]
넘파이 슬라이싱
- 행->열 순서로 접근
arr[:,0] # 행은 모든 것, 열은 0번 것
ex)
arr
arr[:,0]
arr[:,1]
output
array([[10, 20, 30, 40],
       [ 1,  2,  3,  4]])

array([10,  1])

array([20,  2])
2. 판다스 시리즈(Seires) 생성
파이썬 및 numpy 자료구조
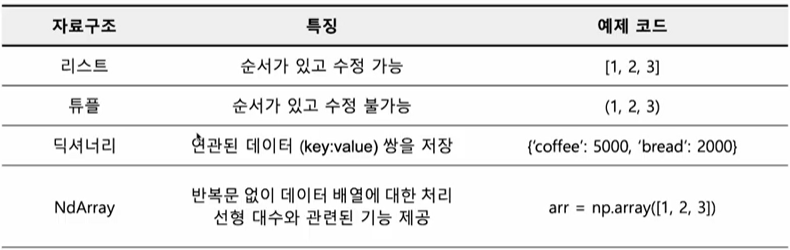
Series : numpy를 기반으로 만들어진 1차원 데이터를 위한 자료구조
DataFrame : numpy를 기반으로 만들어진 2차원 데이터를 위한 자료구조
- 임포트 방식
from pandas import Series, DataFrame
import pandas as pd
Seires 객체 생성
- 1차원 데이터를 위한 자료구조
ㄴ Raw 데이터를 파이썬 리스트로 표현
ㄴ Seires 클래스의 객체를 생성
from pandas import Series
s = Series(arr)
print(s)
(실습)
import pandas as pd

arr = [0,1,2,3]

type(arr)

s = pd.Series(arr)
s

type(s)
output
list

0    0
1    1
2    2
3    3

pandas.core.series.Series
Series 내부 구조
- 행 번호와 인덱스를 사용해서 데이터를 관리
ㄴ 자동으로 부여되는 행 번호
ㄴ 인덱스는 문자 혹은 숫자로 설정 가능
ㄴ 설정하지 않으면 0부터 시작하는 정수로 자동 할당 됨
data = [100,200,300]
s = Series(data)
print(s)
output
0	100
1	200
2 300- Series 생성 시 index를 지정할 수 있음
ㄴ 딕셔너리의 키(key)와 유사한 개념
data = [100,200,300]
index = ["월", "화", "수"]
s = Series(data, index)
print(s)
output
월 	100
화	200
수	300
Series 속성
-
Series 클래스의 속성
ㄴ index
: 시리즈 객체의 인덱스를 접근
s.index
ㄴ values
: 시리즈 객체의 값에 접근
s.values(실습)
data = [100,200,300]
index = ["월", "화", "수"]

s = pd.Series(data, index)
s
output
월    100
화    200
수    300
인덱스로 구하기
s.indexoutput
Index(['월', '화', '수'], dtype='object')값으로 구하기
s.valuesoutput
array([100, 200, 300])배열로도 값 불러오기 가능이다 !
s.arrayoutput
<PandasArray>
[100, 200, 300]
Length: 3, dtype: int64
연습 문제
index = ['메로나','누가바','빠삐코']
values = [500,800,200]

s = pd.Series(index,values)
s
output
500 메로나
800 누가바
200 빠삐코
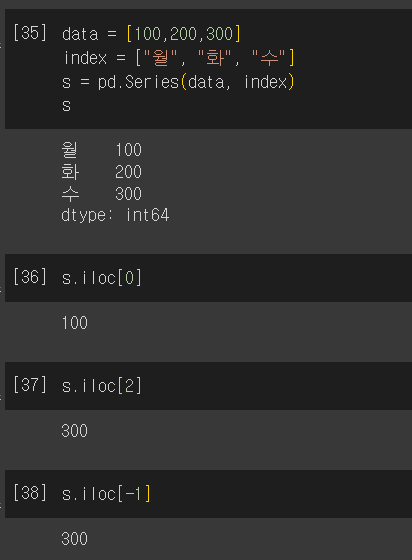
dtype: object3. 판다스 시리즈(Series) 인덱싱과 슬라이싱
Series 인덱싱
- iloc 속성(변수)을 사용하여 인덱싱
ㄴ 시리즈 객체의 행번호를 사용하여 인덱싱
data = [100,200,300]
index = ["월","화","수"]
s = Series(data, index)
print(s.iloc[0]) # 0번 행의 값을 가져옴
print(s.iloc[2]) # 2번 행의 값을 가져옴
(실습)
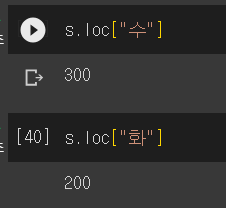
- loc 속성을 사용
ㄴ 시리즈 객체의 인덱스로 인덱싱
data = [100,200,300]
index = ["월","화","수"]
s = Series(data, index)
print(s.loc["월"])
print(s.loc["수"])
(실습)
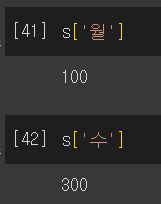
- 대괄호를 사용하여 인덱싱
data = [100,200,300]
index = ["월","화","수"]
s = Series(data, index)
print(s["월"])
(실습)
Series 슬라이싱
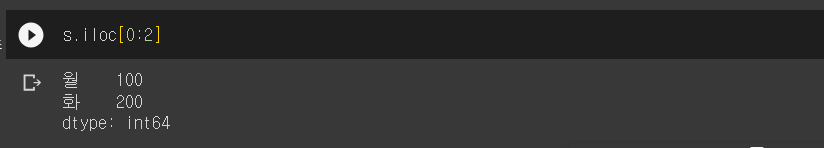
- 행번호를 사용하여 슬라이싱
ㄴ iloc[시작 행번호:끝 행번호]
data = [100,200,300]
index = ["월","화","수"]
s = Series(data, index)
print(s.iloc[0:2])
output
월	100
화	200
(실습)
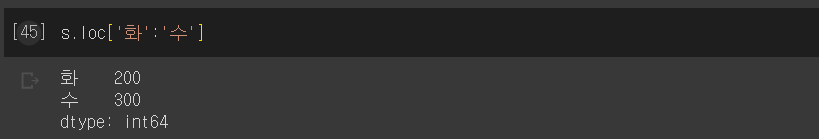
- 인덱스를 기반으로 슬라이싱
ㄴ loc[시작 인덱스: 끝 인덱스]
ㄴ 끝 인덱스를 포함함
data = [100,200,300]
index = ["월","화","수"]
s = Series(data, index)
print(s.loc["월":"화"])
output
월	100
화	200
(실습)
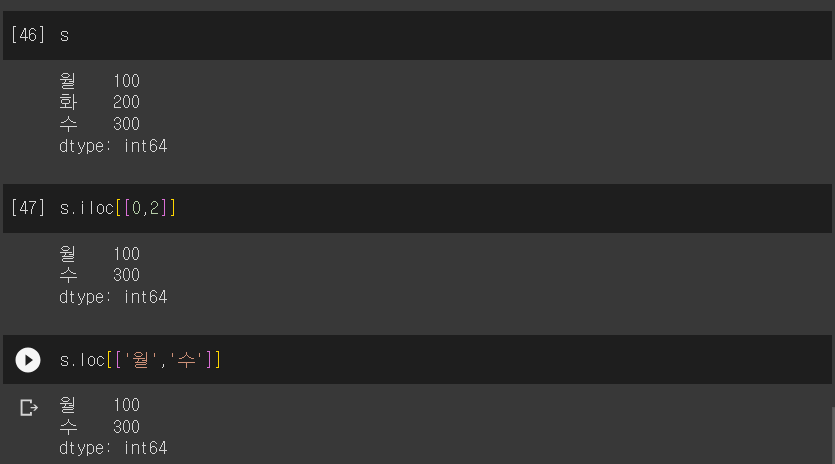
여러 값 인덱싱
- 연속적이지 않은 여러 개의 값을 한 번에 인덱싱
ㄴ 행 번호 또는 인덱스를 파이썬 리스트로 구성함
ㄴ loc 또는 iloc 속성에서 해당 리스트를 사용
data = [100,200,300]
index = ['월','화','수']
s = Series(data, index)
target = [0,2]
print(s.iloc[target]) # = s.iloc[[0,2]]
output
월	100
수	300
data = [100,200,300]
index = ['월','화','수']
s = Series(data, index)
target = ['월','수']
print(s.loc[target]) # = s.loc[['월','수']]output
월	100
수	300
(실습)
4. 판다스 시리즈 추가/삭제/수정
Series에 값 추가
- 딕셔너리와 유사한 방식으로 값 추가 가능
ㄴ s.loc[index] = 값
import pandas as pd
import numpy as np

data = [100,200,300]
index = ["월",'화','수']
s = pd.Series(data, index)

s.loc['목'] = 400
print(s)
output
월    100
화    200
수    300
목    400
dtype: int64
Series 삭제
- drop 메소드
ㄴ 원본은 유지하고 값이 삭제된 시리즈 객체를 리턴
ㄴ s.drop('index')
ㄴ s.drop(['인덱스1','인덱스2']) <- 여러개의 값 한 번에 삭제 가능
data = [100,200,300]
index = ["월",'화','수']
s = pd.Series(data, index)

s1 = s.drop("월")
print(s1)
print(s)
output
화    200
수    300
dtype: int64

월    100
화    200
수    300
dtype: int64
Series 수정
- Series의 행 번호나 인덱스를 사용하여 value를 수정 가능함
data = [100,200,300]
index = ["월",'화','수']
s = pd.Series(data, index)

s.iloc[0] = 1000 # 행 번호를 사용해서 수정
s.loc['수'] = 3000 # index를 사용해서 수정
print(s)
output
월    1000
화     200
수    3000
dtype: int64
(실습)
data = [100,200,300]
index = ["월",'화','수']
s = pd.Series(data, index)

s.iloc[0] = 1000 # 행 번호를 사용해서 수정
s.loc['수'] = 3000 # index를 사용해서 수정
print(s)
output
월    1000
화     200
수    3000
dtype: int64
삭제하기
s.drop('수', inplace = True)
s
output
월    1000
화     200
dtype: int64
추가하기
s['수'] = 3000
s
output
월    1000
화     200
수    3000
dtype: int64
수정하기
s.iloc[2] = 400
s
output
월    1000
화     200
수     400
dtype: int64
5. 판다스 시리즈(Series) 연산
브로드 캐스팅
- 연산이 시리즈 객체의 전체 값에 적용됨
ㄴ 반복문을 사용하지 않는다 !
from pandas import Series

s = Series([100,200,300])
print(s+10)
output
0    110
1    210
2    310
사칙연산
- 값은 인덱스를 기준으로 사칙 연산이 적용됨
ㄴ 반복문을 사용하지 않아도 됨
high = Series([51500,51200,52500,51500,51500])
low = Series([50700,50500,50500,50800,50700])

diff = high-low
print(diff)
output
0     800
1     700
2    2000
3     700
4 800- 인덱스가 같은 데이터 간의 덧셈 연산 적용
ㄴ 순서와 상관없이 인덱스를 기준으로 계산
high = Series([51500,51200,52500], index = ['5/1','5/2','5/3'])
low = Series([50700,50500,50500], index = ['5/1','5/2','5/4'])

diff = high-low
print(diff)
output
5/1    800.0
5/2    700.0
5/3      NaN
5/4      NaN
근데 5/3은 뺄게 없으니까 그냥 자기 자신이 나와야하는게 아닌가..? 왜 NaN이 나오는걸까.. 궁금하다.. 스터디시간에 물어바야징
시리즈 비교 연산
- 비교 연산자의 결과로 불린 타입이 저장된 시리즈가 리턴됨
s = Series(data = [100,200,300,400,500])
cond = s>300
print(cond)
output
0    False
1    False
2    False
3     True
4     True
dtype: bool
시리즈 필터링
- True/False 값을 통해서 True만 필터링 가능
s = Series(data = [100,200,300,400,500])
cond = [False,False,False,True,True]
s[cond]
output
# 값이 True인 애들만 필터링 돼서 나옴
3    400
4 500- 시가가 300원 이상인 날의 종가를 출력
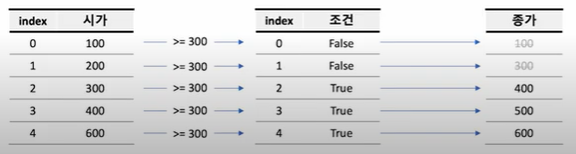
siga = Series([100,200,300,400,500])
jongga = Series([100,300,400,500,600])
print(jongga[siga >=300])
output
2    400
3    500
4    600
dtype: int64
연습 문제
1) 고가와 저가의 차이가 100이상인 날의 고가를 출력하세요
low = Series([10,200,200,400,600])
high = Series([100,300,400,500,600])
print(high[high-low>=100])
output
1    300
2    400
3    500
dtype: int64
2) 종가가 80000원 이상 90000원 미만인 날짜를 출력하라
data = [93000,82400,99100,81000,72300]
date = ['05/14','05/15','05/16','05/17','05/18']
jong = pd.Series(data = data, index = date)

a = (jong >= 80000) & (jong < 90000)
jong[a].index
output
Index(['05/15', '05/17'], dtype='object')6. 판다스 데이터프레임(DataFrame) 생성
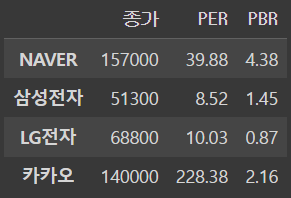
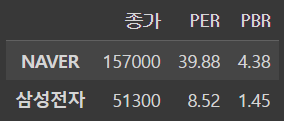
1) 2차원 표에서 컬럼 단위로 데이터를 표현
ㄴ 컬럼명을 딕셔너리의 key로 데이터는 딕셔너리의 values로 사용
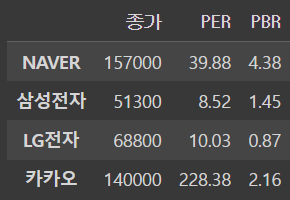
from pandas import DataFrame

data = {
    '종가' : [157000,51300,68800,140000],
    'PER' : [39.88,8.52,10.03,228.38],
    'PBR' : [4.38,1.45,0.87,2.16]
}

index = ['NAVER','삼성전자','LG전자','카카오']

df = DataFrame(data, index)
print(df)
output
           종가     PER   PBR
NAVER  157000   39.88  4.38
삼성전자    51300    8.52  1.45
LG전자    68800   10.03  0.87
카카오    140000  228.38  2.16
2) 2차원 표에서 로우 단위로 데이터를 리스트로 표현
ㄴ data, index, columns를 각각 리스트로 표현
from pandas import DataFrame

data = [[157000,51300,68800],
        [39.88,8.52,10.03],
        [4.38,1.45,0.87],
        [1,2,3]
]

index = ['NAVER','삼성전자','LG전자','카카오']
columns = ['종가','PER','PBR']
df = DataFrame(data = data, index = index, columns = columns)
print(df)
output
              종가       PER       PBR
NAVER  157000.00  51300.00  68800.00
삼성전자       39.88      8.52     10.03
LG전자        4.38      1.45      0.87
카카오         1.00      2.00      3.00
3) 2차원 표에서 로우 단위로 데이터를 딕셔너리로 표현
from pandas import DataFrame

data = [
    {'종가' : 157000, "PER" : 39.88, 'PBR' : 4.38},
    {'종가' : 51300, "PER" : 8.52, 'PBR' : 1.45},
    {'종가' : 68800, "PER" : 10.03, 'PBR' : 0.87},
    {'종가' : 140000, "PER" : 228.38, 'PBR' : 2.16},
]

index = ['NAVER','삼성전자','LG전자','카카오']
df = DataFrame(data = data, index = index)
print(df)
output
           종가     PER   PBR
NAVER  157000   39.88  4.38
삼성전자    51300    8.52  1.45
LG전자    68800   10.03  0.87
카카오    140000  228.38  2.16
(실습)
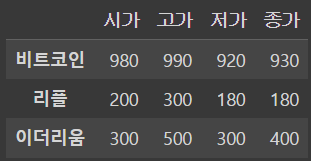
1번
data = {
    '시가':[980,200,300],
    '고가':[990,300,500],
    '저가':[920,180,300],
    '종가':[930,180,400]
}

index = ['비트코인','리플','이더리움']

df = pd.DataFrame(data = data, index = index)
df
output
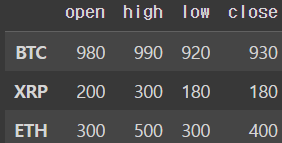
2번
data = [
    [980,990,920,930],
    [200,300,180,180],
    [300,500,300,400],
]

index = ['BTC','XRP','ETH']
columns = ['open','high','low','close']
df = pd.DataFrame(data = data, index = index, columns = columns)
df
output
3번
data = []
data.append([980,990,920,930])
data.append([200,300,180,180])
data.append([300,500,300,400])
data
output
[[980, 990, 920, 930], [200, 300, 180, 180], [300, 500, 300, 400]]7. 판다스 데이터프레임(DataFrame) 인덱싱과 슬라이싱
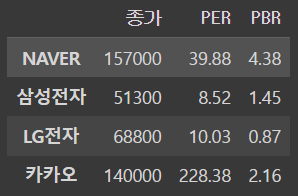
데이터프레임
- 2차원 데이터를 효과적으로 표현한 판다스 자료구조
from pandas import DataFrame

data = [ # 2차원 리스트로 표현
    [157000,39.88,4.38],
    [51300,8.52,1.45],
    [68800,10.03,0.87],
    [140000,228.38,2.16]
]

index = ['NAVER','삼성전자','LG전자','카카오']
columns = ['종가','PER','PBR']
df = DataFrame(data = data, index = index, columns = columns)
df
output
ㄴ 외부적으로 보이진 않지만 행번호와, 열번호가 있다 !
컬럼 선택
- 대괄호['컬럼명']을 통해서 단일 컬럼 선택 가능
ㄴdf['종가']
ㄴ 컬럼을 표현하는 시리즈 타입의 객체
ㄴ index는 회사 이름
ㄴ value는 종가
df['종가']output
NAVER    157000
삼성전자      51300
LG전자      68800
카카오      140000
Name: 종가, dtype: int64
멀티 컬럼 선택
- 컬럼을 리스트로 구성한 후 인덱싱 기호에 리스트를 저장
ㄴdf[['컬럼명1','컬럼명2']]
df[['PER','PBR']]output
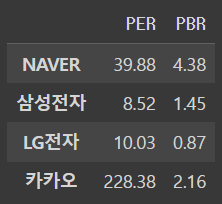
ㄴ 튜플로 넘겨주면 안되고 꼭 대괄호로 해야함 ~~
로우 선택
- 데이터프레인에서
row를 선택할 때는iloc나loc속성을 사용
loc: 인덱스를 사용해서 row를 선택 ex)df.loc['NAVER']
iloc: 행번호를 사용해서 로우를 선택 ex)df.iloc[0]
이 데이터프레임에서
iloc로 가져오기
df.iloc[1]output
종가     51300.00
PER        8.52
PBR        1.45
Name: 삼성전자, dtype: float64
loc로 가져오기
df.loc['삼성전자']output
종가 51300.00
PER 8.52
PBR 1.45
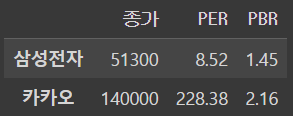
Name: 삼성전자, dtype: float64멀티 로우 선택
- 리스트로 행번호 또는 인덱스를 표현하고 이를 iloc나 loc 속성에 사용
ㄴdf.iloc[[0,1]]
ㄴdf.loc[['인덱스1','인덱스2']]
iloc로 불러오기
df.iloc[[0,1]]output
loc로 불러오기
df.loc[['삼성전자','카카오']]output
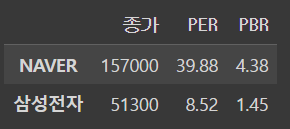
row 슬라이싱
iloc,loc속성을 사용하여 슬라이싱
이 데이터프레임에서
iloc로 슬라이싱
df.iloc[0:2]output
loc로 슬라이싱
df.loc['NAVER':'삼성전자']output
8. 판다스 데이터프레임(DataFrame) 값과 영역 접근
특정 값 가져오기
- 출력하는 방법
ㄴdf.iloc[행번호, 열번호]
ㄴdf.loc[인덱스, 컬렴명]
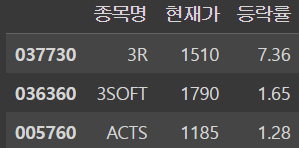
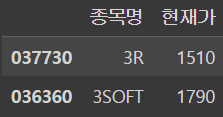
데이터프레임 준비
data = [
    ['3R',1510,7.36],
    ['3SOFT',1790,1.65],
    ['ACTS',1185,1.28]
]

index = ['037730','036360','005760']
columns = ['종목명','현재가','등락률']

df = DataFrame(data = data, index = index, columns = columns)
df
output
여기서 036360의 현재가를 알고싶을 때)
iloc로 불러오기
df.iloc[1,1]output
1790loc로 불러오기
df.loc['036360','현재가']output
1790영역 가져오기
- 데이터프레임에서 특정 영역 접근
ㄴdf.iloc[행번호 리스트, 열번호 리스트]
ㄴdf.loc[인덱스 리스트, 컬럼명 리스트]
데이터프레임!
iloc로 접근
df.iloc[[0,1],[0,1]]output
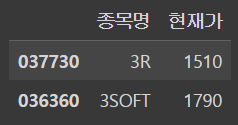
loc로 접근
df.loc[['037730','036360'],['종목명','현재가']]output
근데 !! 슬라이싱으로도 쌉가능하다
iloc 슬라이싱
df.iloc[0:2, 0:2]output
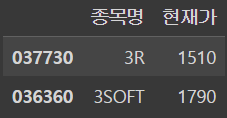
loc 슬라이싱
df.loc['037730':'036360','종목명':'현재가']output
9. 판다스 데이터프레임(DataFrame) 추가 삭제
컬럼 추가
df['컬럼명'] = 시리즈 객체
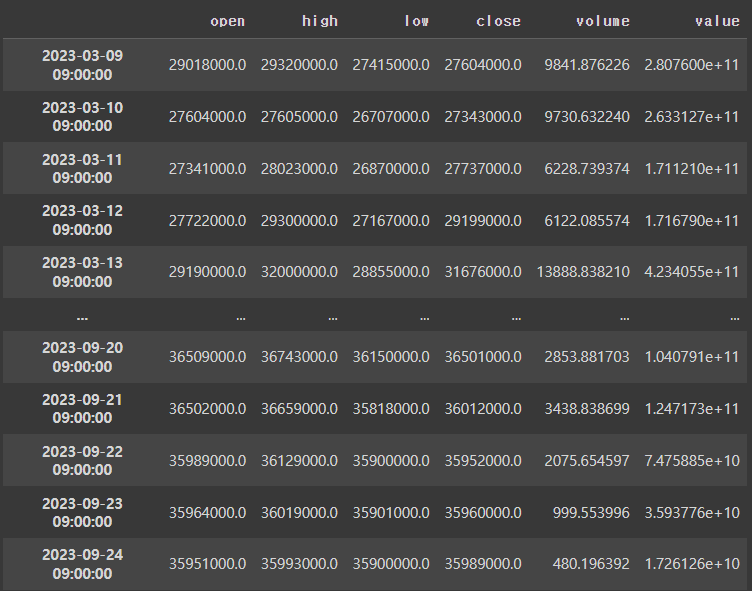
!pip install pyupbit
import pyupbit
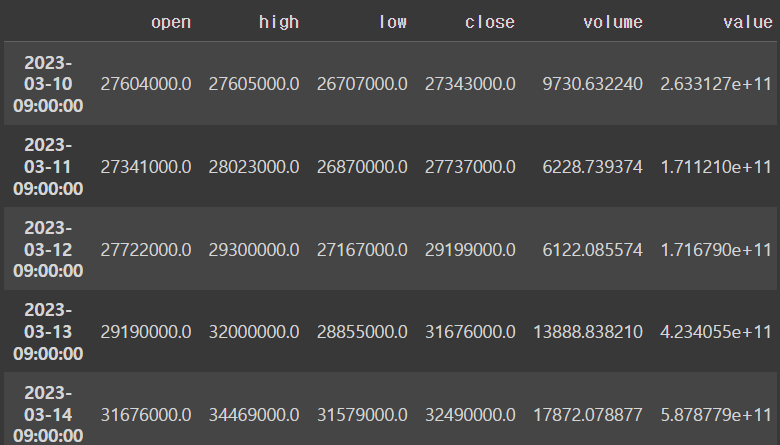
df = pyupbit.get_ohlcv("KRW-BTC")
dfoutput
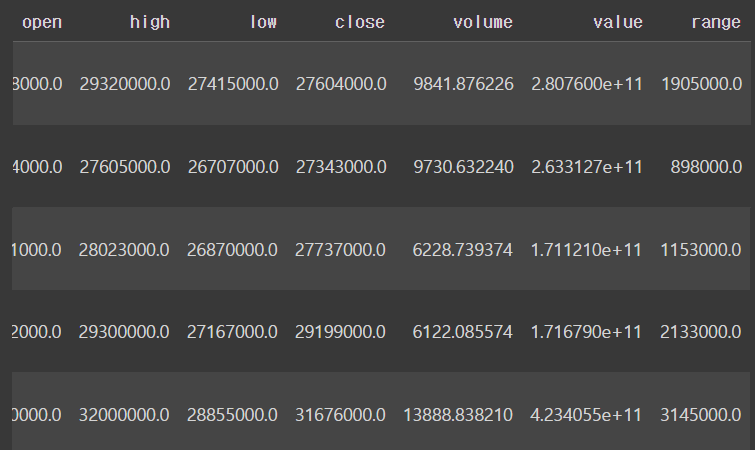
range열 추가
df['range'] = df['high'] - df['low'] # range라는 컬럼 생성 !!
df.head() # 맨 앞 다섯개의 행만 출력됨
output
컬럼 삭제
- df.drop('컬럼명', axis = 1)
ㄴ 원본은 그대로 유지되고 컬럼이 삭제된 새로운 데이터프레임 객체가 리턴됨
df = pyupbit.get_ohlcv("KRW-BTC")
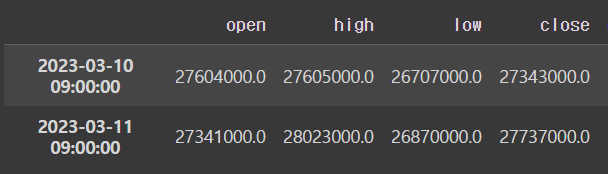
df2 = df.drop('volume',axis = 1)
df2output
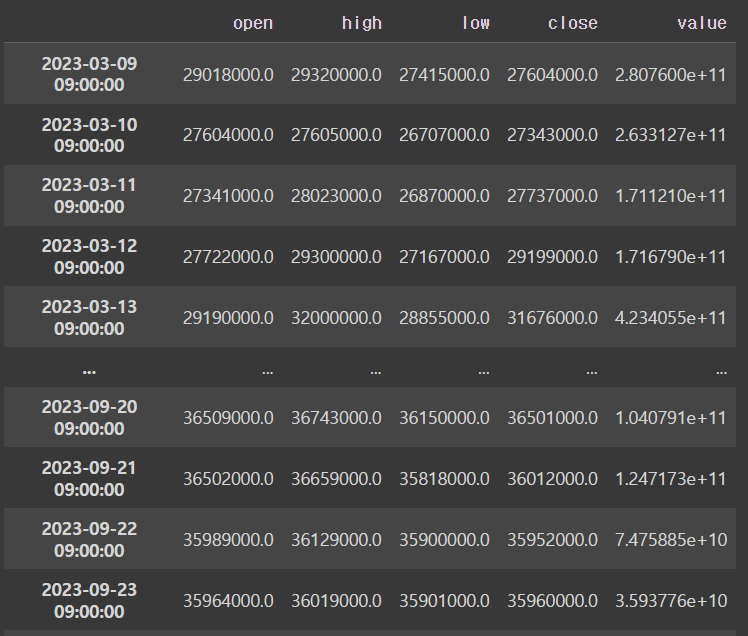
원본에서도 삭제되길 원한다면 df2 = df.drop('volume',axis = 1, inplace = True)로 바꿔야한다
시계열 데이터와 인덱스
- 시계열 데이터는 인덱스가 날짜와 시간으로 구성됨
ㄴ 문자열로 표현된 날짜와 시간을 DatetimeIndex 타입으로 변환해서 사용해야 함
리스트로 넘겨줄 때
import pandas as pd

date = ['2021-04-09']
index = pd.to_datetime(date)

print(type(date))
print(type(index))
output
<class 'list'>
<class 'pandas.core.indexes.datetimes.DatetimeIndex'>
그냥 string으로 넘겨줄 때
import pandas as pd

date = '2021-04-09'
index = pd.to_datetime(date)

print(type(date))
print(type(index))
output
<class 'str'>
<class 'pandas._libs.tslibs.timestamps.Timestamp'>
이거 뭔데.. 어렵냐 ??! 스터디시간에 함 물어바야지..
row 추가
- loc 속성을 사용
ㄴdf.loc[인덱스] = 데이터
row 삭제
df.drop(로우 인덱스, axis = 0)
ㄴ 원본은 그대로 유지되고 row가 삭제된 데이터프레임 객체가 리턴됨
index = df.index[-1]
df.drop(index, axis = 0, inplace = True)
10. 판다스 데이터프레임(DataFrame) 연산
브로드캐스팅
- 하나의 연산이 한 컬럼의 모든 데이터에 적용됨
데이터프레임 필터링
- 비교 연산자의 결과는 boolean값을 갖고있는 시리즈 객체임
import pandas as pd

import pyupbit
df = pyupbit.get_ohlcv("KRW-BTC")

df
output
df['open'] + 100output
2023-03-10 09:00:00    27604100.0
2023-03-11 09:00:00    27341100.0
2023-03-12 09:00:00    27722100.0
2023-03-13 09:00:00    29190100.0
2023-03-14 09:00:00    31676100.0
                          ...
2023-09-21 09:00:00    36502100.0
2023-09-22 09:00:00    35989100.0
2023-09-23 09:00:00    35964100.0
2023-09-24 09:00:00    35951100.0
2023-09-25 09:00:00    35530100.0
Name: open, Length: 200, dtype: float64
ex) 종가가 고가 보다 높았던 거래일만 필터링 해보기
cond = df['close']>df['open'] # 종가가 시가보다 높았을 때
cond
output
2023-03-10 09:00:00    False
2023-03-11 09:00:00     True
2023-03-12 09:00:00     True
2023-03-13 09:00:00     True
2023-03-14 09:00:00     True
                       ...
2023-09-21 09:00:00    False
2023-09-22 09:00:00    False
2023-09-23 09:00:00    False
2023-09-24 09:00:00    False
2023-09-25 09:00:00    False
Length: 200, dtype: bool
데이터프레임으로 만들기
cond = df['close'] > df['open'] # 종가가 시가보다 큰 애들만 모아서 데이터프레임
df[cond]
output
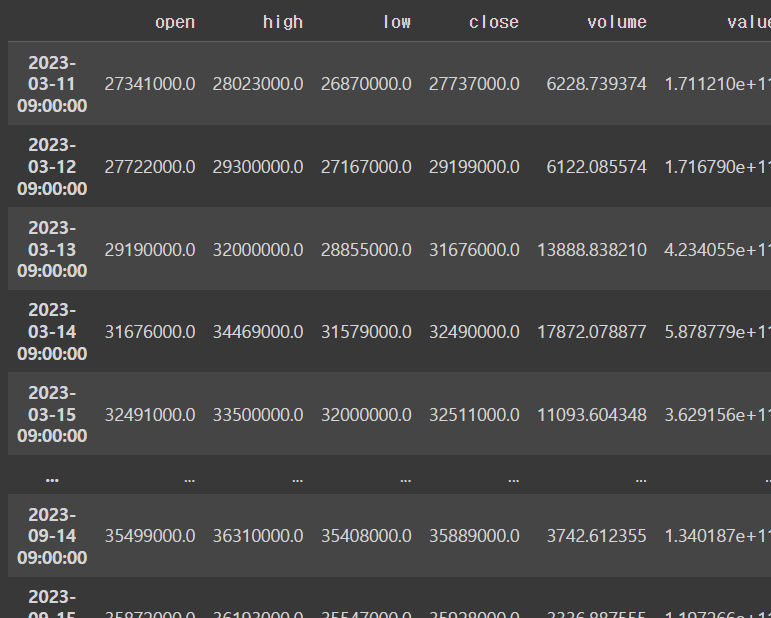
ㄴ 200개의 행이 99개의 행으로 줄어들었다 !
컬럼 시프트
- 데이터프레임의 연산은 기본적으로 같은 인덱스에 있는 컬럼과 컬럼 사이에 적용됨
df['high'] - df['low']
ex) 당일 저가와 전일 저가를 뺴려면 어떻게 해야할까?
df['컬럼명'].shift(1)
ㄴ 특정 컬럼의 데이터를 아래로 하나씩 이동
df['close_shift1'] = df['close'].shift(1)
df['close_shift1']
output
2023-03-10 09:00:00           NaN
2023-03-11 09:00:00    27343000.0
2023-03-12 09:00:00    27737000.0
2023-03-13 09:00:00    29199000.0
2023-03-14 09:00:00    31676000.0
                          ...
2023-09-21 09:00:00    36501000.0
2023-09-22 09:00:00    36012000.0
2023-09-23 09:00:00    35952000.0
2023-09-24 09:00:00    35960000.0
2023-09-25 09:00:00    35534000.0
ㄴ 레알 모르겠다.. 스터디시간에 물어봐야겠다
df['close'].shift(1)output
2023-03-10 09:00:00           NaN
2023-03-11 09:00:00    27343000.0
2023-03-12 09:00:00    27737000.0
...df.head(n=2)output
ㄴ 10꺼가 Nan이었는데 11꺼 값이 들어갔고 11은 12의 값이 들어갔다
df['close'].shift(-1)output
2023-03-10 09:00:00    27737000.0
2023-03-11 09:00:00    29199000.0
2023-03-12 09:00:00    31676000.0
ㄴ 12월꺼가 10에 가고 뭐냐 이거 ㄹㅇ 하.. 짜증
끝 !!