Intro
회사 모바일 운영 서비스에서 billboard.js 라이브러리를 활용하고 있었다. 차트를 수정해야 할 일이 생겨서 billboard.js 에 대해 공부하는 시간을 가지게 되었다.
billboard.js 란?
네이버의 오픈소스 javascript 이다.
billboard.js
사용법
Step 1. Load billboard.js and D3.js
<!-- Step 1) Load D3.js -->
<script src="https://d3js.org/d3.v6.min.js"></script>

<!-- Step 2) Load billboard.js with style -->
<script src="$YOUR_PATH/billboard.js"></script>

<!-- Load with base style -->
<link rel="stylesheet" href="$YOUR_PATH/billboard.css">

<!-- Or load different theme style -->
<link rel="stylesheet" href="$YOUR_PATH/theme/insight.css">
Step 2. Setup your chart holder
<div id="chart"></div>Step 3. Generate a chart with options
var chart = bb.generate({
bindto: "#chart",
data: {
type: "bar",
columns: [
["data1", 30, 200, 100, 170, 150, 250],
["data2", 130, 100, 140, 35, 110, 50]
]
}
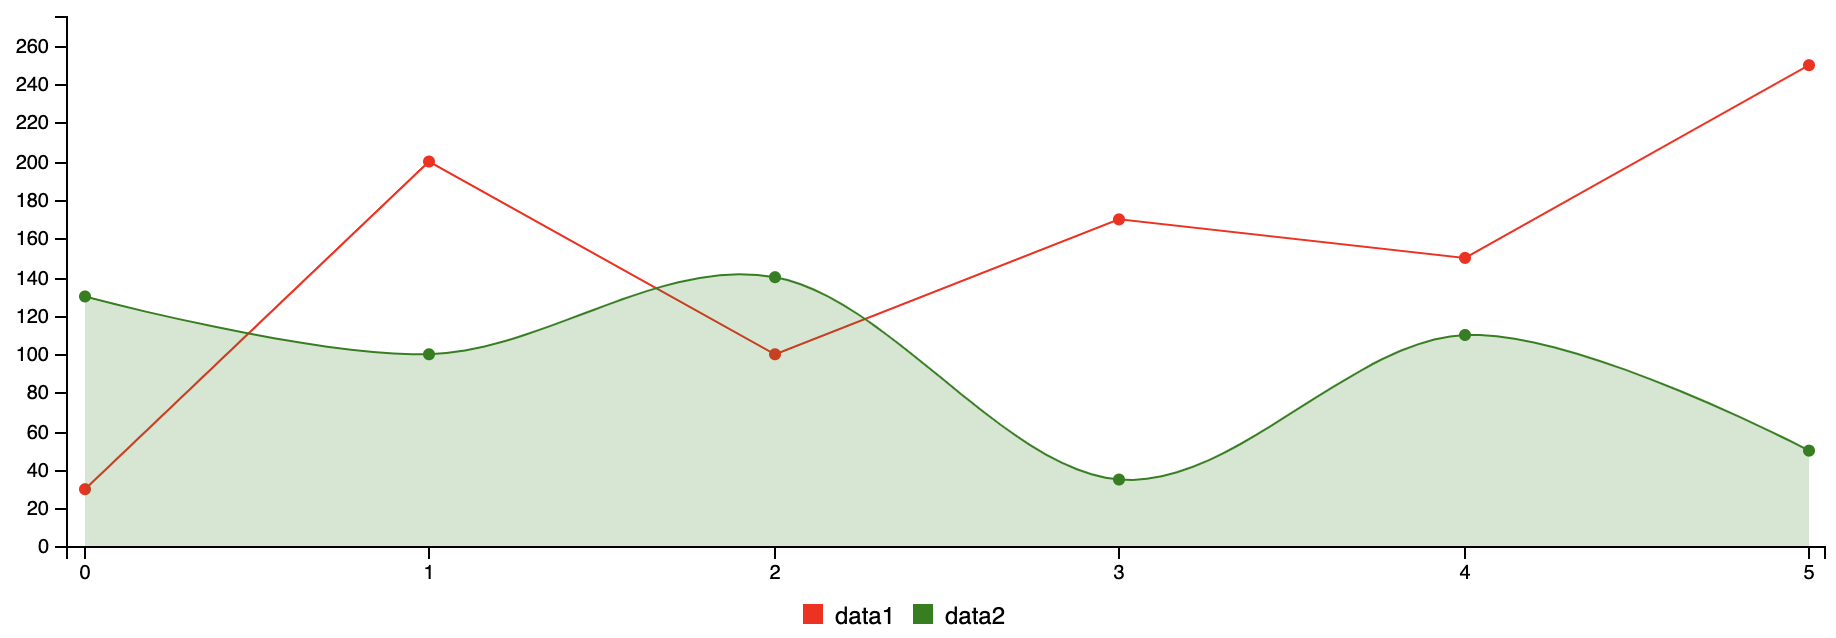
});예제
<div id="chart"></div>bb.generate({
bindto: "#chart",
data: {
columns: [
["data1", 30, 200, 100, 170, 150, 250],
["data2", 130, 100, 140, 35, 110, 50]
],
types: {
data1: "line",
data2: "area-spline"
},
colors: {
data1: "red",
data2: "green"
}
}
});
https://naver.github.io/billboard.js/
https://skyksit.com/programming/javascript/use-billboard-chart/

Step by step goes a long way ✨