교재 : 파이썬 머신러닝 완벽 가이드, 위키북스
평가
정확도
- 예측 성공한 데이터 / 전체 데이터
정밀도와 재현율
- 정밀도(precision) : 예측 및 실제 양성 / 예측 양성
- 재현율(recall) : 예측 및 실제 양성 / 실제 양성
- 재현율 = 민감도 = TPR(True Positive Rate)
오차 행렬
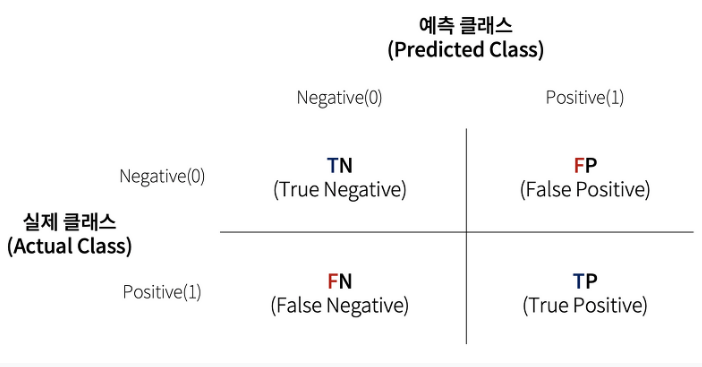
- 정확도 : TN + TP / All
- 정밀도 : TP / (FP + TP)
- 재현율 : TP / (FN + TP)
F1 스코어
- 정밀도와 재현율은 적절한 비율이 유지되어야 하고 한 쪽으로 치우치면 문제가 생김
- 둘 사이의 비율이 비슷할수록 F1 스코어가 높게 나타남

from sklearn.metrics import f1_score
def get_clf_eval(y_test, pred):
from sklearn.metrics import accuracy_score, precision_score, recall_score, confusion_matrix, f1_score
confusion = confusion_matrix(y_test,pred)
accuracy = accuracy_score(y_test,pred)
precision = precision_score(y_test,pred)
recall = recall_score(y_test,pred)
f1 = f1_score(y_test,pred)
print('오차행렬')
print(confusion)
print(f'정확도:{accuracy:.4f}, 정밀도:{precision:.4f}, 재현율{recall:.4f}, F1:{f1:.4f}')
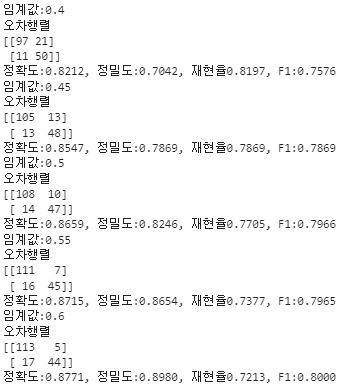
thresholds = [0.4,0.45,0.5,0.55,0.6]
def get_eval_by_threshold(y_test,pred_proba_1,thresholds):
for custom_threshold in thresholds:
custom_predict = Binarizer(threshold=custom_threshold).fit_transform(pred_proba_1)
print(f'임계값:{custom_threshold}')
get_clf_eval(y_test,custom_predict)
get_eval_by_threshold(y_test,pred_proba_1,thresholds)
- 결과값
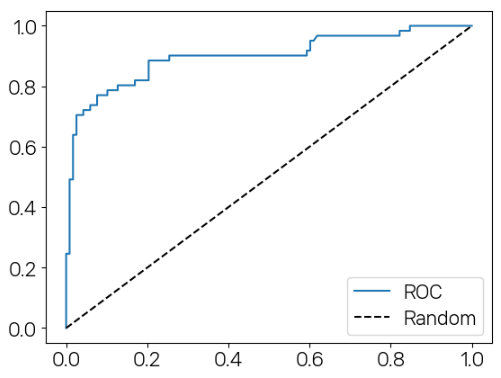
ROC 곡선과 AUC
- 곡선이 직선에 가까울 수록 성능이 떨어지며, 곡이 클 수록 성능이 뛰어남.
- FPR = FP/(FP+TN) = 1 - TNR = 1 - 특이성
from sklearn.metrics import roc_curve

def roc_curve_plot(y_test,pred_proba_1):
    from sklearn.metrics import roc_curve
    import matplotlib.pyplot as plt
    fprs, tprs, thresholds = roc_curve(y_test,pred_proba_1)
    plt.plot(fprs, tprs,label='ROC')
    plt.plot([0,1],[0,1],'k--',label='Random')
    plt.legend()
plt.show()- 출력 결과물

초보 개발자의 학습 저장용 블로그