0. 핵심개념
대용량의 트랜젝션(거래데이터)로부터 'X이면 Y이다'라는 형식의 연관관계를 발견하는 기법이다. 어떤 두 아이템 집합이 빈번이 발생하는가를 알려주는 일련의 규칙들을 생성하는 알고리즘이다. 흔히 장바구니 분석(Market Basket Analysis)이라고 한다. 소비자들의 구매이력 데이터를 바탕으로 'X아이템을 구매하는 고객들은 Y아이템 역시 구매할 가능성이 높다'고 행동을 예측 또는 추천하게 된다.
핵심키워드: 지지도(SUPPORT), 신뢰도(CONFIDENCE), 향상도(LIFT)
1. 분석 데이터 불러오기 및 확인
import warnings
warnings.filterwarnings("ignore")
import numpy as np
import pandas as pd

data = pd.read_csv('Market_Basket.csv', header = None)
data.head()


0	1	2	3	4	5	6	7	8	9	10	11	12	13	14	15	16	17	18	19
0	shrimp	almonds	avocado	vegetables mix	green grapes	whole weat flour	yams	cottage cheese	energy drink	tomato juice	low fat yogurt	green tea	honey	salad	mineral water	salmon	antioxydant juice	frozen smoothie	spinach	olive oil
1	burgers	meatballs	eggs	NaN	NaN	NaN	NaN	NaN	NaN	NaN	NaN	NaN	NaN	NaN	NaN	NaN	NaN	NaN	NaN	NaN
2	chutney	NaN	NaN	NaN	NaN	NaN	NaN	NaN	NaN	NaN	NaN	NaN	NaN	NaN	NaN	NaN	NaN	NaN	NaN	NaN
3	turkey	avocado	NaN	NaN	NaN	NaN	NaN	NaN	NaN	NaN	NaN	NaN	NaN	NaN	NaN	NaN	NaN	NaN	NaN	NaN
4	mineral water	milk	energy bar	whole wheat rice	green tea	NaN	NaN	NaN	NaN	NaN	NaN	NaN	NaN	NaN	NaN	NaN	NaN	NaN	NaN	NaN

transactions = []
for i in range(data.shape[0]):
    transactions.append([str(data[j][i])
                         for j in range(data.shape[1]-data.isnull().sum(axis=1)[i])])

transactions
2. apriori 모델 적용
# !pip install apyori

from apyori import apriori

rules = apriori(transactions, min_support = 0.015, min_confidence = 0.2,
                min_lift = 1, min_length = 1)

results = list(rules)
results

[RelationRecord(items=frozenset({'mineral water'}), support=0.23836821757099053, ordered_statistics=[OrderedStatistic(items_base=frozenset(), items_add=frozenset({'mineral water'}), confidence=0.23836821757099053, lift=1.0)]),
...
print(len(results))

78

df=pd.DataFrame(results)
df

items	support	ordered_statistics
0	(mineral water)	0.238368	[((), (mineral water), 0.23836821757099053, 1.0)]
1	(burgers, eggs)	0.028796	[((burgers), (eggs), 0.33027522935779813, 1.83...
2	(burgers, french fries)	0.021997	[((burgers), (french fries), 0.252293577981651...

df.to_csv('apriori_result.csv')

print(df.iloc[6:19][['items','support']])
     items   support
6             (burgers, spaghetti)  0.021464
7                     (eggs, cake)  0.019064
8             (cake, french fries)  0.017864
9            (mineral water, cake)  0.027463
10               (spaghetti, cake)  0.018131
11        (mineral water, chicken)  0.022797
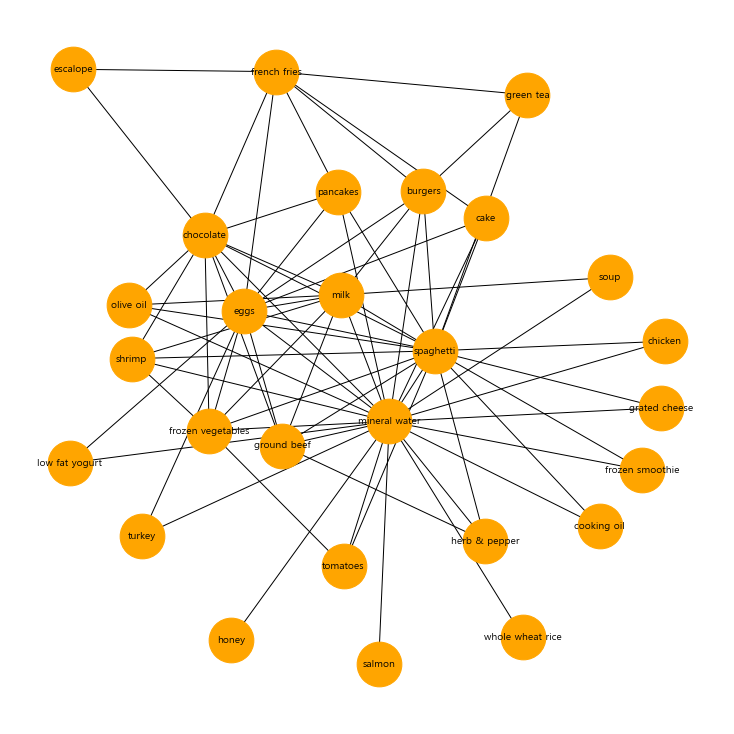
3. 연관품목의 시각화
ar=(df.iloc[1:74]['items'])
ar
1                       (burgers, eggs)
2               (burgers, french fries)
3                  (burgers, green tea)
4                       (burgers, milk)
5              (burgers, mineral water)
                    ...
69    (mineral water, whole wheat rice)
70               (olive oil, spaghetti)
71                (spaghetti, pancakes)
72                  (spaghetti, shrimp)
73                (spaghetti, tomatoes)
Name: items, Length: 73, dtype: object

df = pd.DataFrame(list(ar), columns=['FROM', 'TO'])
df.head()

FROM	TO
0	burgers	eggs
1	burgers	french fries
2	burgers	green tea
3	burgers	milk
4	burgers	mineral water

import matplotlib.pyplot as plt
from matplotlib import font_manager
import networkx as nx
from networkx.drawing.nx_pydot import graphviz_layout

G = nx.from_pandas_edgelist(df, source = 'FROM', target = 'TO')

# 한글 폰트 설정
ko_font_location = "C:/Windows/Fonts/malgun.ttf"
ko_font_name = font_manager.FontProperties(fname=ko_font_location).get_name()

# 품목 연관 시각화
plt.figure(figsize=(10,10))
nx.draw_kamada_kawai(G)
pos=nx.kamada_kawai_layout(G)
nx.draw_networkx_labels(G, pos, font_family=ko_font_name, font_size=10, font_color='black')
nx.draw_networkx_nodes(G, pos, node_color='orange', node_size=2000, alpha=1)
plt.show()