[Paper Review] Predicting Metastasis Risk in Pancreatic Neuroendocrine Tumors Using Deep Learning Image Analysis
Paper Review
Predicting Metastasis Risk in Pancreatic Neuroendocrine Tumors Using Deep Learning Image Analysis
Introduction
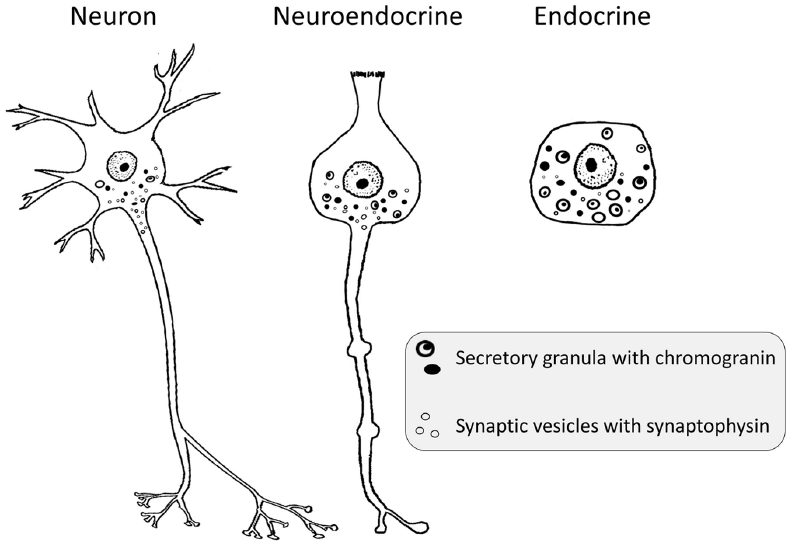
Neuroendocrine
Pancreatic neuroendocrine tumor (PanNET)
Endocrine cell은 secretion과 관련이 있음. 그 중 neuron의 형태와 기능을 가지면서 endocrine cell의 기능도 하는 cell을 neuroendocrine이라 지칭함.
- pancreatic cancer 에서 second most common type임.
- Secrete hormones into blodstream
- Well-differentiated WDNET, poorly differentiated PDNEC subtypes
기존 방식은 Mitotic count와 Ki-67 index, 하지만 prone to quantification error
이를 포함한 최근 방식들은 metastasis risk prediction에 failed
약 15% 의 patient가 metastasis를 겪음.
Necrosis, variations in nuclear shape(atypia), chromatin clumping, reduction in tumor stroma 등의 morphological feature를 보임.
Method
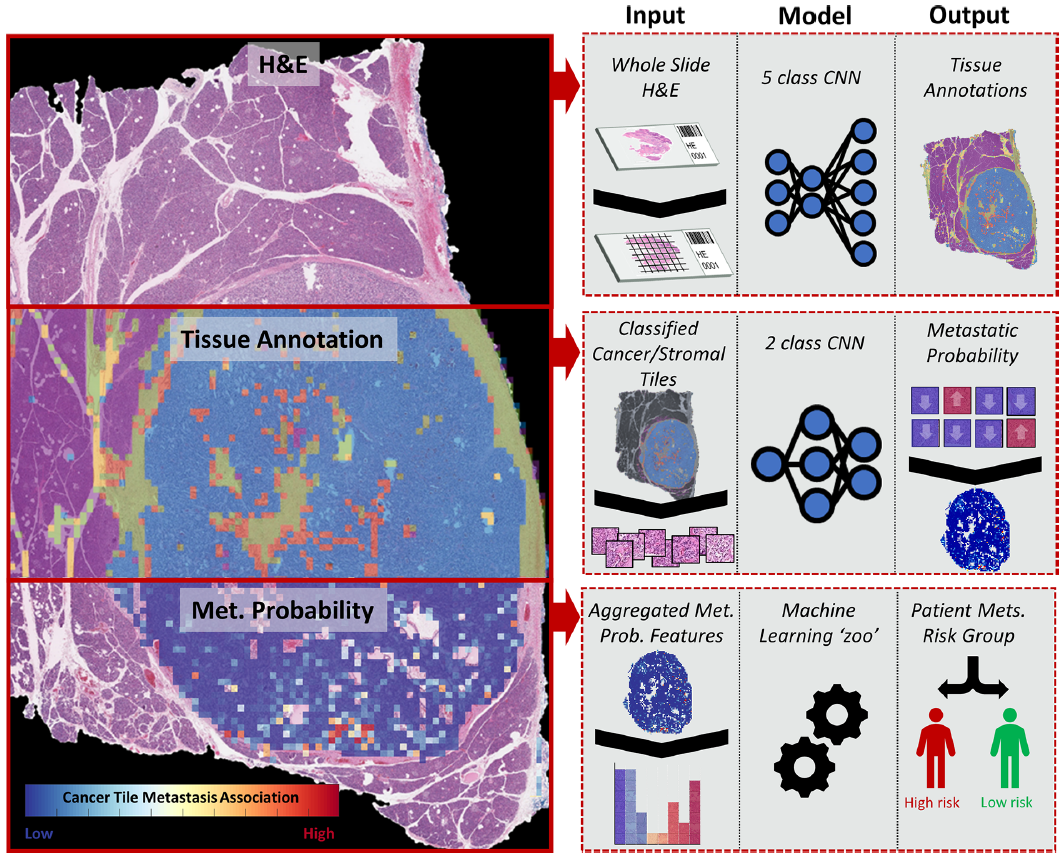
Proposed pipeline
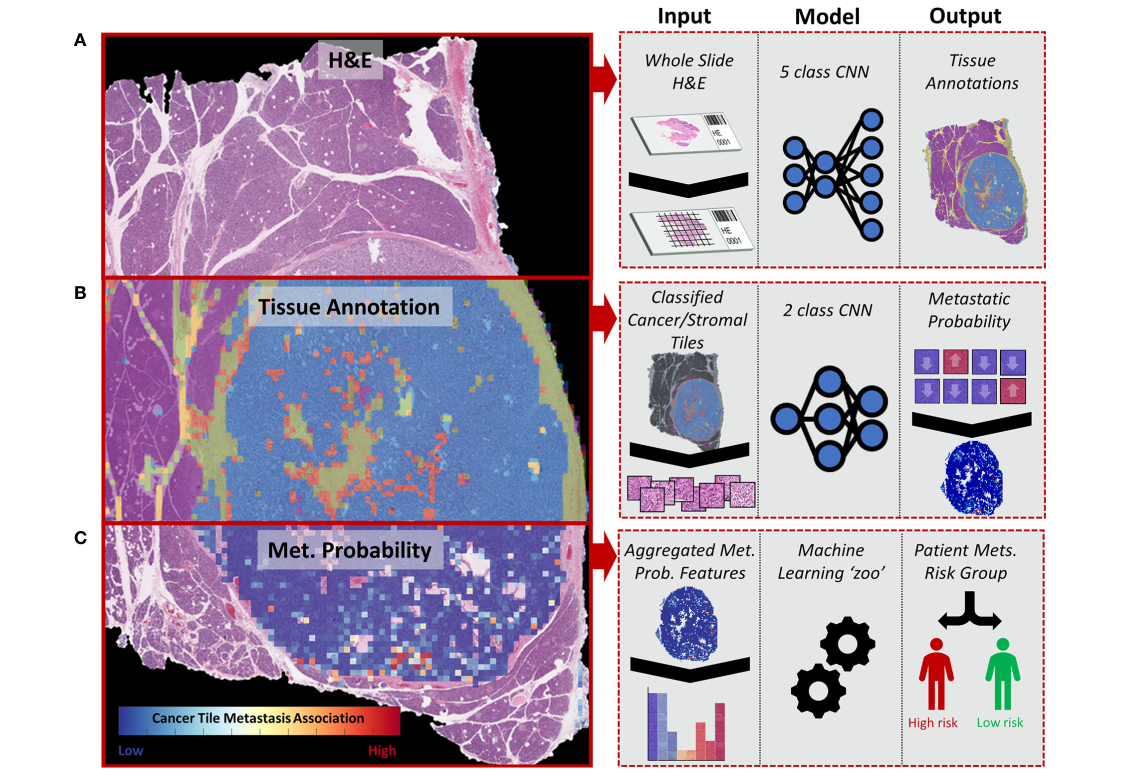
총 3 stage 형태를 띄고 있음
1) H&E image를 이용한 tissue 5 class multi-classification (automated annotation)
2) Metastasis association classifier - cancer/stroma tile 따로 2개의 모델 학습.
3) WSI feature extraction, aggregation and metastasis prediction (patient-level)
Data
Tissue sample from surgical resections of PanNET patients by Emory hospital
89 cases (total 104 WSI), 20% developed metastasis
Grade: Ki-67 index, 77.5% 대부분 환자 low grade.
Duration은 surgery 이후 time of mestasis 또는 last follow-up 까지의 기간.
FFPE H&E staining image - 40x magnification, 0.24 um/pixel size
Automated WSI annotation
Pre-trained GoogLeNet (Inception V1) CNN model + terminal softmax layer
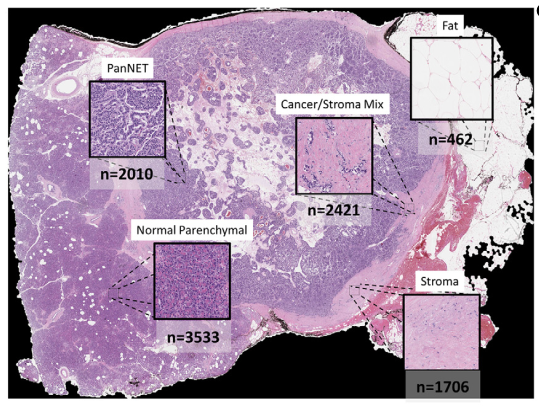
5가지 class로 구분. Five-dimensional probability matrix
[cancer (only cancer), stroma (only stroma), cancer (mixed), normal parenchymal, fat]
Data preprocessing
WSI were down-sampled four times for tissue classification
Color normalization, augmentation (hue/blur/noise/contrast) - train tiles 46배 expand.
training set : 466,072 tiles
Validation set: 42,976 tiles - 50% overlapping slides - 11 slides?
Metric: pathologist-annotated ares와 Jaccard index로 측정.
Metastasis Association Classifier (tile-level)
앞선 분석 결과 high probability (95% 이상)를 가진 cancer tile, stroma tile 을 사용.
Two GoogLeNet (Inception V1) classifier
WSI (89 patients / 104 slides) - 5 fold cross-validation, 15 epochs
0.5 부터 시작해서 0.9999까지 probability threshold를 달리하여 confusion matrices 를 뽑아냄.
UMAP (uniform manifold approximation and projection)으로 dimension reduction (1024 to 2)
Gaussian kernel로 맞춰진 Bivariate kernel density estimators을 이용해 UMAP cluster density도 봄.
WSI feature extraction, aggregation and metastasis prediction (patient-level)
tile 의 distribution of metastasis association score를 이용하여, 150개의 (slide 단위) feature를 구성.
Feature set 에는 각 stromal tile, cancerous tile에 대한 statistical moment, tile count/proportion, cluster 정도 등이 포함되어 있음.
Missing value는 imputation using mice (https://www.jstatsoft.org/article/view/v045i03)
Feature set을 cancer-only feature group / stroma-only feature / cancer+stroma feature 세 그룹으로 나누어 18 different machine learning model에 넣음.
ensembling approach was also tested by combining the outputs of models trained with stromal features to those trained with cancer features.
-> 이 부분 잘 이해가 안감..
accuracy 향상과 data dimensionality reduction을 위해 filtering-based feature selection.
Metastasis 일어난 환자와 아닌 환자 간의 t-test가 all feature에 대해 이루어짐.
Kaplan-Meier survival analysis (univariate, multivariate) using cox regression
SHAP (Shapley additive explanation) values를 이용해 selected model의 output을 설명.
Pipeline Generalization
Overfitting을 강력히 제한함과 동시에 pipeline의 generalizability를 분석.
Nested LOOCV approach
Inner loop: 10-CV with t-test for each features (filtering)
Optimized feature set - selected by each model performance in inner CV loop
Outer loop: random forest until 모든 patient 분석완료
Results
Automated WSI annotation
5-class classification resuls
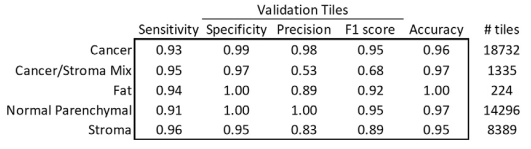
11 slides partially annotated slides for each class were extracted using MATLAB Image Labeler
Overall 92.8% of accuracy, greater than 90% sensitivity and specificity
F1 score of 0.95 of cancer and normal parenchymal regions
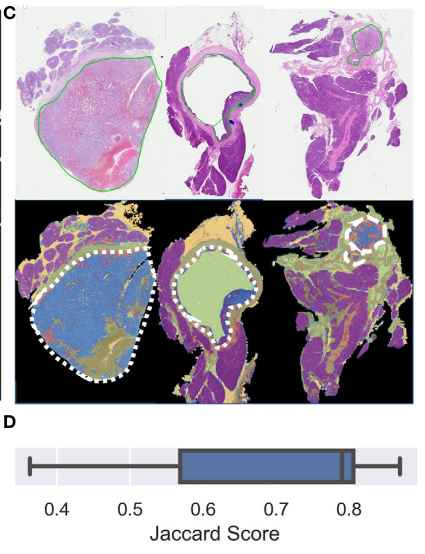
Median Jaccard index: 0.79
With false positive areas (대부분 sparse edges/interface areas), (어짜피 probability 95% 이하라 subsequent analysis에서 제외됨.)
Prognostic Value of Model
앞선 analysis에서 95% probability 이상 cancer/stroma tile.
총 430,418 cancer and 211,361 stroma tile annotations가 사용됨.
- Cancer model F1 score: 0.64
- Stroma model F1 score: 0.60
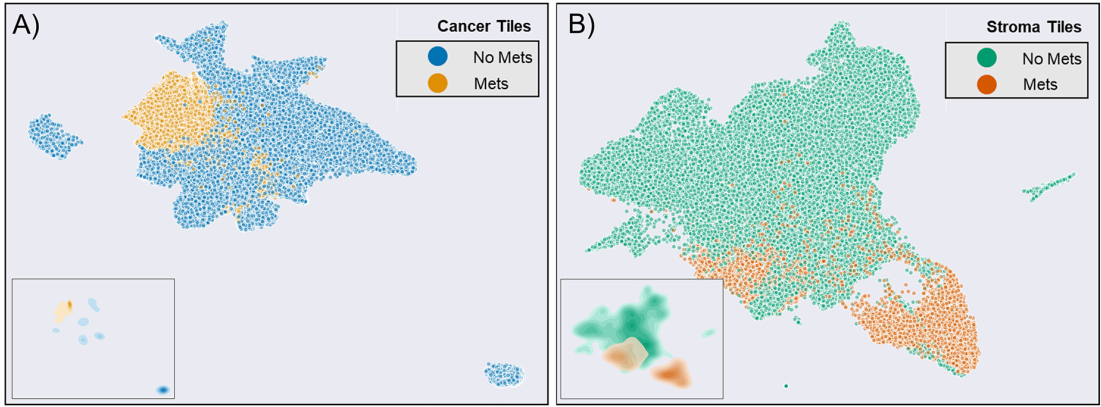
모든 cross-validation test fold의 CNN final pooling layer을 UAMP clustering함.
Metastasis, non metastasis tile이 잘 나뉘었음.
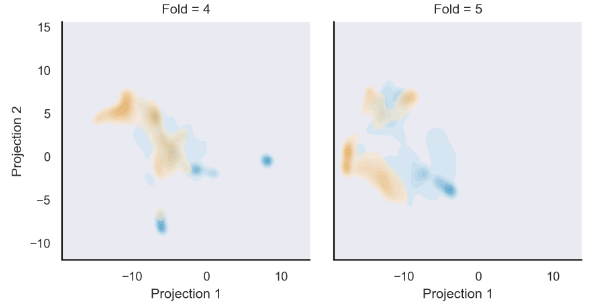
이는 KDE로 fit된 UMAP representation density.
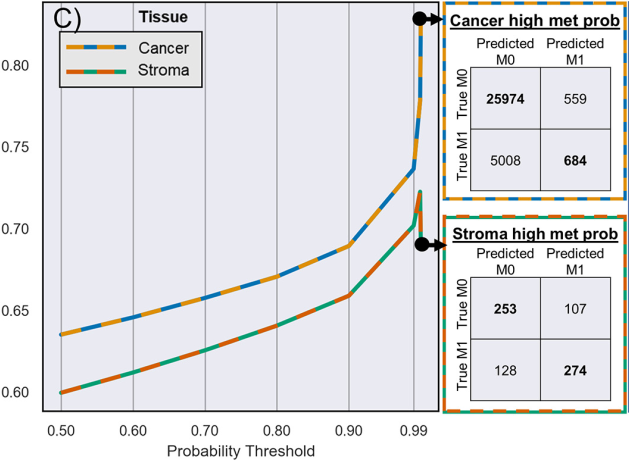
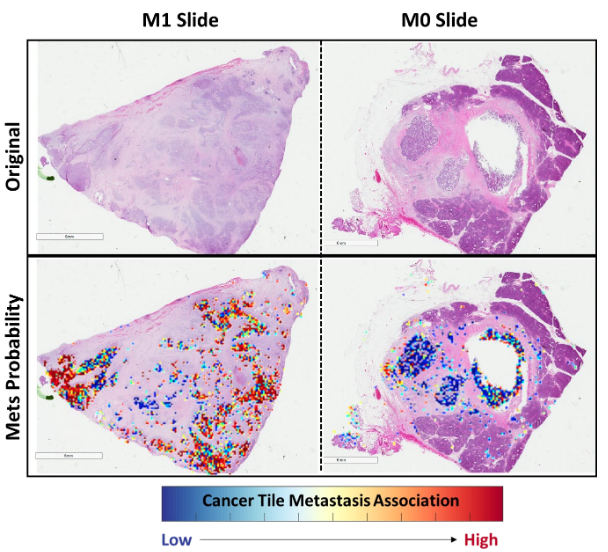
Tile 별 metastasis prediction 결과의 probability threshold를 점점 달리하며 F1 score 성능을 측정함.
Poor discriminatory power for low-confidence metastasis-associated areas,
In sharp contrast to its excellent discriminatory for high-confidence areas
: indicate that stromal and cacner tiles possess morphological features which could be translated” into risk of metastasis by deep learning pipeline
With 99.99 probability score, cancer tile F1 score: 0.83
With 99.9 probability score, stroma tile F1 score: 0.72
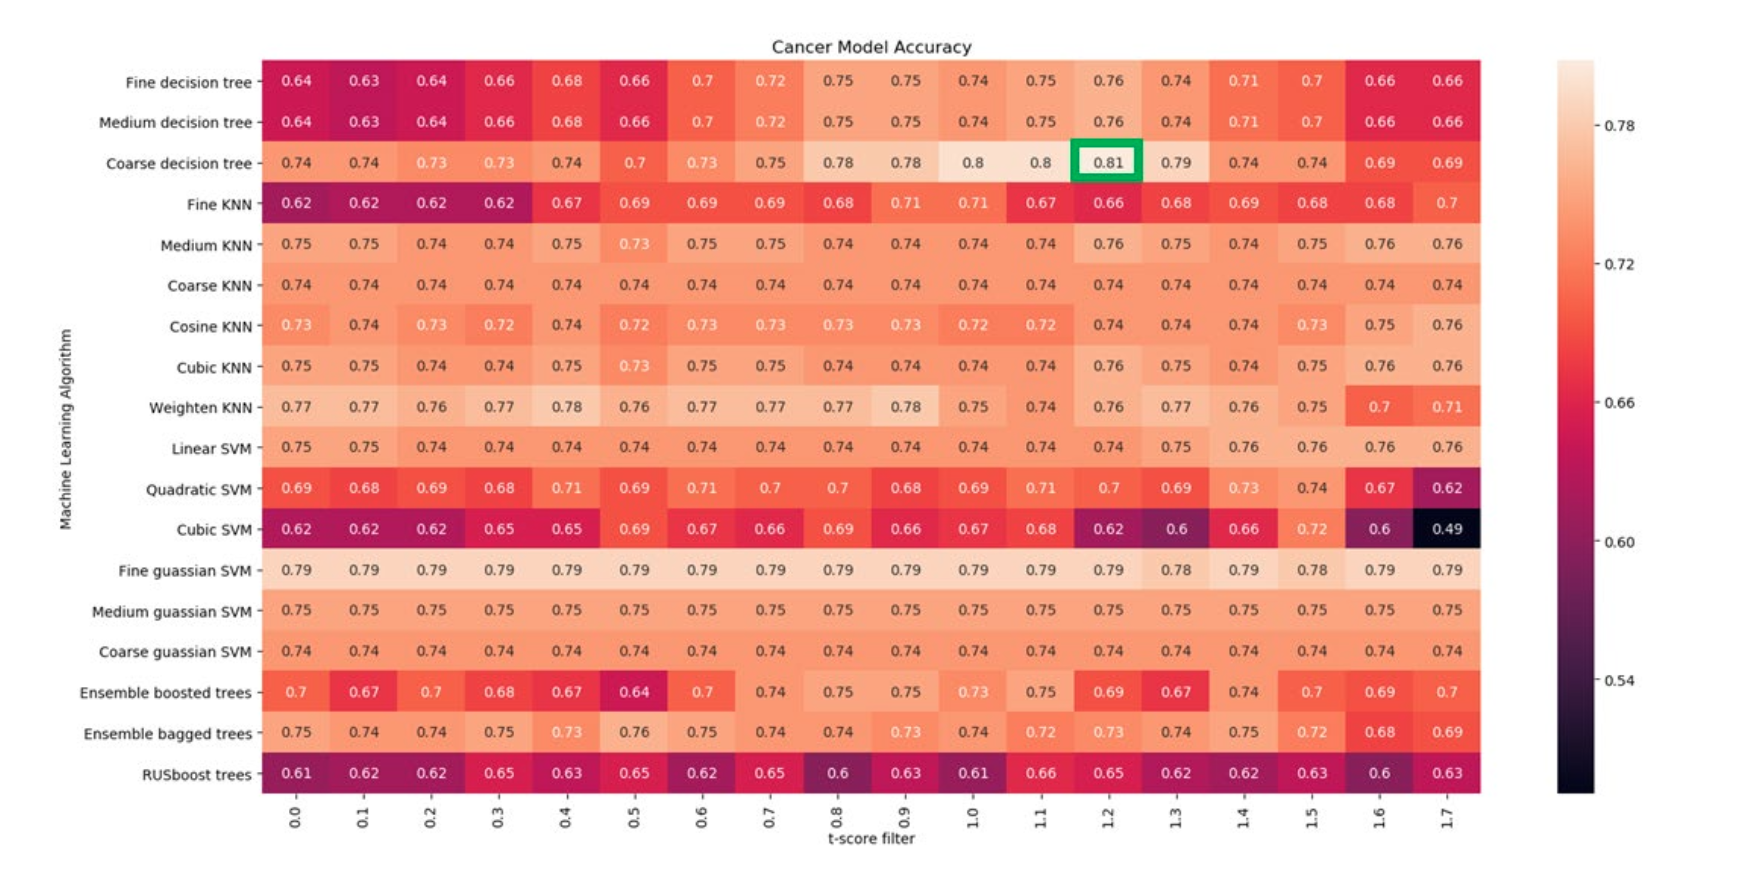
Tile score를 기반으로 slide feature를 구성하고, t-score 1.2 이상 feature를 사용하여 machine learning 기법에 LOOCV로 적용한 결과 accuracy 80.77%
Stromal feature만 사용한 결과 accuracy 79.81%, 모든 feature 결과 accuracy 78.84%

SHAP analysis (importance of each feature in determining a high (>0 SHAP) or low (<0 SHAP value) risk)
: number of high probability cancer metastasis tiles가 leverage largest impact on the model
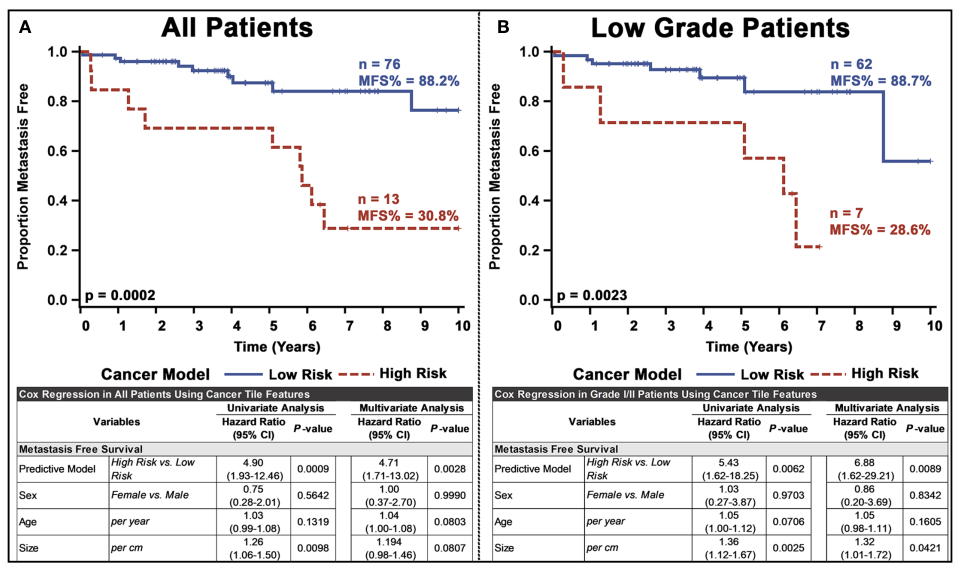
마지막으로 tile 결과를 patient-level 로 aggregation을 거치고, 이를 기반으로 Kaplan-Meier estimation, log rank test를 거친 결과 all patients 에서 p = 0.0002, low grade patients 에서 p = 0.0023으로, 유의미한 차이를 보였다.
Low grade patient에서도 유의미한 차이를 보였다는 것은, 기존 Ki-67 index를 기반으로 한 grading 방식에 verticle한 혹은 더 세밀한 stratification이 가능하다는 것을 암시함.

Testing the pipelines generalizability through nested CV
All patient: p=0.0143, significant differences between two groups
Low grade patients: p=0.0717, not significantly different. Small margin..
Discussion
limitation
- Cohort was from a single institution
: 다른 연구들에서는 여러 cohort로부터 internal test set, external test set을 구성했었음. - Training data의 수 부족이 있었다고 주장함
: 특히 nested CV model을 사용하여 low grade patient group이 안 나누어진 것을 언급. - Tumor stage 등의 clinicopathological variable 정보가 안 들어감.
- Metastasis prediction model에 normal parenchymal 정보가 들어가지 않음.
Conclusion
- tissue segmentation: three stage pipeline의 첫 stage에서, pre-trained CNN model을 이용해 WSI를 5 tissue classes로 분류함. 이후 cancer, stroma tile에 대해 metastasis prediction이 이루어짐.
여러 분석이 이루어졌고, 무엇보다 tile 기반 prediction 결과로 slide의 feature를 구성한 점이 참고할만함. 또한 기존 Ki-67 index 기반 grading 결과 한 group으로 묶인 환자들을, 제시한 모델로 stratification 했다는 점에서, 새로운 biomarker로서의 의미가 있음. 다만 cohort와 patient 수가 적음.