[Paper Review] Deep learning predicts postsurgical recurrence of hepatocellular carcinoma from digital histopathologic images
Paper Review
Deep learning predicts postsurgical recurrence of hepatocellular carcinoma from digital histopathologic images
Introduction
Post surgical patient for hepatocellular carcinoma (HCC) 의 recurrence risk stratification 을 위해 tumor region을 segmentation 하고 informative tile을 선별한 뒤에 risk prediction model 을 통해 patient 별로 continuous 한 risk score를 구하였다. 여러 statistical analysis를 적용하여 variables과 model에 대해 다방면으로 validate, evaluate 하였다.
Experiments setting and Results
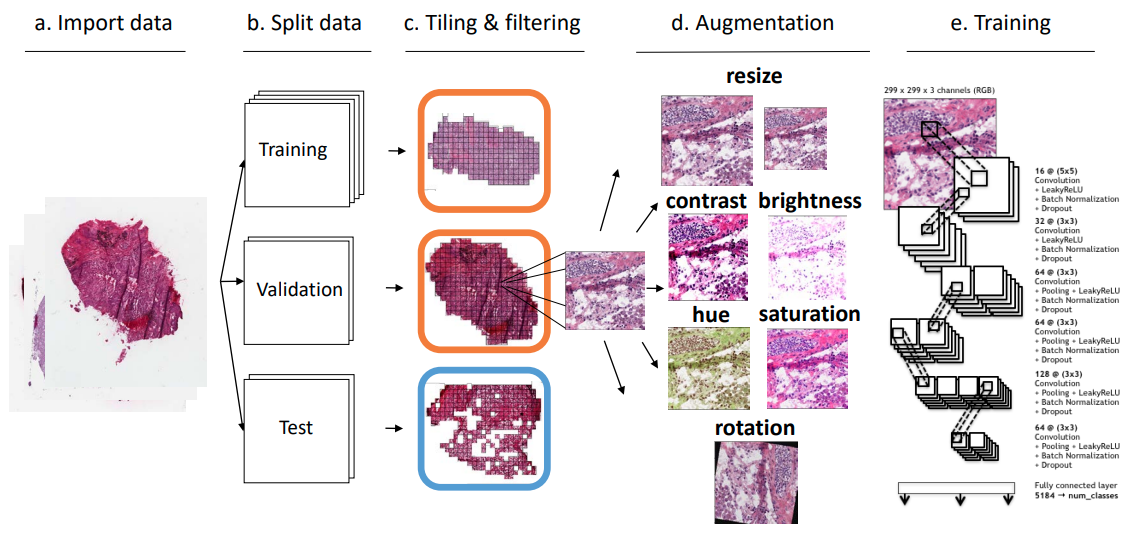
Overview of proposed pipeline

Deep learning based system으로, risk score를 통해 recurrence-free interval (RFI)를 predict.
Two stage 로 이루어져 있음.
Tumor tile classification 와 risk prediction 파트로 이루어져 있음.
Tumor tile classification
Automatically detect tumor-containing tiles within WSI를 위해 다음과 같은 데이터셋 사용
Stanford HCC (annotated by pathologist)
100976 tiles from 28 WSI : training
15834 tiles from 4 WSI : validation
11412 tiles from 4 WSI : internal test
TCGA-HCC
82532 tiles from 30 WSI : external test
Model details
구체적으로 다음과 같은 모델을 사용함.
Input: 299 x 299 pixel image tile in PNG format
Architecture: PathCNN - leaky ReLU, positional transforms, Adam
위 방법을 통해 아래와 같은 결과를 얻음.

Internal test set: 92.3% , AUC 0.952 (95% CI 0.948, 0.957, p<0.0001)
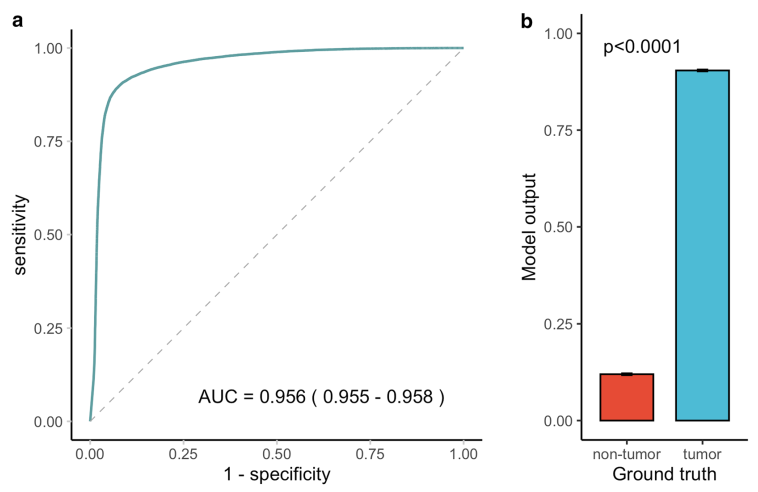
External test set: 90.8%, AUC 0.956 (95% CI 0.955, 0.958, p<0.0001)
Risk score prediction
Datasets
TCGA-HCC training/validation (299 patients, 151 event occurs)
TCGA-HCC internal test (53 patients, 25 event occurs)
Stanford-HCC external test (198 patients, 62 event occurs)
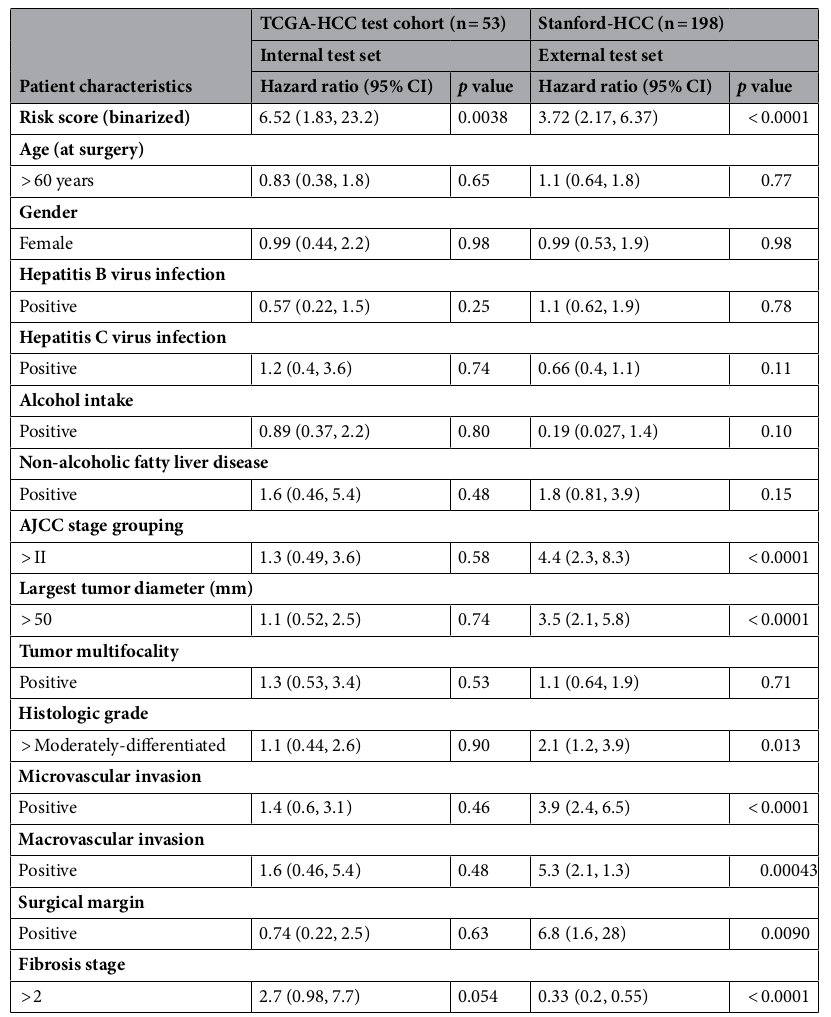
Risk factors test results
risk 에 요인을 주는 환자의 clinical features에 대해
Univariate Cox regression analysis를 수행하여 다음과 같은 결과들을 얻음.
Internal (TCGA): None (1개 아슬아슬)
Batts-Ludwig fibrosis stage > 2 [HR = 2.7 (95% CI 0.98, 7.7), p=0.0543]
External (Stanford): 7개
AJCC stage grouping > II [HR = 4.4 (95% CI 2.3, 8.3), p < 0.0001],
greatest tumor diameter > 5 cm [HR = 3.5 (95% CI 2.1, 5.8), p < 0.0001],
histologic grade > moder-ately differentiated [HR = 2.1 (95% CI 1.2, 3.9), p = 0.0128],
presence of microvascular invasion [HR = 3.9 (95% CI 2.4, 6.5), p < 0.0001],
presence of macrovascular invasion [HR = 5.3 (95% CI 2.1, 13), p < 0.0001],
positive surgical margin [HR = 6.8 (95% CI 1.6, 28), p = 0.009],
fibrosis stage > 2 [HR = 0.33 (95% CI 0.2, 0.55), p < 0.0001]
HCC-SurvNet performance for RFI prediction
Dataset
TCGA-HCC train/val (n=299 WSI) and internal test (n=53 WSI)
Stanford-HCC external test dataset (n=198 WSI)
여기서 위 tumor detection classification model을 통해 예측한 probability가 높은 상위 100개의 tile을 slide 별로 추출. (100의 선정 기준은 slide의 heterogeneity를 반영하기 위함.)

Architecture, detailed reference
MobileNetV2 pretrained on ImageNet 을 통해 continuous risk score를 계산.
fully-connected layer를 replace하고 TCGA HCC train/val dataset을 통해 fine-tuned 됨.
Loss는 partial log-likelihood of Cox PH model 사용.
Tile-level risk score는 patient 별로 average 되어 사용됨.
C-index, Kaplan-Meier estimation, log-rank test results
Internal test set: 0.724 / 0.724
External test set: 0.683 / 0.670
Risk score를 바탕으로, high/low subgroup으로 나누어 KM estimation, log rank test 진행.

internal test set (log-rank p value = 0.0013)

external test set (log-rank p value < 0.0001)
Risk score로 univariate Cox-PH analysis
Internal test set [HR = 6.52 (95% CI 1.83, 23.2), p = 0.0038]
External test set [HR = 3.72 (95% CI 2.17, 6.37), p < 0.0001]
(위에 길쭉한 table에 나와있음)
Restricted cubic splines (3 knot)으로 실험 진행
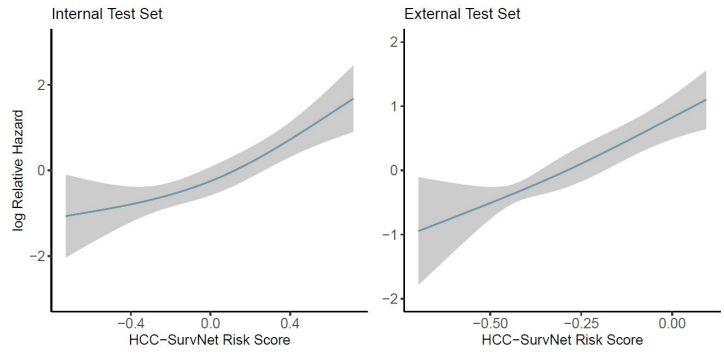
왜 진행했는지는 모르겠지만… 암튼
validate the use of HCC-SurvNet’s risk score as a linear factor in the Cox analyses
Risk score 포함 multivariate Cox-PH analysis
Internal test set [HR = 7.44 (95% CI 1.60, 34.6), p = 0.0105]
External test set [HR = 2.37 (95% CI 1.27, 4.43), p = 0.00685]
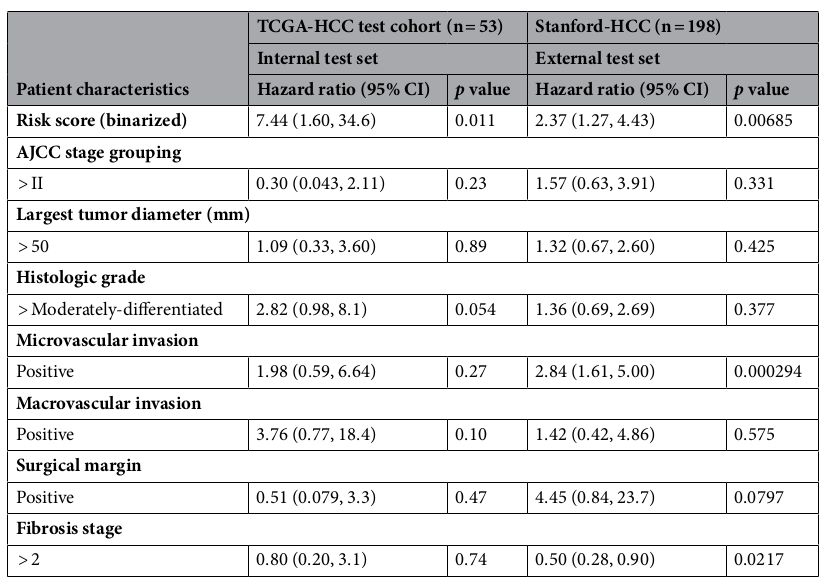
추가로, internal test set에서 다른 feature는 significance 를 띄지 않았음.
External test set 에서는, macrovascular invasion, fibrosis stage가 significance를 띄었음.
Schoenfeld’s global test
이 실험은, cox ph model에서 중요한 baseline assumption이 위배 되는지 확인하는 test임.
Internal test set (p=0.083), external test set (p=0.0702) 결과 위배 안됨.
Mixed-effect Cox regression analysis
TCGA dataset 내에서도, institution 별로 존재하는 bias가 있다고 가정한 (random effect) mixed effect cox regression analysis 를 거쳤을 때 일관된 결과가 나옴.
Risk score (p=0.014), histologic grade (p=0.014), macrovascular invasion (p=0.013)
3 predictor: independent predictor.
External test cohort에 대해, risk score과 다른 clinical feature간의 correlation test
Spearman’s correlation test를 통해, external test cohort의 clinical feature와 HCC-SurvNet’s risk score 과의 correlation 이 있는지를 확인함.
(목적은 to gain insight into association 라고 함.)
예측된 risk score와 - (table은 생략)
양의 상관관계: AJCC stage grouping, greatest tumor diameter, and microvascular invasion, 음의 상관관계: fibrosis stage
Comparison with AJCC stage grouping
기존 AJCC stage grouping 기반 c-index와 비교했을 때 성능 향상을 보임.
internal test set: 0.56 → 0.72
external test set: 0.60 → 0.68
Discussion
성능 면에서 기존 HCC patient를 대상 nomogram c-index (=0.66) 을 제침.
Accuracy, objectivity, reproducibility of biomarker assessment 면에서 발전.
HCC 에서 기존 manual tile selection 방식에서 tumor classification 모델을 최초 시도.
다양한 statistical analysis를 통해…
- Review and confirmation of all clinicopathologic variables in TCGA-HCC
- Re-coding of older edition AJCC classifications (inconsistency 존재한다 알려짐.)
Conclusion
- tissue segmentation: tumor classification model을 먼저 진행하고, 그 중 informative 한 tile 들을 골라 risk prediction 에 이용함.
논문을.. 읽는데 하루가 꼬박 걸렸다. 그만큼 눈여겨 봐야할 부분이 많았던 논문이다. 단순히 성능만 뽑고 끝내는 것이 아닌 꼼꼼한 체계적인 통계적 분석이 수행되었다. 배우고 참고할 점이 많았다.
참고문헌:
https://stats.oarc.ucla.edu/other/mult-pkg/introduction-to-linear-mixed-models/#:~:text=Linear%20mixed%20models%20are%20an,or%20patients%20from%20within%20doctors
(random effect and mixed regression model)