데이터 년도별로 시각화
terrorcount컬럼 만들어서 groupby
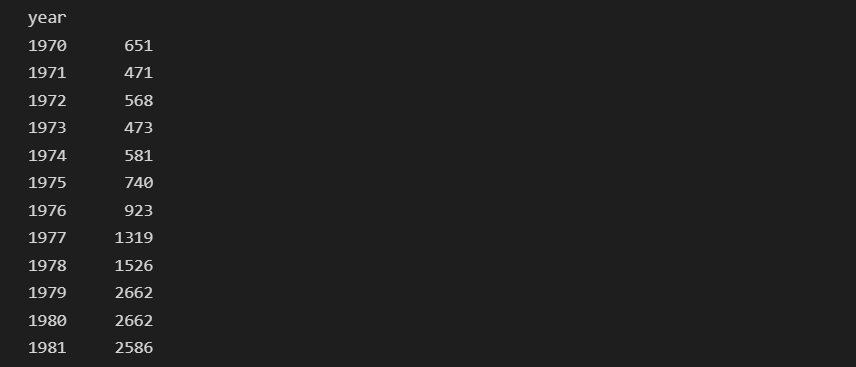
df.groupby('year')['terrorcount'].sum()
-> 시리즈형태로 반환
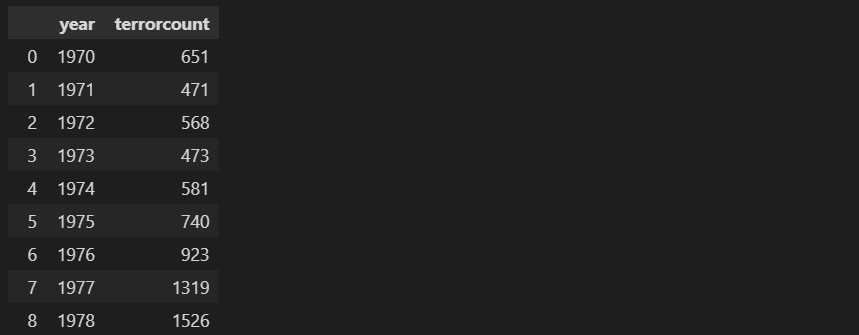
df.groupby('year')['terrorcount'].sum().reset_index()
-> 데이터프레임형태로 반환1
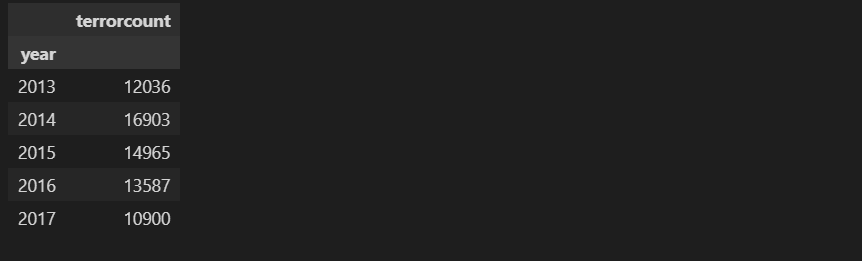
df.groupby('year')['terrorcount'].sum().to_frame()[-5:]
-> 데이터프레임형태로 반환2
- 특정기간 확대 시각화
fig, ax=plt.subplots(figsize=(15,6))
sns.countplot(x='year',data=df[df['year']> 2011],palette='RdYlGn_r')
ax.bar_label(ax.containers[0]) # bar 위에 레이블 표시
df[df['컬럼명'] 조건]

하하...하.