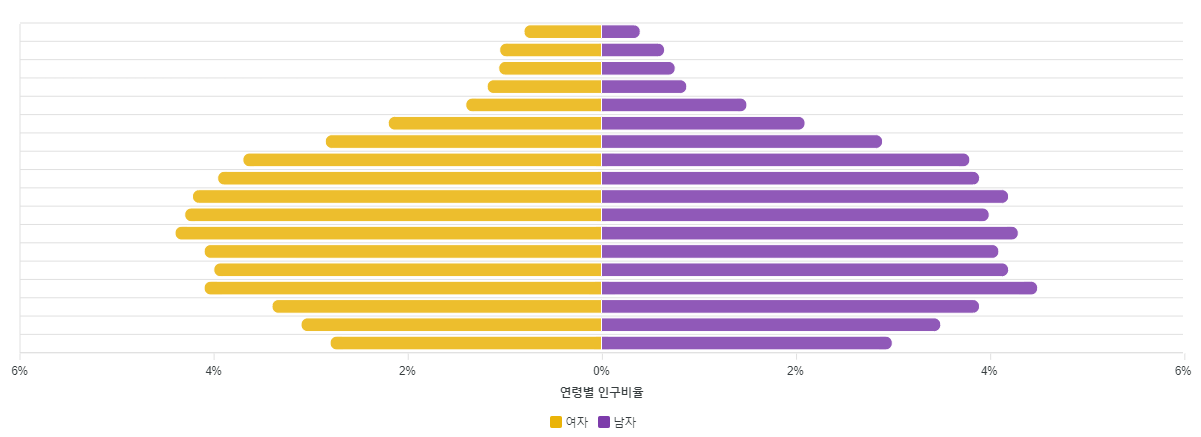
ApexChart Bar Radius effect example
this.populationChart = {
      series: [
        {
          name: '여자',
          data: [
            -0.8, -1.05, -1.06, -1.18, -1.4, -2.2, -2.85, -3.7, -3.96, -4.22,
            -4.3, -4.4, -4.1, -4, -4.1, -3.4, -3.1, -2.8,
          ],
        },
        {
          name: '남자',
          data: [
            0.4, 0.65, 0.76, 0.88, 1.5, 2.1, 2.9, 3.8, 3.9, 4.2, 4, 4.3, 4.1,
            4.2, 4.5, 3.9, 3.5, 3,
          ],
        },
      ],

      chart: {
        type: 'bar',
        height: 440,
        stacked: true,
        toolbar: {
          show: false,
        },
        width: '100%',
      },
      colors: ['#eab308', '#7D3CAB'],
      plotOptions: {
        bar: {
          horizontal: true,
          barHeight: '80%',
          borderRadius: 6, // rounded 정도
          borderRadiusWhenStacked: 'all', // 적용할 bar 범위
        },
      },
      dataLabels: {
        enabled: false,
      },
      stroke: {
        width: 1,
        colors: ['#fff'],
      },

      grid: {
        xaxis: {
          lines: {
            show: false,
          },
        },
      },

      tooltip: {
        shared: false,
        x: {
          formatter: function (val: number) {
            return val.toString();
          },
        },
        y: {
          formatter: function (val: number) {
            return Math.abs(val) + '%';
          },
        },
      },

      yaxis: {
        opposite: false,
        show: false,
      },

      xaxis: {
        categories: [
          '85+',
          '80-84',
          '75-79',
          '70-74',
          '65-69',
          '60-64',
          '55-59',
          '50-54',
          '45-49',
          '40-44',
          '35-39',
          '30-34',
          '25-29',
          '20-24',
          '15-19',
          '10-14',
          '5-9',
          '0-4',
        ],

        title: {
          text: '연령별 인구비율',
        },

        labels: {
          formatter: function (val) {
            return Math.abs(Math.round(parseInt(val, 10))) + '%';
          },
        },
      },
    };```

DevSecOps, Pentest, Cloud(OpenStack), Develop, Data Engineering, AI-Agent