1. Introduction
- 기존 연구는 semantic shift만 고려했는데, covariate shift를 평가에서 제외하거나 OOD의 신호로써만 다뤘다. 이는 training distribution을 뛰어넘어 generalize하고자 하는 ML에서의 primary goal을 부정하는 것이다
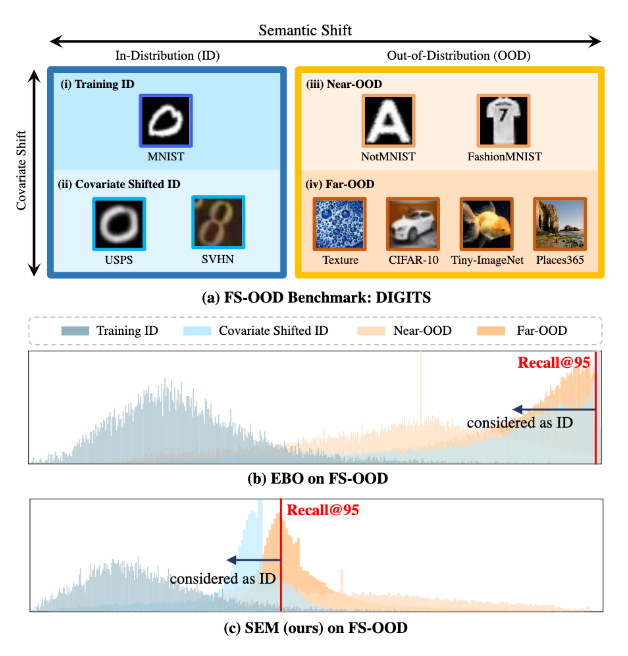
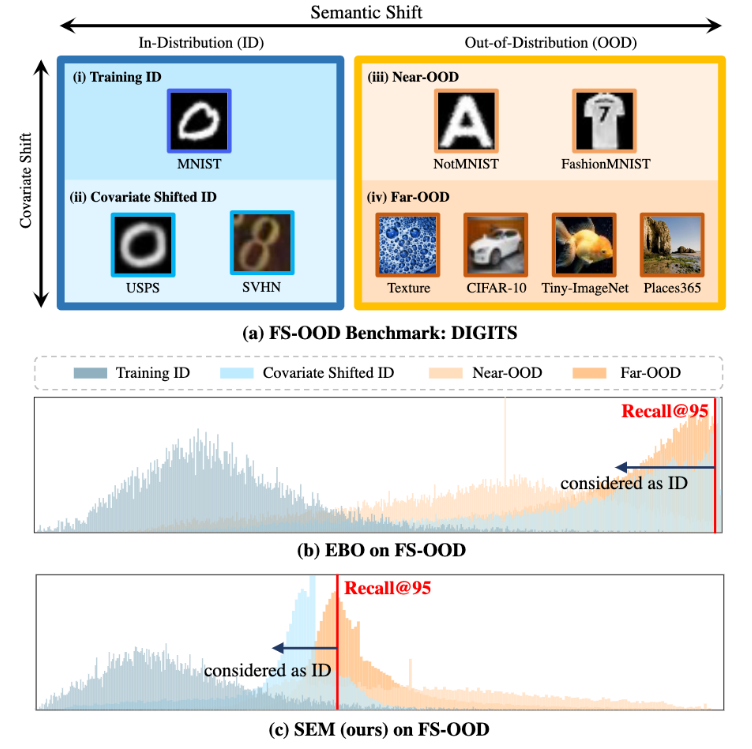
- 우린 둘 다 고려한 full-spectrum out-of-distribution (FS-OOD) detection을 선보이겠다.
- SOTA OOD detection method인 energy-based EBO를 FS-OOD benchmark에서 봤더니 ID와 OOD 구분에 실패한 것을 보여줬고, 제안하는 SEM은 ID과 OOD가 좀 더 분명하게 구분했음
이 연구의 contribution은 다음과 같음
1) semantic 및 covariate shift 둘 다 평가하는 더 현실적인 시나리오, full spectrum OOD Detection problem를 소개함
2) FS-OOD detection을 위한 3 benchmark datasets을 설계했음
3) 간단하지만 효과적인 OOD detection score function, SEM 제안
2. Related Work
- OOD detection의 key idea는 test sample이 in-distribution/out-of-distribution에서 왔는 지 평가하는 metric (score function)을 design하는 것
- 가장 널리 사용되는 metric은 conditional probability 를 기반으로 하는데, 초기 OOD 방법은 maximum softmax probability인데, deep neural network가 mis-classified or OOD data에 대해서 lower confidence를 낸다는 경향이 있다는 것에서 비롯되었다
- 후속 연구 ODIN은 temperature scaling parameter를 사용해 probability dist.를 soften하였고 더 나아가 adversarial perturbation을 input에 주입해 성능을 향상시켰음
- 모델 앙상블이 OOD detection에서 robustness 향상에 효과적인 걸 입증한 연구들도 있었음
- 다른 방향으론 marginal probability 를 반영한 metric를 design하는 것인데 Liu et al.는 energy-based formular를이용해 OOD score를 marginal distribution에 연결했는데, 이는 모든 클래스를 걸쳐 예측확률을 요약한다.
- Lee at al.은 source data가 정규분포를 따르고 test image와 estimated distribution parameter간의 불일치를 계산하기 위해 Mahalanobis distance를 학습한다고 가정합니다.
- test image를 scoring하는 것에 대한 likelihodd ratio를 추정하는 Generative modeling도 조사되었다.
- 이 연구는 기존의 연구가 하지 않았던 Full Spectrum OOD detection을 할 것이다. more challenging하지만, real-world application에서 critical한 시나리오다.
3. Methodology
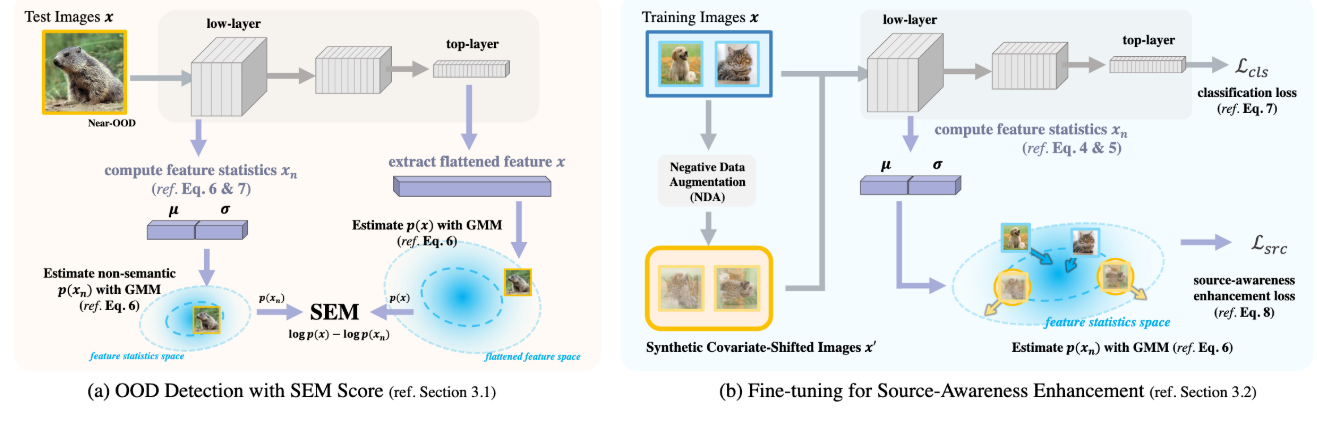
3.1. Feature-Based Semantics Score
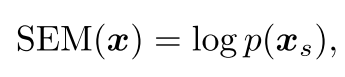
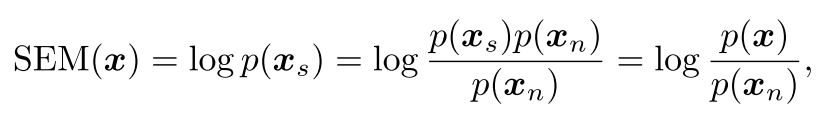
semantic shift에만 sensitive한 score, SEM을 제안
Formulation
는 neural net에서 학습된 image features, 는 semantic만 capture한 feature를 의미
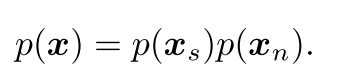
output features 은 semantic 정보와 non-semantic 정보를 둘 다 가지고 있는데, 이를 분리하는 건 여전히 open research problem. semantic feature 와 non-semantic feature 이 independently 생성된다면 이와 같이 쓸 수 있음
이를 다시 SEM의 식에 반영하면 다음과 같음
low-level feature statistics (평균과 표준편차) semantic과 본질적으로 관련이 없는 image style을 capture하는 것에 효과적이고, 은 이로부터 구해질 수 있음
Feature Statistics Computation
CNN feature map 에 대해서 feature statistics를 이와 같이 구할 수 있음.
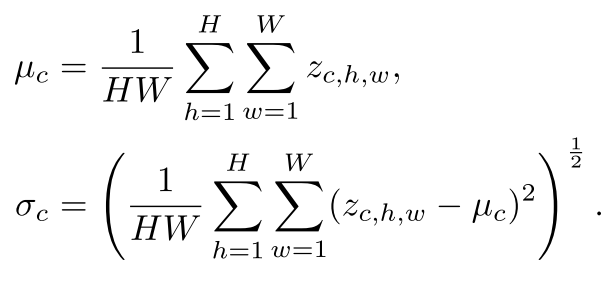
first CNN layer에서 feature statistics를 추출하여 mean과 std를 concat하여 을 정의함
Distribution Modeling
dimension reduction: entire population에 대한 variance를 maximizing하지 않고, 각 class에서 계산되는 variacne들의 합을 최대로 만드는 변형된 PCA를 사용함. 그리하여 class와 덜 상관성있는 space를 identify할 수 있음
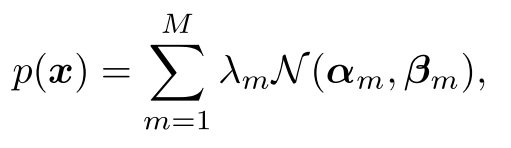
를 capture하기 위해 GMM을 사용함. 은 mixture component의 수이고, 은 mixture weight (), 과 은 normal dist의 평균과 분임
3.2. Source-Awareness Enhancement
feature statistics에서의 source-awareness를 향상시키기 위한 fine-tuning scheme를 제안
Negative Data Augmentation
fine-tuning scheme은 SEM이 semantics을 더 잘 capture하도록 돕기 위해 더 나은 non-semantic score의 estimate를 얻기 위함이다. 이는 ID data의 feature statistics를 more compact하게 만들고 OOD data의 feature statistics를 ID support area와 더 멀게 explicitly하게 훈련함으로써 이뤄질 수 있음. 이 연구에선 negative data augmentation을 사용하여 OOD sample들을 synthesize하고 covariate shift를 가진 sample들을 쉽게 생성할 수 있는 data augmentation 방법을 택한 것이 key idea고, 하나의 예는 Mixup이다.
Learning Objectives
source dataset NDA로 만든 OOD dataset ,
classification loss , source-awareness enhancement loss
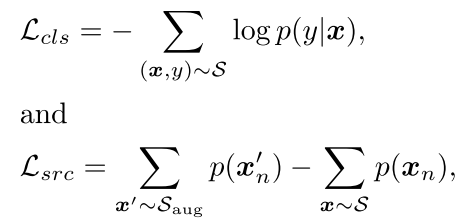
marginal probability 는 앞서 설명한 것처럼 GMM으로 계산됨.
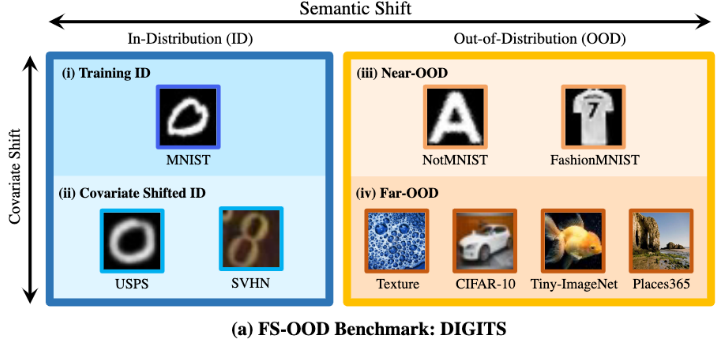
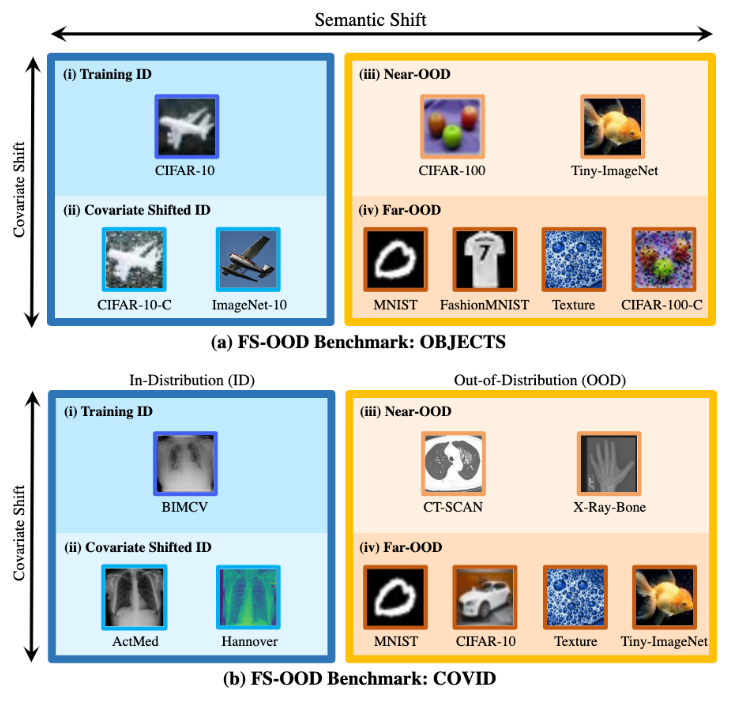
4. FS-OOD Benchmarks
FS-ODD를 위한 3 benchmarks를 설계함. Traning ID를 기준으로 Covariate Shifted ID, Near-ODD (Semantic Shift는 멀지만, Covariate shift는 그나마 가까운), Far-ODD (Semantic shit와 Covariate shift 둘 다 먼) 를 설정하였음
DIGITS (MNIST),
OBJECTS (CIFAR-10) - ImageNet-10은 ImageNet-22K에서 CIFAR-10과 같은 category만 고른 10,000개의 이미지를 뜻함. 5개의 classe
COVID (X-ray image로 Covid-19 infection을 식별하는 BIMCV)
5. Experiments
Implementation Details
- LeNet-5 for DIGITS, ResNet-18 for OBJECTS and COVID
- All models are trained by the SGD optim. with a weight decay of and a momentum of
- For DIGITS and OBJECTS, initial learning rate to 0.1, which is decayed by the cosine annealing rule. 100 epochs
- For COVID benchmark, initial learning rate = 0.0001, 200 epochs
- source-awareness enhancement을 위한 fine-tuning을 할 때, the learning rate = 0.005, 10 epochs
- batch size is set to 128 for all benchmarks
- SEM은 GMM에서 low-layer 에 대한 와 high-layer 에 대한 클래스 개수를 hyperparameter로 가지고
- output feature의 dim이 50이 넘으면, PCA로 dim = 50으로 dimension reduction이 수행된다
5.1. Results
Near-OOD와 Far-OOD에서 OOD SOTA인 MSP, ODIN, Mahalanobis distance score (MDS), Energy-based OOD와 비교했음
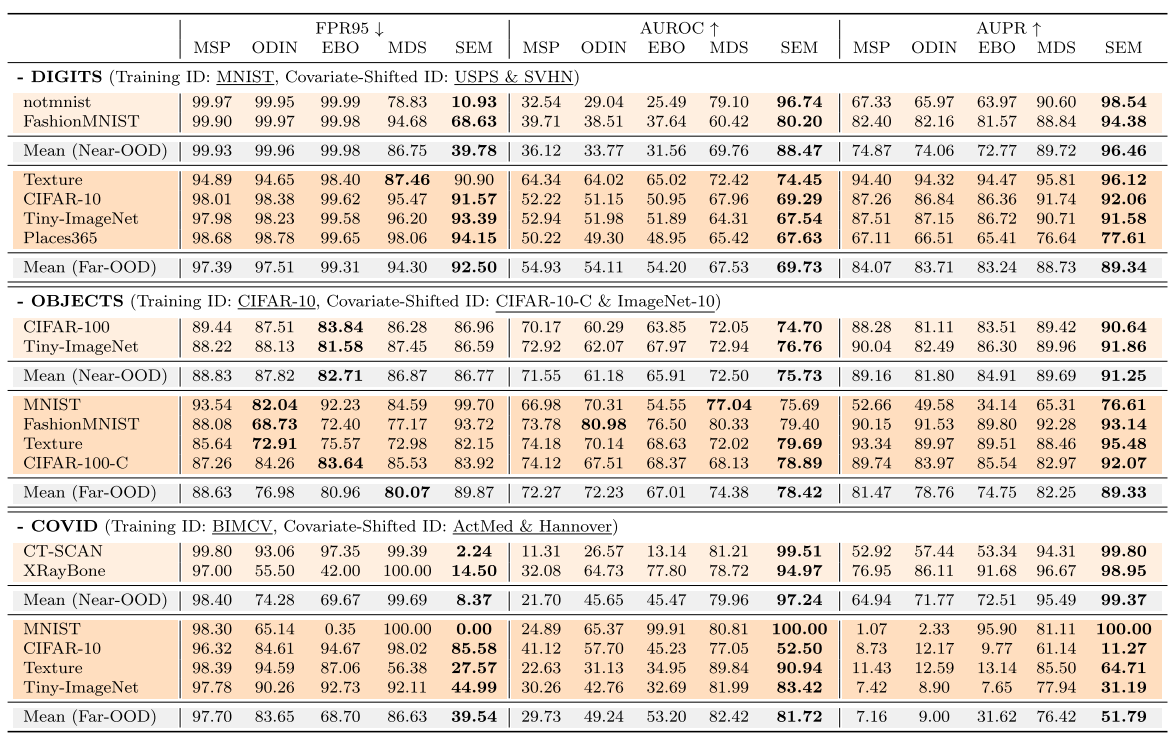
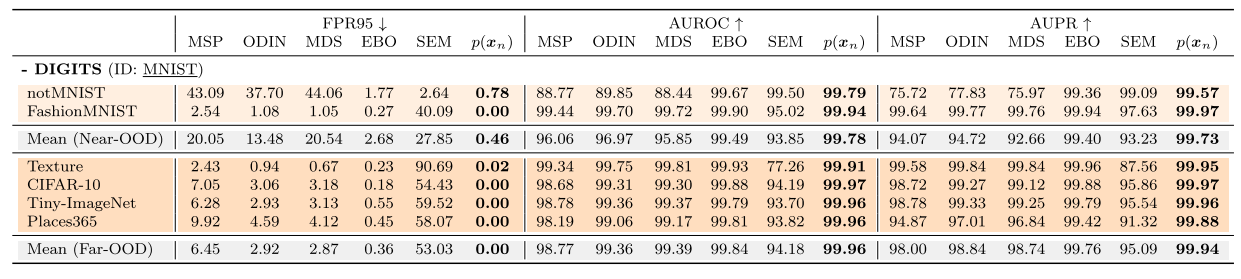
DIGITS Benchmark
특히 notMNIST에서 크게 성능을 향상시킴. 기존 ouput-based OOD detection 방법들은 covariate shift에 의존해 OOD sample들을 detect하였고 반면에 feature-based MDS (top-layer semantic-aware features에 부분적으로 의존하는)와 제안한 SEM이 MNISTㅗ와 notMNIST를 구분하는데에 중요한 semantic information을 더 많이 사용했다.
다른 말로, MNIST/NotMNIST 높은 visual similiarity를 지닌 scenario에서 semantic information을 무시하면 OOD seperation에 실패하게 된다는 것이다.
OBJECTS Benchmark
DIGIT과 유사하게, SEM이 Near-ODD scenrio에서 특히 robust한 metric인 AUROC와 AUPR들에 대해 기존 SOTA 방법들을 앞섰는데, DIGIT처럼 gap이 그렇게 크진 않았다.
OBJECT Benchmark의 이미지들은 DIGIT보다 complex하고 neural net이 semantic-oriented하게 되도록 했을 것이다. 이는 output-based 방법들에게도 semantic information이 더 encode되었다라고 볼 수 있음.
그럼에도 불구하고, SEM이 대부분에서 앞서긴 한다.
MNIST, Fashion MNIST에 대해서는 크게 앞서지 못했는데, 이를 따져보면 검정색과 흰색만 가진 이 두 데이터셋은 training ID와 covariate-shifted ID 둘 다에게 significant한 convariate shift를 가지게 되고 ODIN과 같은 covariate shift에 의존하는 방법들이 더 좋은 성능을 낼 수 있었을 것이라고 설명함. 허나, 그런 방법들은 그들이 CIFAR-10-C가 CIFAR-100보다 OOD이어야한다는 것을 믿기 때문에, near-OOD에서 실패한다
COVID Benchmark
이 OOD detection에서 real-world 적용을 위한 새로운 벤치마크 COVID에서 모든 metric에 대해서 압도적인 성능을 냈다. 특히 FPR95.
far-OOD sample에 대한 결과를 보면, output-based 방법들은 여전히 ID/OOD discrepancy에 민감하지 않는 현상을 DIGITS에서 나타난 것처럼 보여주고 있음.
! 표를 보면 AUROC와 AUPR에 대해서 최고성능 bold 표시가 잘못되어있음. Mean(Far-OOD)를 보면 AUROC와 AUPR에서 MDS까 앞썸.. FPR95에서 앞도적으로 좋았는데, AUROC, AUPRD에서 최고성능이 안 나온다는 게 맞는지 모르겠음.
Observation Summary
1) SEM은 near-OOD에서 consistently 좋은 성능을 보였고, classic output-based 방법들 (MSP, ODIN, EBO)들은 좋지 못한 성능을 냈다. 이는 output-based 방법들이 covariate shift information에 의존하기 때문에 covariate-shifted ID와 near-OOD를 구분할 수 없게 됨.
2) SEM은 far-OOD에서 underperform했는데, 이는 위와 비슷한 이유로 covariate shift로 구분하기 쉬운 far-OOD의 경우, classic OOD detector들이 성능이 더 좋을 수 있음
5.2. Results on Classic OOD Detection Setting
covariate-shifted ID를 안 사용한 DIGITS에 대한 Classic OOD Detection Setting에서 결과를 보면 기존의 방법들이 위 테이블보다 좋은 성능을 보이는 것을 알 수 있음. 이는 covariate-shifted ID에 대해서 기존 방법들이 굉장히 취약하다는 것을 말해주고, 이 연구에서 제안하는 좀 더 현실적인 Full-spectrum OOD benchmark를 권장함
"we also report the results that by using the value of p(xn), the score from low-layer feature statistics for detecting covariate shift is shown surprisingly effective on clas- sic OOD benchmark"
더 나아가, SEM의 non-semantic component인 low-layer에서 뽑은 feature statistics인 가 covariate shift를 detection하는데 놀라울 정도로 효과적임을 보여주고 있음. 이것만 사용하더라도 거의 완벽에 가까운 성능을 나오는 현상은 OOD의 목표와는 상반되는 것이다. 이 역시 FS-OOD benchmark를 중요성을 지지하게 된다.
이 semantic 정보와 무관한 low-layer feature statistics를 뽑은 건데, 그것만으로도 기존의 OOD를 다 앞선 건 classic OOD detection setting의 근본적인 결함이 있다는 것을 의미
5.3. Ablation study
AUROC로 비교함
Components of SEM
이 non-semantic information을 담고 있는 게 key point
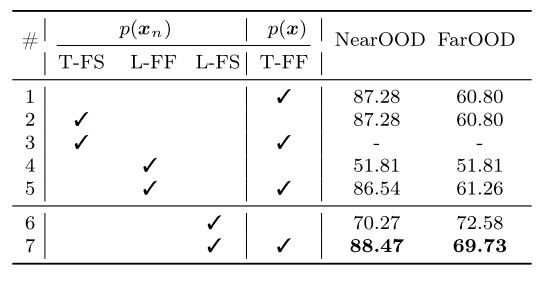
T/L: top/low-layer feature
FS: feature statistics
FF: flattened features
T-FF만 사용한 exp 1이 이미 MDS (Mean - Near-OOD: 69.76 on DIGITS)를 넘엇음
exp 3 같은 경우, LeNet-5를 사용하는데, final-layer feature가 그들의 feature statistics와 동일하다. 그러므로, 이 top-layer feature statistics면 모든 게 cancelled out된다 (SEM = log 1), T-FS와 T-FF와 동일하다는 얘기.. -> 그래서 exp 1과 exp 2 결과가 같음
exp4와 exp6은 L-FF와 L-FS를 비교했는데, 그냥 low-layer에서 가져온 feature를 사용하면 covariate shift와 강한 correlation을 가지게 된다는 것을 보여준다. 즉, covariate shift로 OOD detection을 하려는 성향이 강해진다.
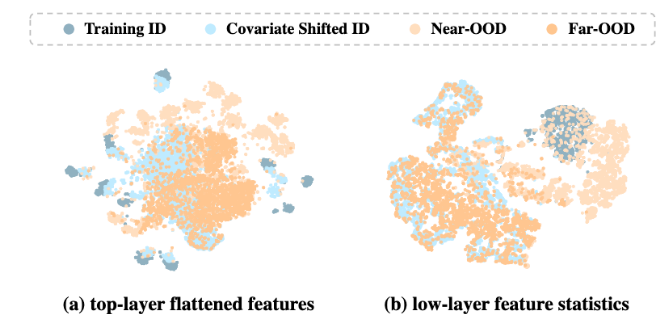
(a) T-FF, (b) L-FS를 t-SNE를 통햬 2차원에서 보면 L-FS에서는 covariate shift가 있는 ID끼리 OOD끼리 분리하는 걸 수 있고, semantic 정보를 더 담고 있는 T-FF를 보면 Traning ID와 Covariate shifted ID를 묶어서 보려는 성향이 있음을 확인할 수 있음
Fine-Tuning Scheme
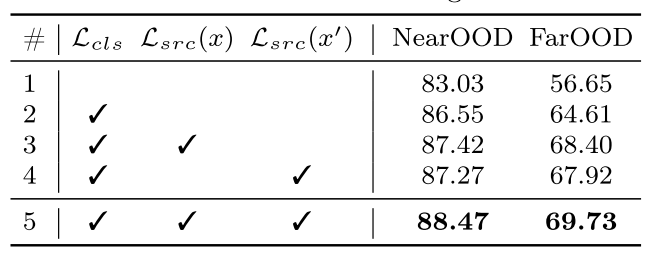
exp1은 fine-tuning 이전에 performance를 뜻함
는 negative augmented data 없이 fine-tuning한 걸 의미하고, 는 negative augmented data만 사용된 것. 결국 모두 사용했을 때 성능이 좋더라
source-awareness를 향상시키는 loss 는 ID training date를 결합하는 동시에 생성된 negative augmented image로부터 분리한다.
! 사용한 것보다 크게 좋아지진 않았다.
! 는 뒤의 마이너스 텀을 이야기하는 것 같은데, 없으면 그냥 -인데 normal dist의 합이 -로 가도록 하는 건 어떤 의미인가
Hyperparameter of
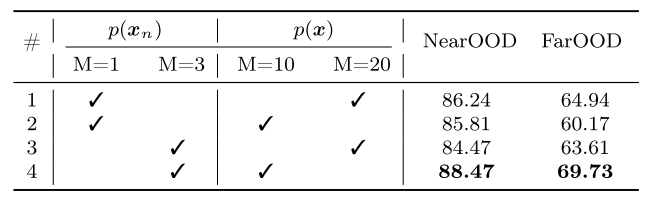
한테는 , 에는 으로 해서 GMM한 게 제일 좋더라
! exp 2는 p(x)의 M이 10으로 줄면서 성능이 저하됐는데, exp 4는 p(x)의 M이 10으로 줄면서 성능이 올라감..
! p(x_n)의 M이 충분하면 p(x)에 대한 M이 늘어나는 건 오히려 성능저하가 일어난다? 반대로 p(x)에 대한 M이 충분하면 p(x_n)에 대한 M이 늘어나는 것도 성능저하가 일어나는 듯함
Conclusion
- 기존 연구들은 covariate shift로 semantic shift를 구분하려고 함에도 불구하고 covariate shift에 굉장히 의존했다.
- near-OOD data에 대해 covariate-shifted ID를 사용했을때, 굉장히 성능이 안 나오는 것을 확인하면서 실험적으로 입증했다.
- ID이지만, covariate shift가 있는 것을 기존 OOD detection 벤치마크에서 제외했었다는 결함이 있었음을 발견하였고, 이는 훈련 분포를 넘어 일반화할 수 있어야한다는 머신러닝의 궁극적인 목표와 개념적으로 반대되는 것
- 이런 gap을 채우기 위해 covariate shifted ID를 고려한 FS-OOD를 제안하는 것임
- 이 FS-OOD scenario를 통해 기존의 SOTA 방법들이 굉장히 covariate shift에 의존한다는 것을 실험적으로 입증했고
- 제안하는 SEM score function은 간단한 디자인에도 불구하고 좀 더 reliable한 성능을 제공할 수 있었음
- 기존의 OOD 셋팅에선 low-layer에서 추출한 feature statistics를 사용한 간단한 확률모델로 거의 완벽에 가까운 성능을 낼 수 있다는 것을 보임으로 결함이 있음을 보임
- 기존 OOD benchmark에서 성능 saturation이 오면서 좀 더 realistic한 OOD benchmark를 다른 연구들에서 만들려고 하지만, 여전히 MNIST/CIFAR-scale이고 현재 OOD 방법들은 generatilzation 능력이 요구되면 만족할만한 결과가 나오지 않는다.