Gasida-서종호님과악분일상-최성욱님Jerry-이정훈님의 노고에 다시한번 🙇 감사드립니다.
📌 Review
4주차는 EKS Observability에 대해서 스터디 하였습니다.
PKOS에서는 [pkos] 쿠버네티스 스터디 - 5주차 스터디에서는 메트릭 지표와 프로메테우스, 그라파나에 대해서만 다루었지만 이번 스터디에서는 EKS의 구성요소, Console에서 확인하는 방법, Cloud Watch 그룹과의 연동등 AWS와 쿠버네티스가 결합되는 내용을 더하여 스터디하였습니다.
EKS에서 안정적으로 쿠버네티스의 지표를 수집하는 방법부터 수집된 지표를 모니터링 하는 실습을 직접 수행하며 인프라 업무에 적용할 수 있었습니다.

🎤 Speech
4주차는 한상효님, 최치영님, 김진웅님의 경험 및 기술 공유를 발표하셨습니다.
한상효님은 EKS에서 Nosql을 직접 배포하고 운영하며 경험한 내용을 주제로 공유해주셨습니다. Nosql을 비롯한 DB를 managed 및 EC2가 아닌, K8S로 구성하여 운영하며 느낀 세세한 경험을 공유해주셔서 한번 도입해보고 싶다는 생각을 했습니다.
최치영님은 EKS POD에서 계정간 S3로 업로드하는 예시를 핸즈온처럼 알려 주셨습니다. 특히 CoreDNS와 SA, IAM에 대해서 자세하게 설명해주셔서 보다 쉽게 이해할 수 있었습니다.
김진웅님은 Spring Observability라는 주제를 가지고 경험 공유를 해주셨습니다. 특히 현재 근무중인 회사에서 -Mxs, -Mxm등 메모리 관련 문제를 해결하고자하는 와중에 좋은 내용을 알려주셔서 [컨테이너 환경에서 Java Heap Memory 관리]에 대해서 정리하며 인프라에 실제로 적용해보기도 하였습니다.
세분 모두에게 다시한번 감사드립니다.
📌 Summary
-
쿠버네티스 Observability에 대해 이해합니다.
-
Metric-server에 대해서 이해하며kwatch또는botkube를 통해 지표를 Slack으로 전달해봅니다. -
Prometheus와Grafana를 조합하여 오픈소스 모니터링 인프라를 구축할 수 있습니다.
📌 Study
👉 Step 00. 실습 환경 배포
이번주차에서는 oneclick.yaml을 통해 배포하였으며, kube-ops-view를 이용하여 파드 및 서비스가 배포되는 것을 UI를 통해 확인하였습니다.
👉 Step 01. EKS Console
쿠버네티스 API를 통해서 리소스 및 정보를 확인 할 수 있습니다.
kubectl get ClusterRole | grep eks
eks:addon-manager                                     2023-05-08T04:22:45Z
eks:az-poller                                         2023-05-08T04:22:42Z
eks:certificate-controller-approver                   2023-05-08T04:22:42Z
...
Console
AWS 콘솔에서도 EKS에 대한 내용을 확인할 수 있습니다.
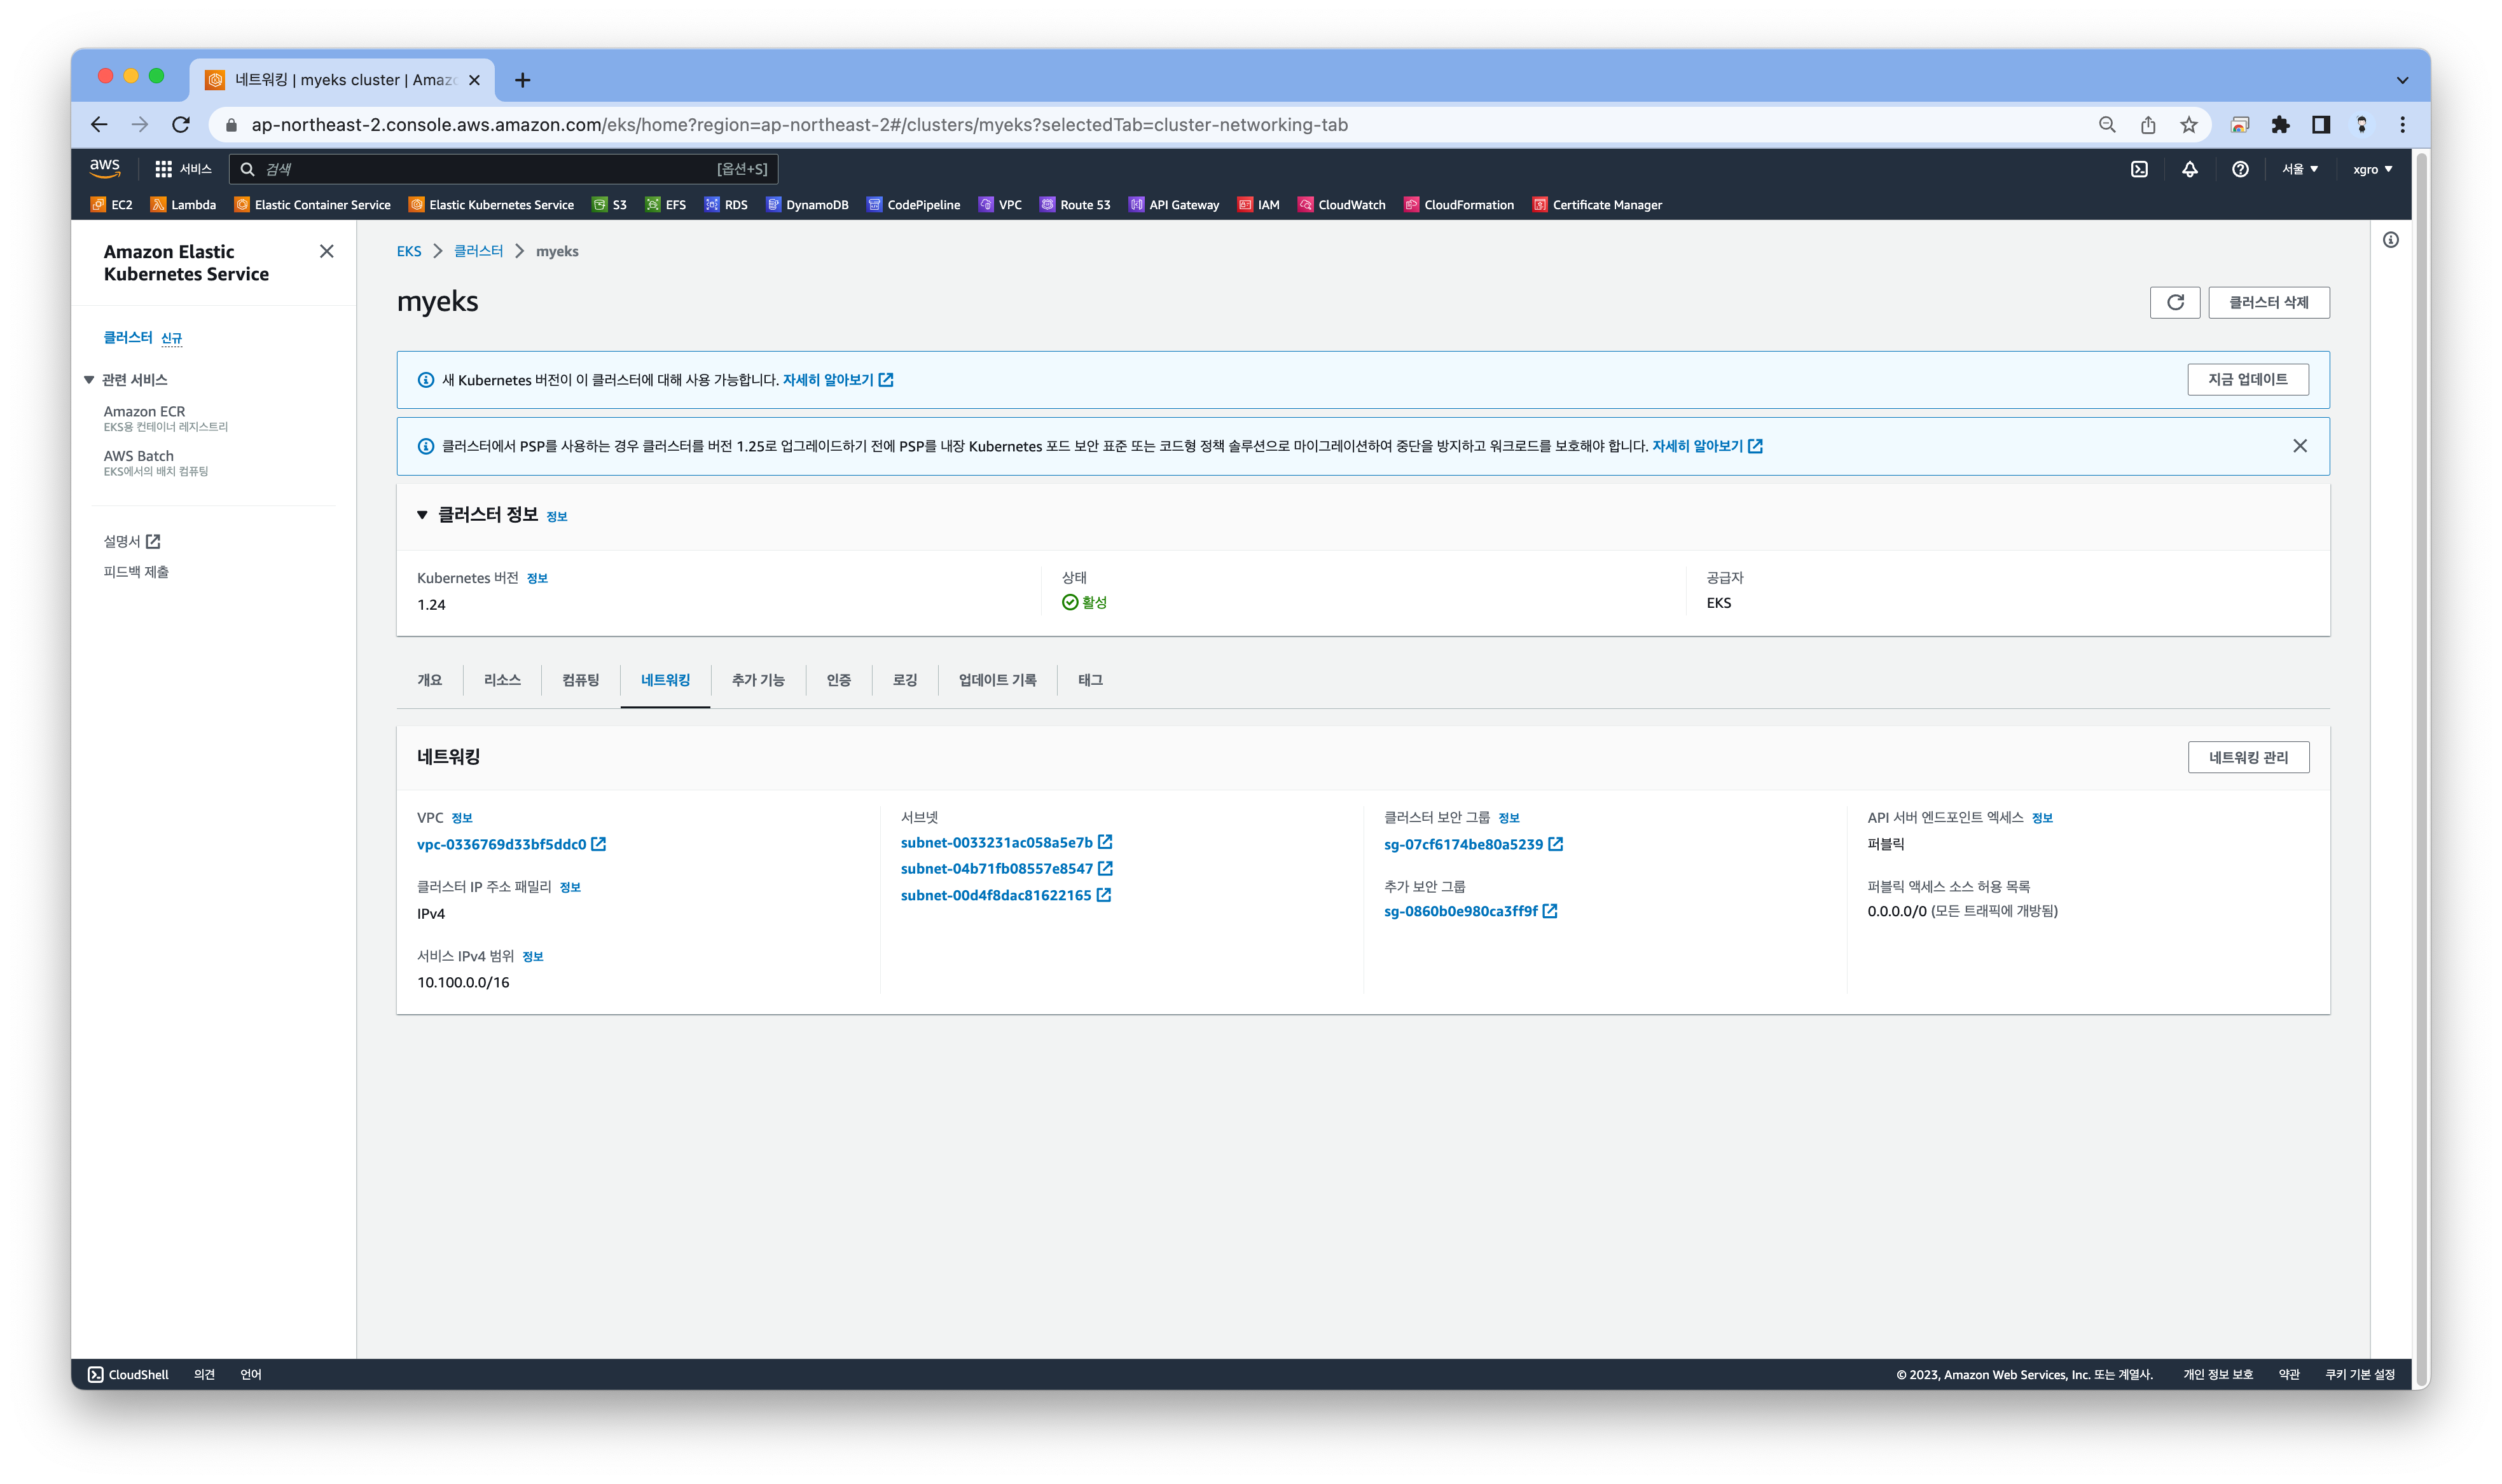
컴퓨팅 리소스부터 애드온 설치 내용까지 상세하게 확인할 수 있습니다.

Console 각 메뉴 확인 : 워크숍 링크 활용
- Workloads : Pods, ReplicaSets, Deployments, and DaemonSets
- Pods : 네임스페이스 필터, 구조화된 보기 structured view vs 원시 보기 raw view
- Cluster : Nodes, Namespaces and API Services
- Nodes : 노드 상태 및 정보, Taints, Conditions, Labels, Annotations 등
- Service and Networking : Pods as Service, Endpoints and Ingresses
- Service : 서비스 정보, 로드 밸런서(CLB/NLB) URL 정보 등
- Config and Secrets : ConfigMap and Secrets
- ConfigMap & Secrets : 정보 확인, 디코드 Decode 지원
- Storage : PVC, PV, Storage Classes, Volume Attachments, CSI Drivers, CSI Nodes
- PVC : 볼륨 정보, 주석, 이벤트
- Volume Attachments : PVC가 연결된 CSI Node 정보
- Authentication : Service Account
- Service Account : IAM 역할 arn , add-on 연동
- Authorization : Cluster Roles, Roles, ClusterRoleBindings and RoleBindings
- Cluster Roles & Roles : Roles 에 규칙 확인
- Policy : Limit Ranges, Resource Quotas, Network Policies, Pod Disruption Budgets, Pod Security Policies
- Pod Security Policies : (기본값) eks.privileged 정보 확인
- Extensions : Custom Resource Definitions, Mutating Webhook Configurations, and Validating Webhook Configurations
- CRD 및 Webhook 확인

👉 Step 02. Logging in EKS
Control Plane logging
컨트롤 플레인의 로깅을 활성화 합니다.# 모든 로깅 활성화 aws eks update-cluster-config --region $AWS_DEFAULT_REGION --name $CLUSTER_NAME \ --logging '{"clusterLogging":[{"types":["api","audit","authenticator","controllerManager","scheduler"],"enabled":true}]}' # 로그 그룹 확인 aws logs describe-log-groups | jq # 로그 tail 확인 : aws logs tail help aws logs tail /aws/eks/$CLUSTER_NAME/cluster | more # 신규 로그를 바로 출력 aws logs tail /aws/eks/$CLUSTER_NAME/cluster --follow # 필터 패턴 aws logs tail /aws/eks/$CLUSTER_NAME/cluster --filter-pattern <필터 패턴> # 로그 스트림이름 aws logs tail /aws/eks/$CLUSTER_NAME/cluster --log-stream-name-prefix <로그 스트림 prefix> --follow aws logs tail /aws/eks/$CLUSTER_NAME/cluster --log-stream-name-prefix kube-controller-manager --follow kubectl scale deployment -n kube-system coredns --replicas=1 kubectl scale deployment -n kube-system coredns --replicas=2 # 시간 지정: 1초(s) 1분(m) 1시간(h) 하루(d) 한주(w) aws logs tail /aws/eks/$CLUSTER_NAME/cluster --since 1h30m # 짧게 출력 aws logs tail /aws/eks/$CLUSTER_NAME/cluster --since 1h30m --format short
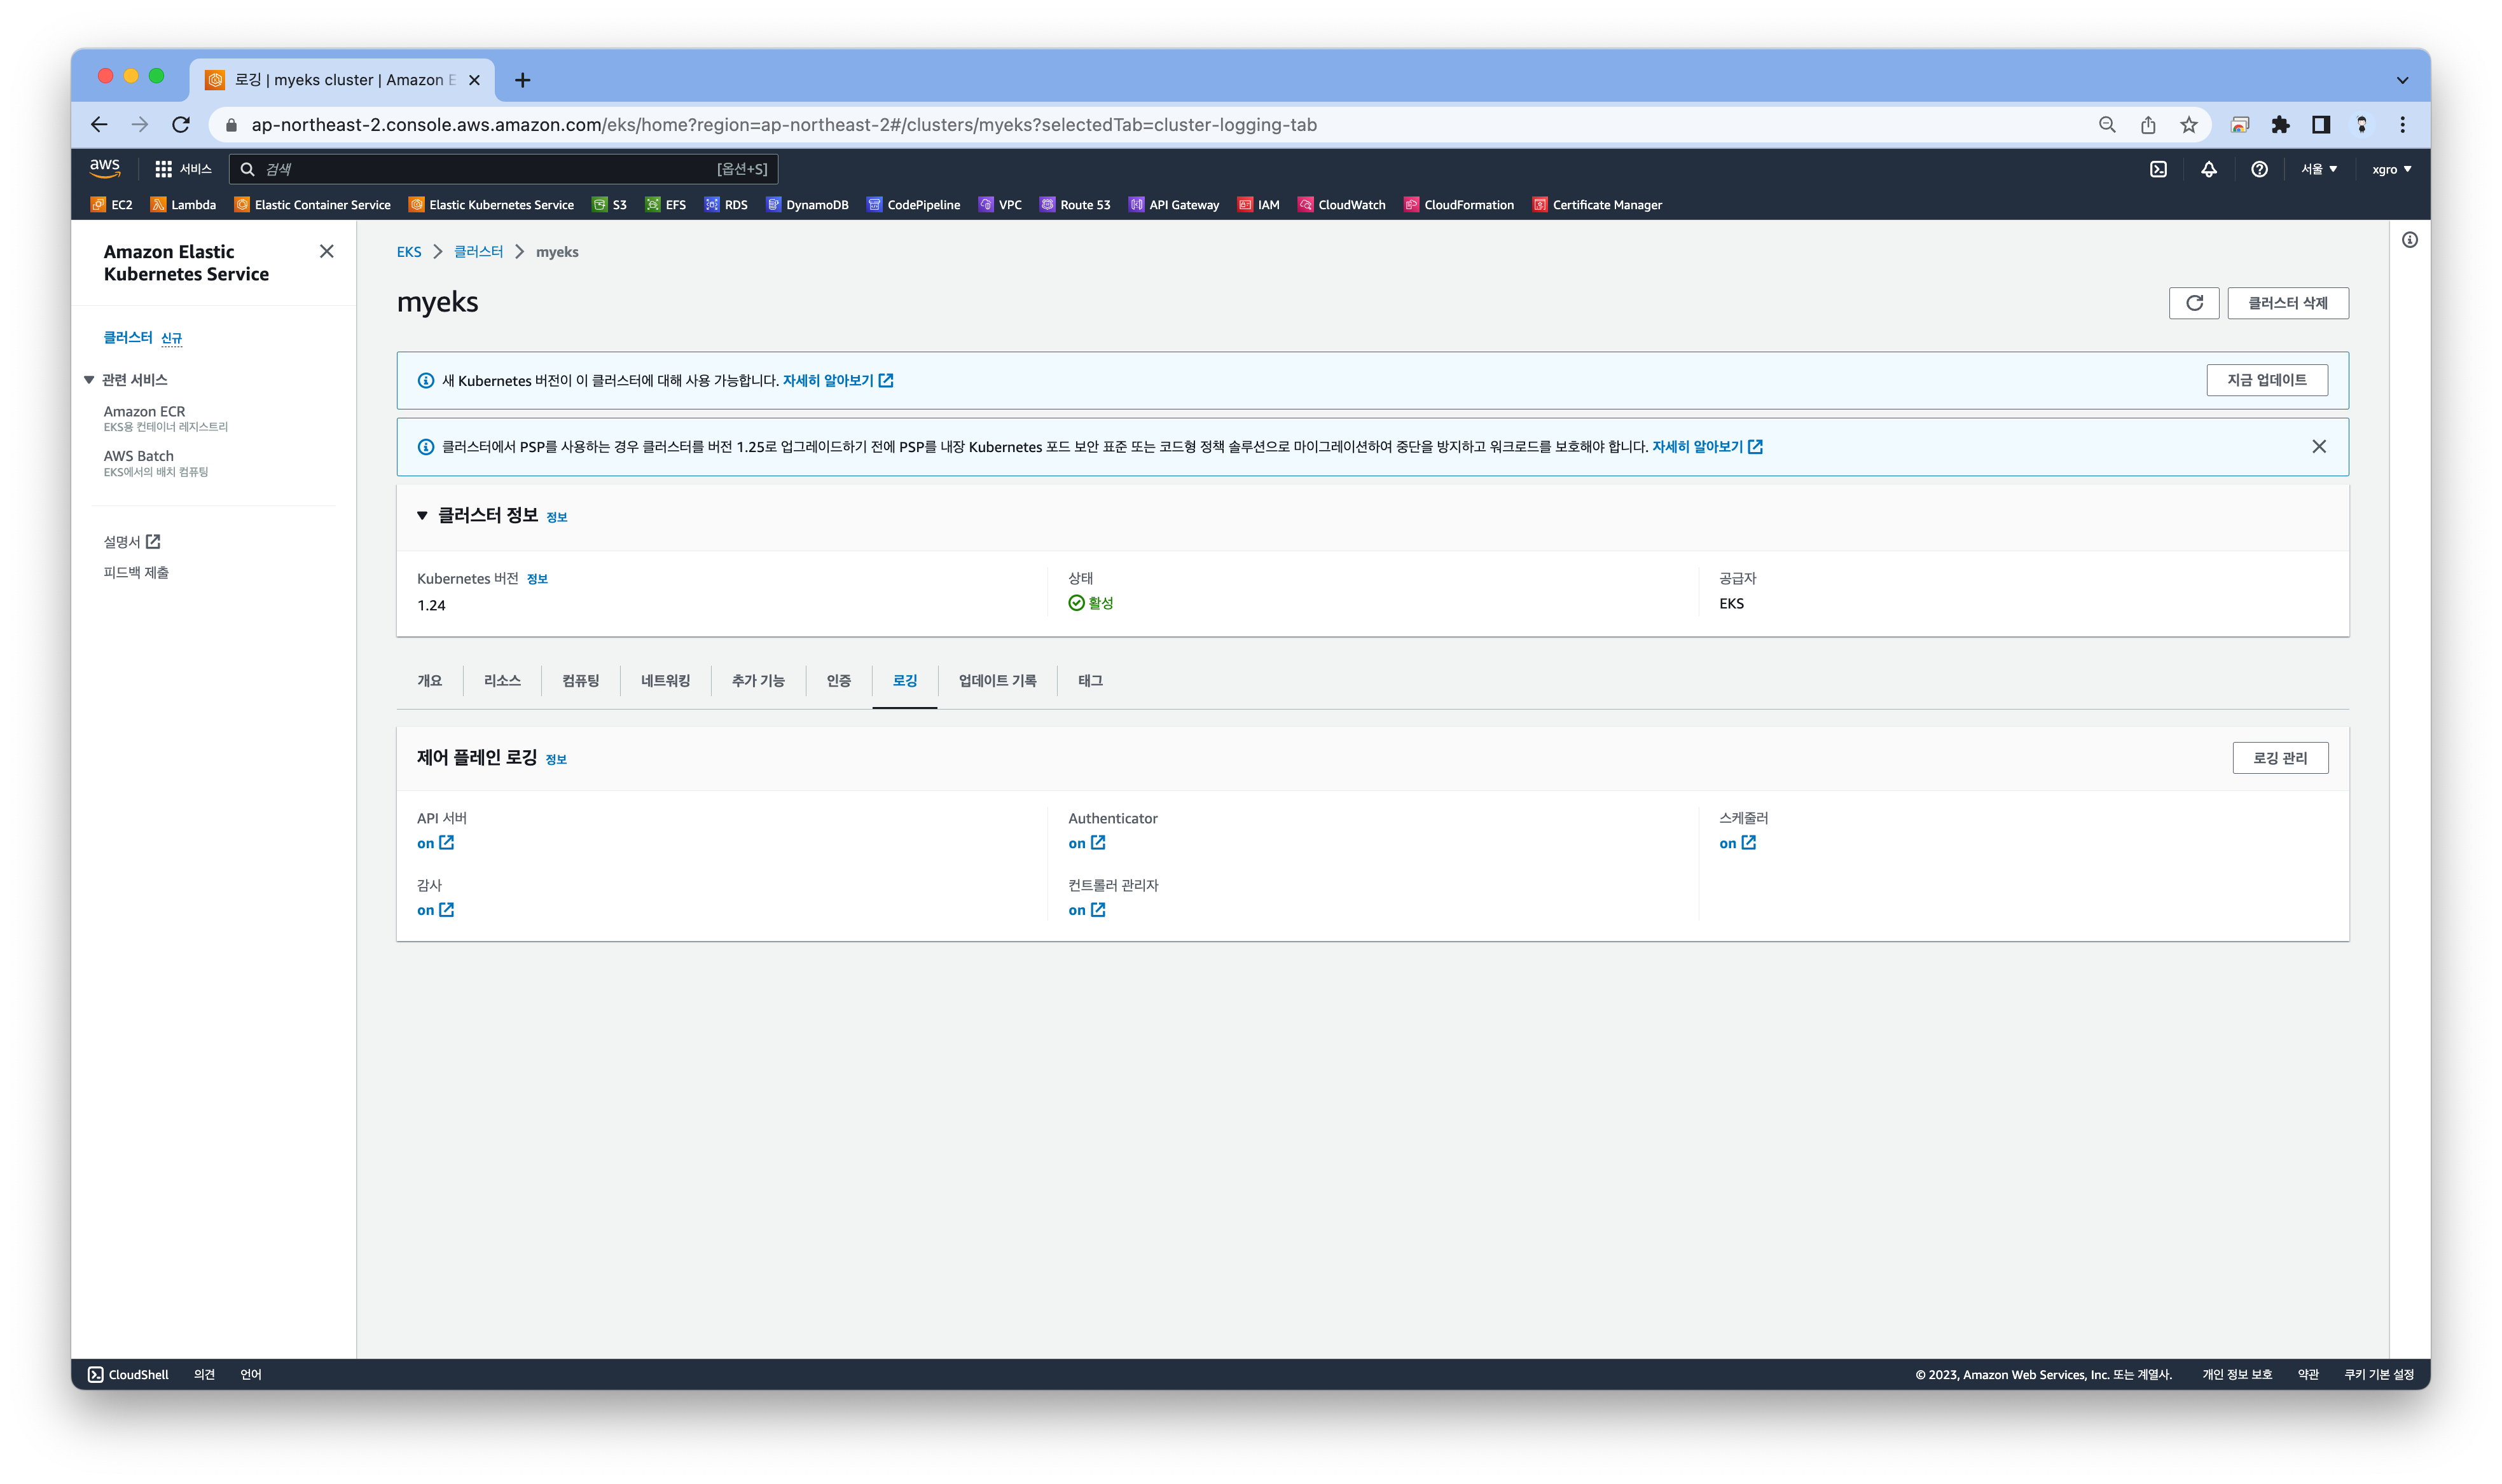
✅ 콘솔에서도 로깅이 활성화 된 것을 확인할 수 있습니다.
CloudWatch Log Insights
클라우드워치의 로그인사이트를 이용하여 로그를 검색합니다.# EC2 Instance가 NodeNotReady 상태인 로그 검색 fields @timestamp, @message | filter @message like /NodeNotReady/ | sort @timestamp desc # kube-apiserver-audit 로그에서 userAgent 정렬해서 아래 4개 필드 정보 검색 fields userAgent, requestURI, @timestamp, @message | filter @logStream ~= "kube-apiserver-audit" | stats count(userAgent) as count by userAgent | sort count desc # fields @timestamp, @message | filter @logStream ~= "kube-scheduler" | sort @timestamp desc # fields @timestamp, @message | filter @logStream ~= "authenticator" | sort @timestamp desc # fields @timestamp, @message | filter @logStream ~= "kube-controller-manager" | sort @timestamp desc
CloudWatch Log Insight Query with AWS CLI
로그 인사이트를 AWS CLI로도 확인할 수 있습니다.
# CloudWatch Log Insight Query
aws logs get-query-results --query-id $(aws logs start-query \
--log-group-name '/aws/eks/myeks/cluster' \
--start-time `date -d "-1 hours" +%s` \
--end-time `date +%s` \
--query-string 'fields @timestamp, @message | filter @logStream ~= "kube-scheduler" | sort @timestamp desc' \
| jq --raw-output '.queryId')

컨테이너(파드) 로깅
nginx 웹서버를 배포하고 로깅을 확인합니다.
- 컨테이너 로그 환경의 로그는 표준 출력 stdout과 표준 에러 stderr로 보내는 것을 권고하고 있습니다 - 링크
해당 권고에 따라 작성된 컨테이너 애플리케이션의 로그는 해당 파드 안으로 접속하지 않아도 사용자는 외부에서 kubectl logs 명령어로 애플리케이션 종류에 상관없이 애플리케이션마다 로그 파일 위치에 상관없이, 단일 명령어로 조회 가능합니다.
종료된 파드의 로그는 kubectl logs로 조회 할 수 없습니다
kubelet 기본 설정은 로그 파일의 최대 크기가 10Mi로 10Mi를 초과하는 로그는 전체 로그 조회가 불가능합니다.

👉 Step 03. Container Insights metrics in Amazon CloudWatch & Fluent Bit (Logs)
Fluent Bit
[수집] 플루언트비트 Fluent Bit 컨테이너를 데몬셋으로 동작시키고, 아래 3가지 종류의 로그를 CloudWatch Logs 에 전송합니다.
- /aws/containerinsights/
Cluster_Name/application : 로그 소스(All log files in/var/log/containers), 각 컨테이너/파드 로그- /aws/containerinsights/
Cluster_Name/host : 로그 소스(Logs from/var/log/dmesg,/var/log/secure, and/var/log/messages), 노드(호스트) 로그- /aws/containerinsights/
Cluster_Name/dataplane : 로그 소스(/var/log/journalforkubelet.service,kubeproxy.service, anddocker.service), 쿠버네티스 데이터플레인 로그[저장] : CloudWatch Logs 에 로그를 저장, 로그 그룹 별 로그 보존 기간을 설정할 수 있습니다.
[시각화] : CloudWatch 의 Logs Insights 를 사용하여 대상 로그를 분석하고, CloudWatch 의 대시보드로 시각화합니다.
(참고) Fluent Bit is a lightweight log processor and forwarder that allows you to collect data and logs from different sources, enrich them with filters and send them to multiple destinations like CloudWatch, Kinesis Data Firehose, Kinesis Data Streams and Amazon OpenSearch Service.
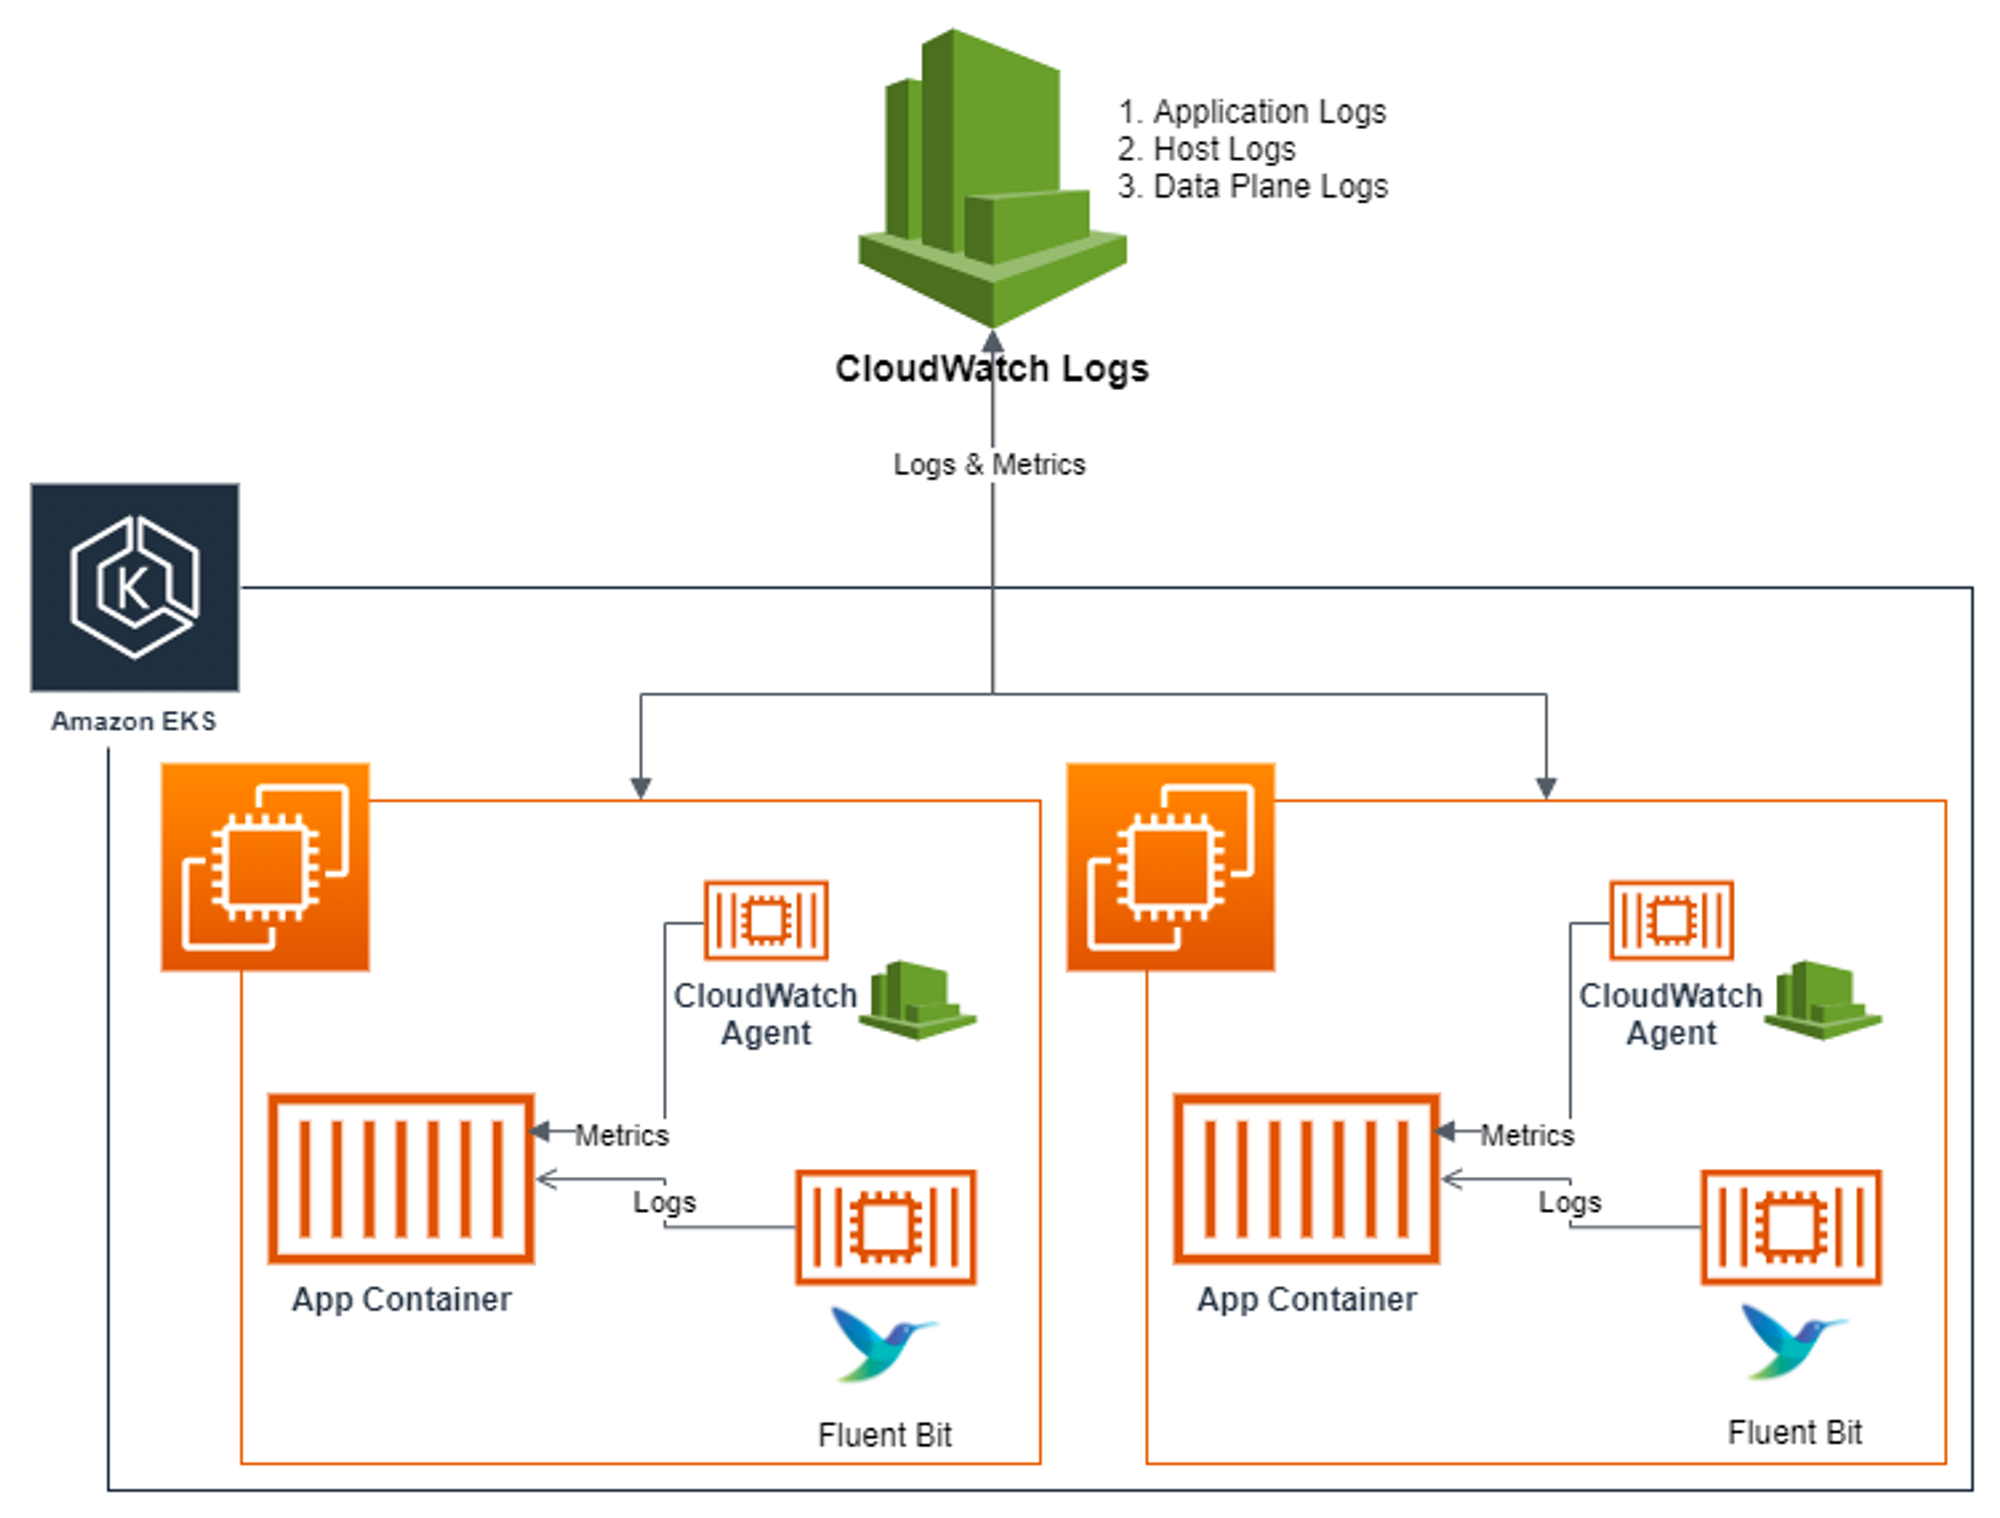
CloudWatch Container Insight
노드에
CW Agent Pod와Fluent Bit Pod가 데몬셋으로 배치되어 Metrics 와 Logs 수집합니다.
소개: collect, aggregate, and summarize metrics and logs from your containerized applications and microservices - 링크 Docs
- CloudWatch Container Insight는 컨테이너형 애플리케이션 및 마이크로 서비스에 대한 모니터링, 트러블 슈팅 및 알람을 위한 완전 관리형 관측 서비스입니다.
- CloudWatch 콘솔에서 자동화된 대시보드를 통해 container metrics, Prometeus metrics, application logs 및 performance log events를 탐색, 분석 및 시각화할 수 있습니다.
- CloudWatch Container Insight는 CPU, 메모리, 디스크 및 네트워크와 같은 인프라 메트릭을 자동으로 수집합니다.
- EKS 클러스터의 crashloop backoffs와 같은 진단 정보를 제공하여 문제를 격리하고 신속하게 해결할 수 있도록 지원합니다.
- 이러한 대시보드는 Amazon ECS, Amazon EKS, AWS ECS Fargate 그리고 EC2 위에 구동되는 k8s 클러스터에서 사용 가능합니다.
노드의 로그 확인
- application 로그 소스(All log files in
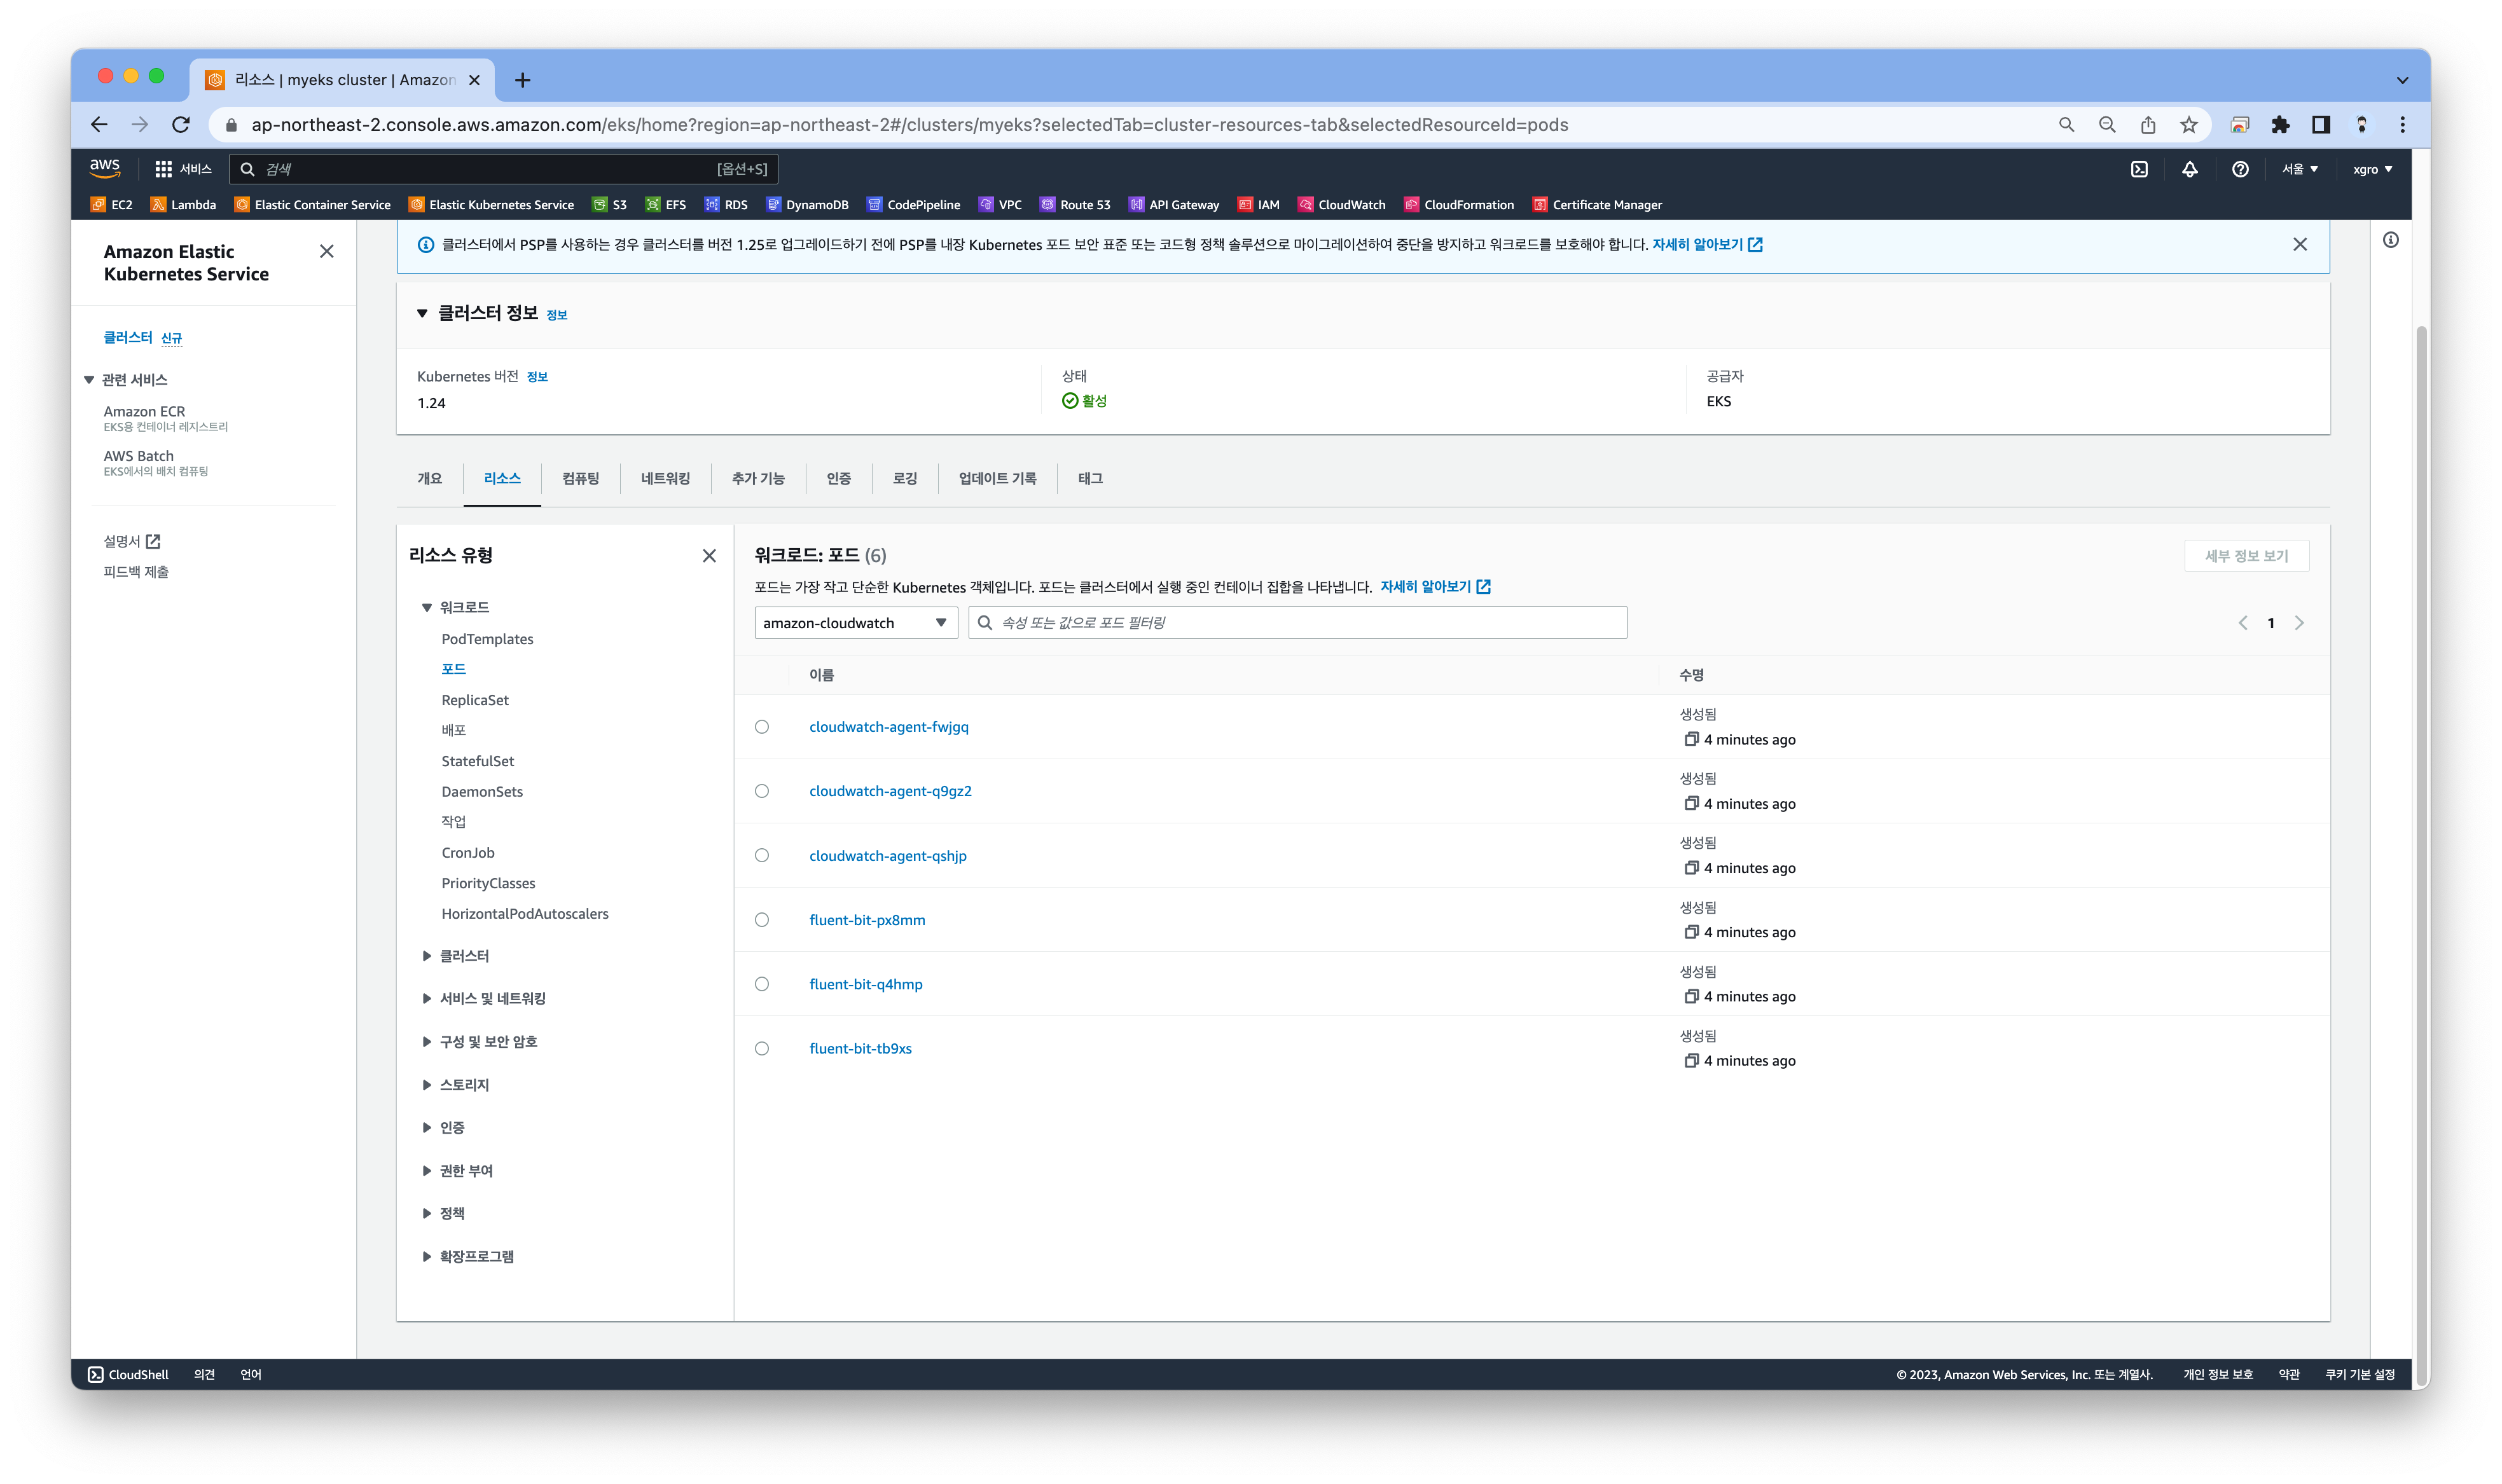
/var/log/containers→ 심볼릭 링크/var/log/pods/<컨테이너>, 각 컨테이너/파드 로그CloudWatch Container Insight 설치 : cloudwatch-agent & fluent-bit - 링크 & Setting up Fluent Bit
# 설치
FluentBitHttpServer='On'
FluentBitHttpPort='2020'
FluentBitReadFromHead='Off'
FluentBitReadFromTail='On'
curl -s https://raw.githubusercontent.com/aws-samples/amazon-cloudwatch-container-insights/latest/k8s-deployment-manifest-templates/deployment-mode/daemonset/container-insights-monitoring/quickstart/cwagent-fluent-bit-quickstart.yaml | sed 's/{{cluster_name}}/'${CLUSTER_NAME}'/;s/{{region_name}}/'${AWS_DEFAULT_REGION}'/;s/{{http_server_toggle}}/"'${FluentBitHttpServer}'"/;s/{{http_server_port}}/"'${FluentBitHttpPort}'"/;s/{{read_from_head}}/"'${FluentBitReadFromHead}'"/;s/{{read_from_tail}}/"'${FluentBitReadFromTail}'"/' | kubectl apply -f -

# 설치 확인
kubectl get-all -n amazon-cloudwatch
kubectl get ds,pod,cm,sa -n amazon-cloudwatch
kubectl describe clusterrole cloudwatch-agent-role fluent-bit-role                          # 클러스터롤 확인
kubectl describe clusterrolebindings cloudwatch-agent-role-binding fluent-bit-role-binding  # 클러스터롤 바인딩 확인
kubectl -n amazon-cloudwatch logs -l name=cloudwatch-agent -f # 파드 로그 확인
kubectl -n amazon-cloudwatch logs -l k8s-app=fluent-bit -f    # 파드 로그 확인
for node in $N1 $N2 $N3; do echo ">>>>> $node <<<<<"; ssh ec2-user@$node sudo ss -tnlp | grep fluent-bit; echo; done

# cloudwatch-agent 설정 확인
kubectl describe cm cwagentconfig -n amazon-cloudwatch
{
  "agent": {
    "region": "ap-northeast-2"
  },
  "logs": {
    "metrics_collected": {
      "kubernetes": {
        "cluster_name": "myeks",
        "metrics_collection_interval": 60
      }
    },
    "force_flush_interval": 5
  }
}

# CW 파드가 수집하는 방법 : Volumes에 HostPath를 살펴보자! >> / 호스트 패스 공유??? 보안상 안전한가? 좀 더 범위를 좁힐수는 없을까요?
kubectl describe -n amazon-cloudwatch ds cloudwatch-agent
...
ssh ec2-user@$N1 sudo tree /dev/disk
...

# Fluent Bit Cluster Info 확인
kubectl get cm -n amazon-cloudwatch fluent-bit-cluster-info -o yaml | yh
apiVersion: v1
data:
  cluster.name: myeks
  http.port: "2020"
  http.server: "On"
  logs.region: ap-northeast-2
  read.head: "Off"
  read.tail: "On"
kind: ConfigMap
...

# Fluent Bit 로그 INPUT/FILTER/OUTPUT 설정 확인 - 링크
## 설정 부분 구성 : application-log.conf , dataplane-log.conf , fluent-bit.conf , host-log.conf , parsers.conf
kubectl describe cm fluent-bit-config -n amazon-cloudwatch
...
application-log.conf:
----
[INPUT]
    Name                tail
    Tag                 application.*
    Exclude_Path        /var/log/containers/cloudwatch-agent*, /var/log/containers/fluent-bit*, /var/log/containers/aws-node*, /var/log/containers/kube-proxy*
    Path                /var/log/containers/*.log
    multiline.parser    docker, cri
    DB                  /var/fluent-bit/state/flb_container.db
    Mem_Buf_Limit       50MB
    Skip_Long_Lines     On
    Refresh_Interval    10
    Rotate_Wait         30
    storage.type        filesystem
    Read_from_Head      ${READ_FROM_HEAD}

[FILTER]
    Name                kubernetes
    Match               application.*
    Kube_URL            https://kubernetes.default.svc:443
    Kube_Tag_Prefix     application.var.log.containers.
    Merge_Log           On
    Merge_Log_Key       log_processed
    K8S-Logging.Parser  On
    K8S-Logging.Exclude Off
    Labels              Off
    Annotations         Off
    Use_Kubelet         On
    Kubelet_Port        10250
    Buffer_Size         0

[OUTPUT]
    Name                cloudwatch_logs
    Match               application.*
    region              ${AWS_REGION}
    log_group_name      /aws/containerinsights/${CLUSTER_NAME}/application
    log_stream_prefix   ${HOST_NAME}-
    auto_create_group   true
    extra_user_agent    container-insights
...

# Fluent Bit 파드가 수집하는 방법 : Volumes에 HostPath를 살펴보자!
kubectl describe -n amazon-cloudwatch ds fluent-bit
...
ssh ec2-user@$N1 sudo tree /var/log
...

# (참고) 삭제
curl -s https://raw.githubusercontent.com/aws-samples/amazon-cloudwatch-container-insights/latest/k8s-deployment-manifest-templates/deployment-mode/daemonset/container-insights-monitoring/quickstart/cwagent-fluent-bit-quickstart.yaml | sed 's/{{cluster_name}}/'${CLUSTER_NAME}'/;s/{{region_name}}/'${AWS_DEFAULT_REGION}'/;s/{{http_server_toggle}}/"'${FluentBitHttpServer}'"/;s/{{http_server_port}}/"'${FluentBitHttpPort}'"/;s/{{read_from_head}}/"'${FluentBitReadFromHead}'"/;s/{{read_from_tail}}/"'${FluentBitReadFromTail}'"/' | kubectl delete -f -
로깅 확인
CW → 로그 그룹

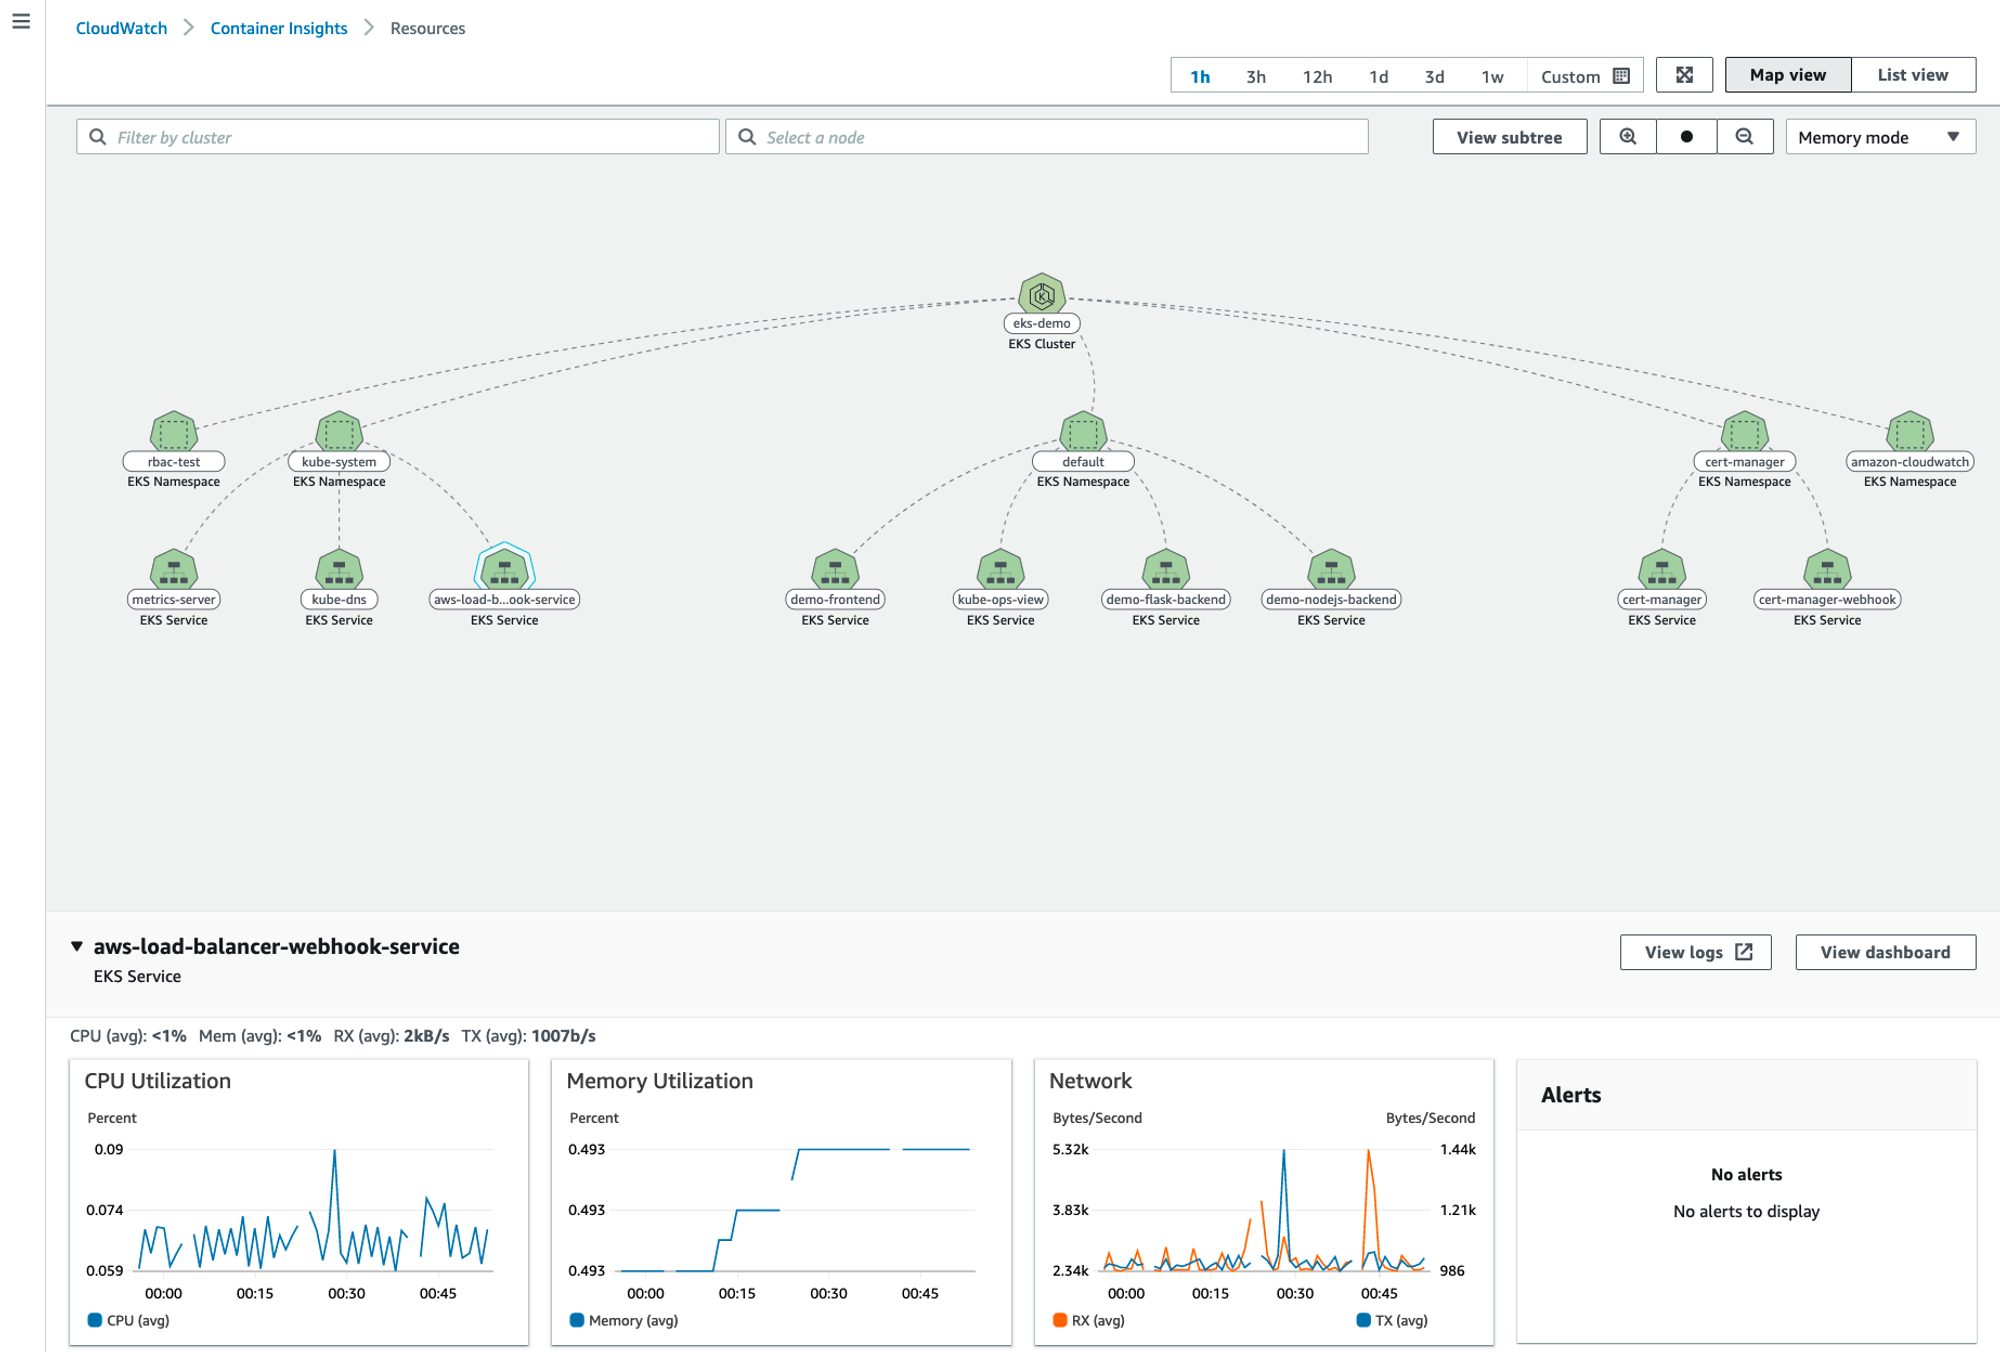
메트릭 확인
CW → 인사이트 → Container Insights
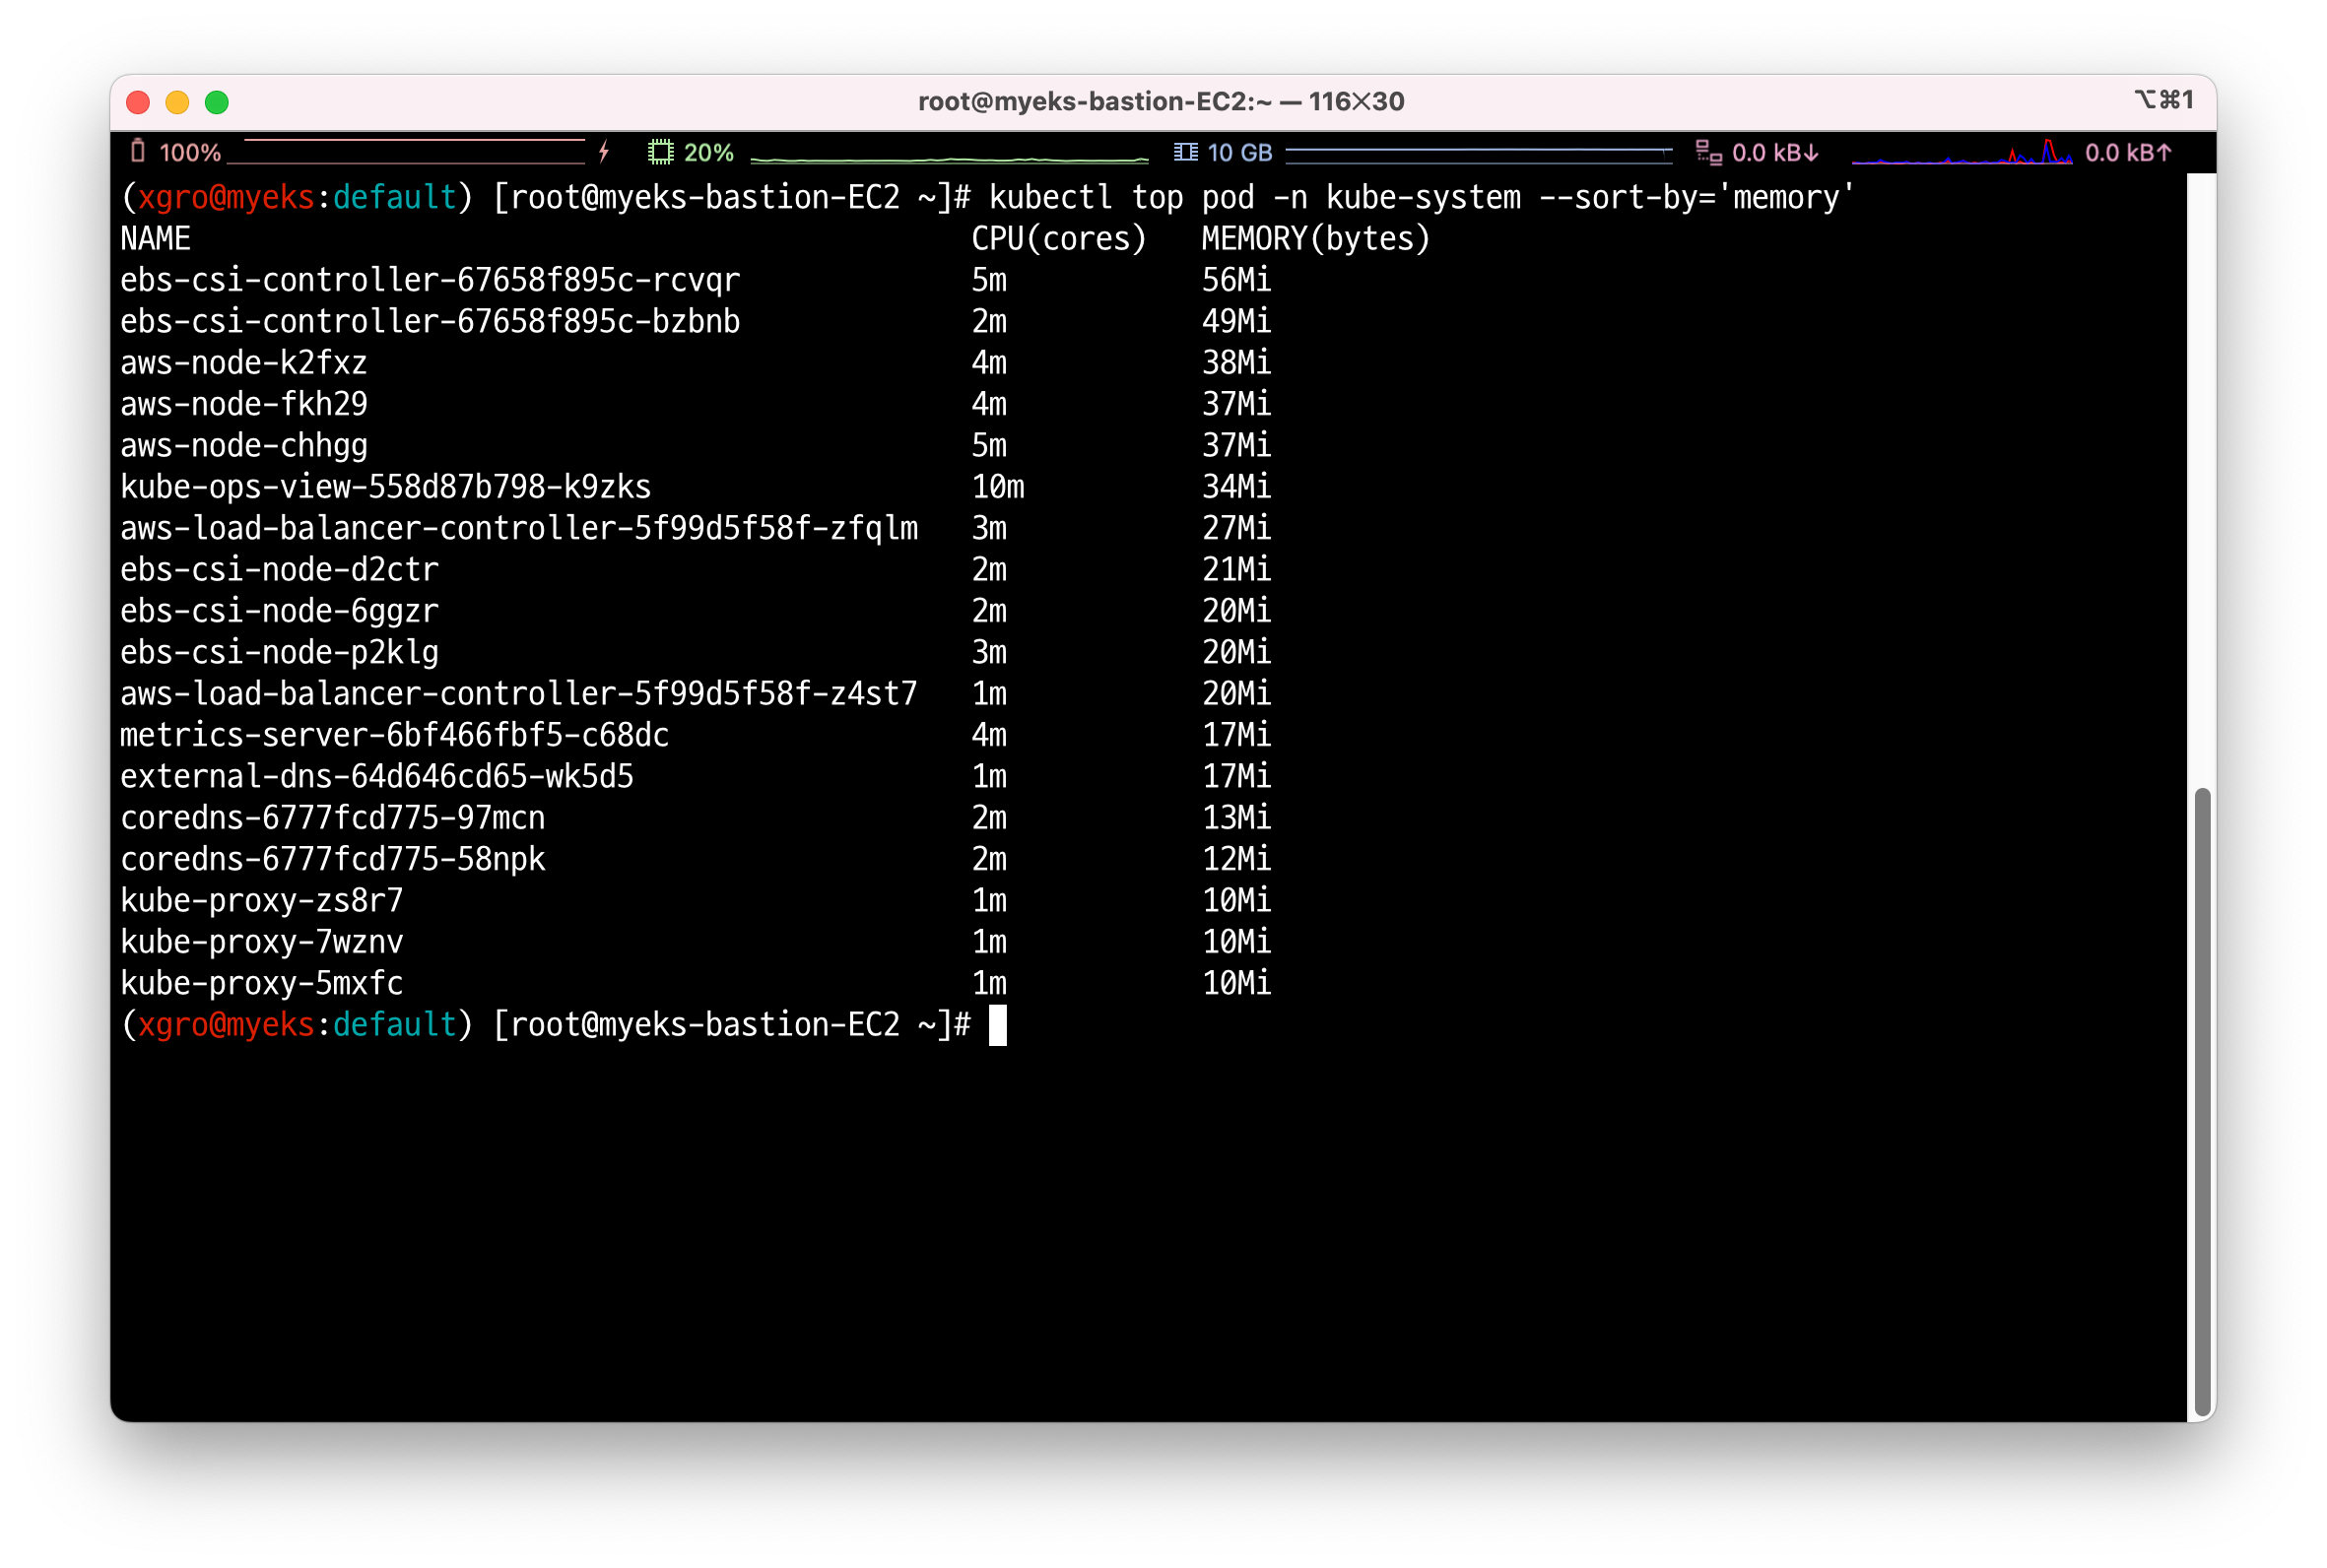
👉 Step 04. Metrics-server & kwatch & botkube
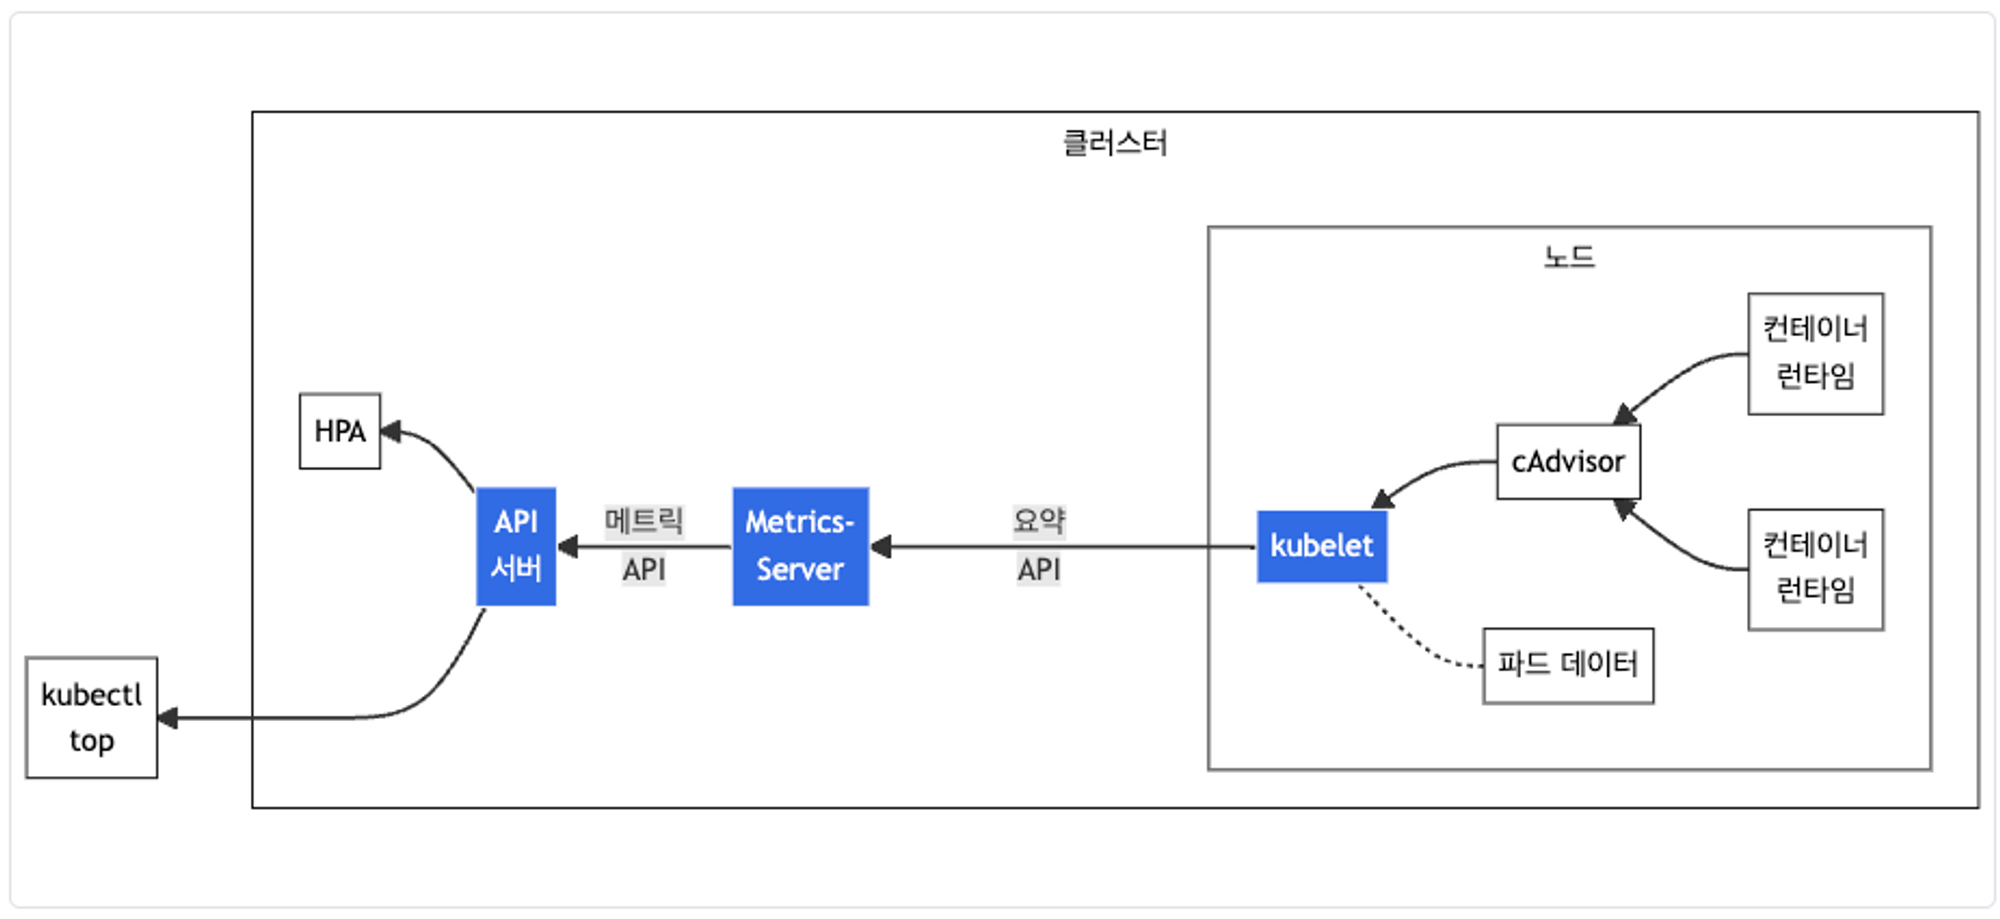
✅ Metrics-server
kubelet으로부터 수집한 리소스 메트릭을 수집 및 집계하는 클러스터 애드온 구성 요소입니다.
- cAdvisor : kubelet에 포함된 컨테이너 메트릭을 수집, 집계, 노출하는 데몬
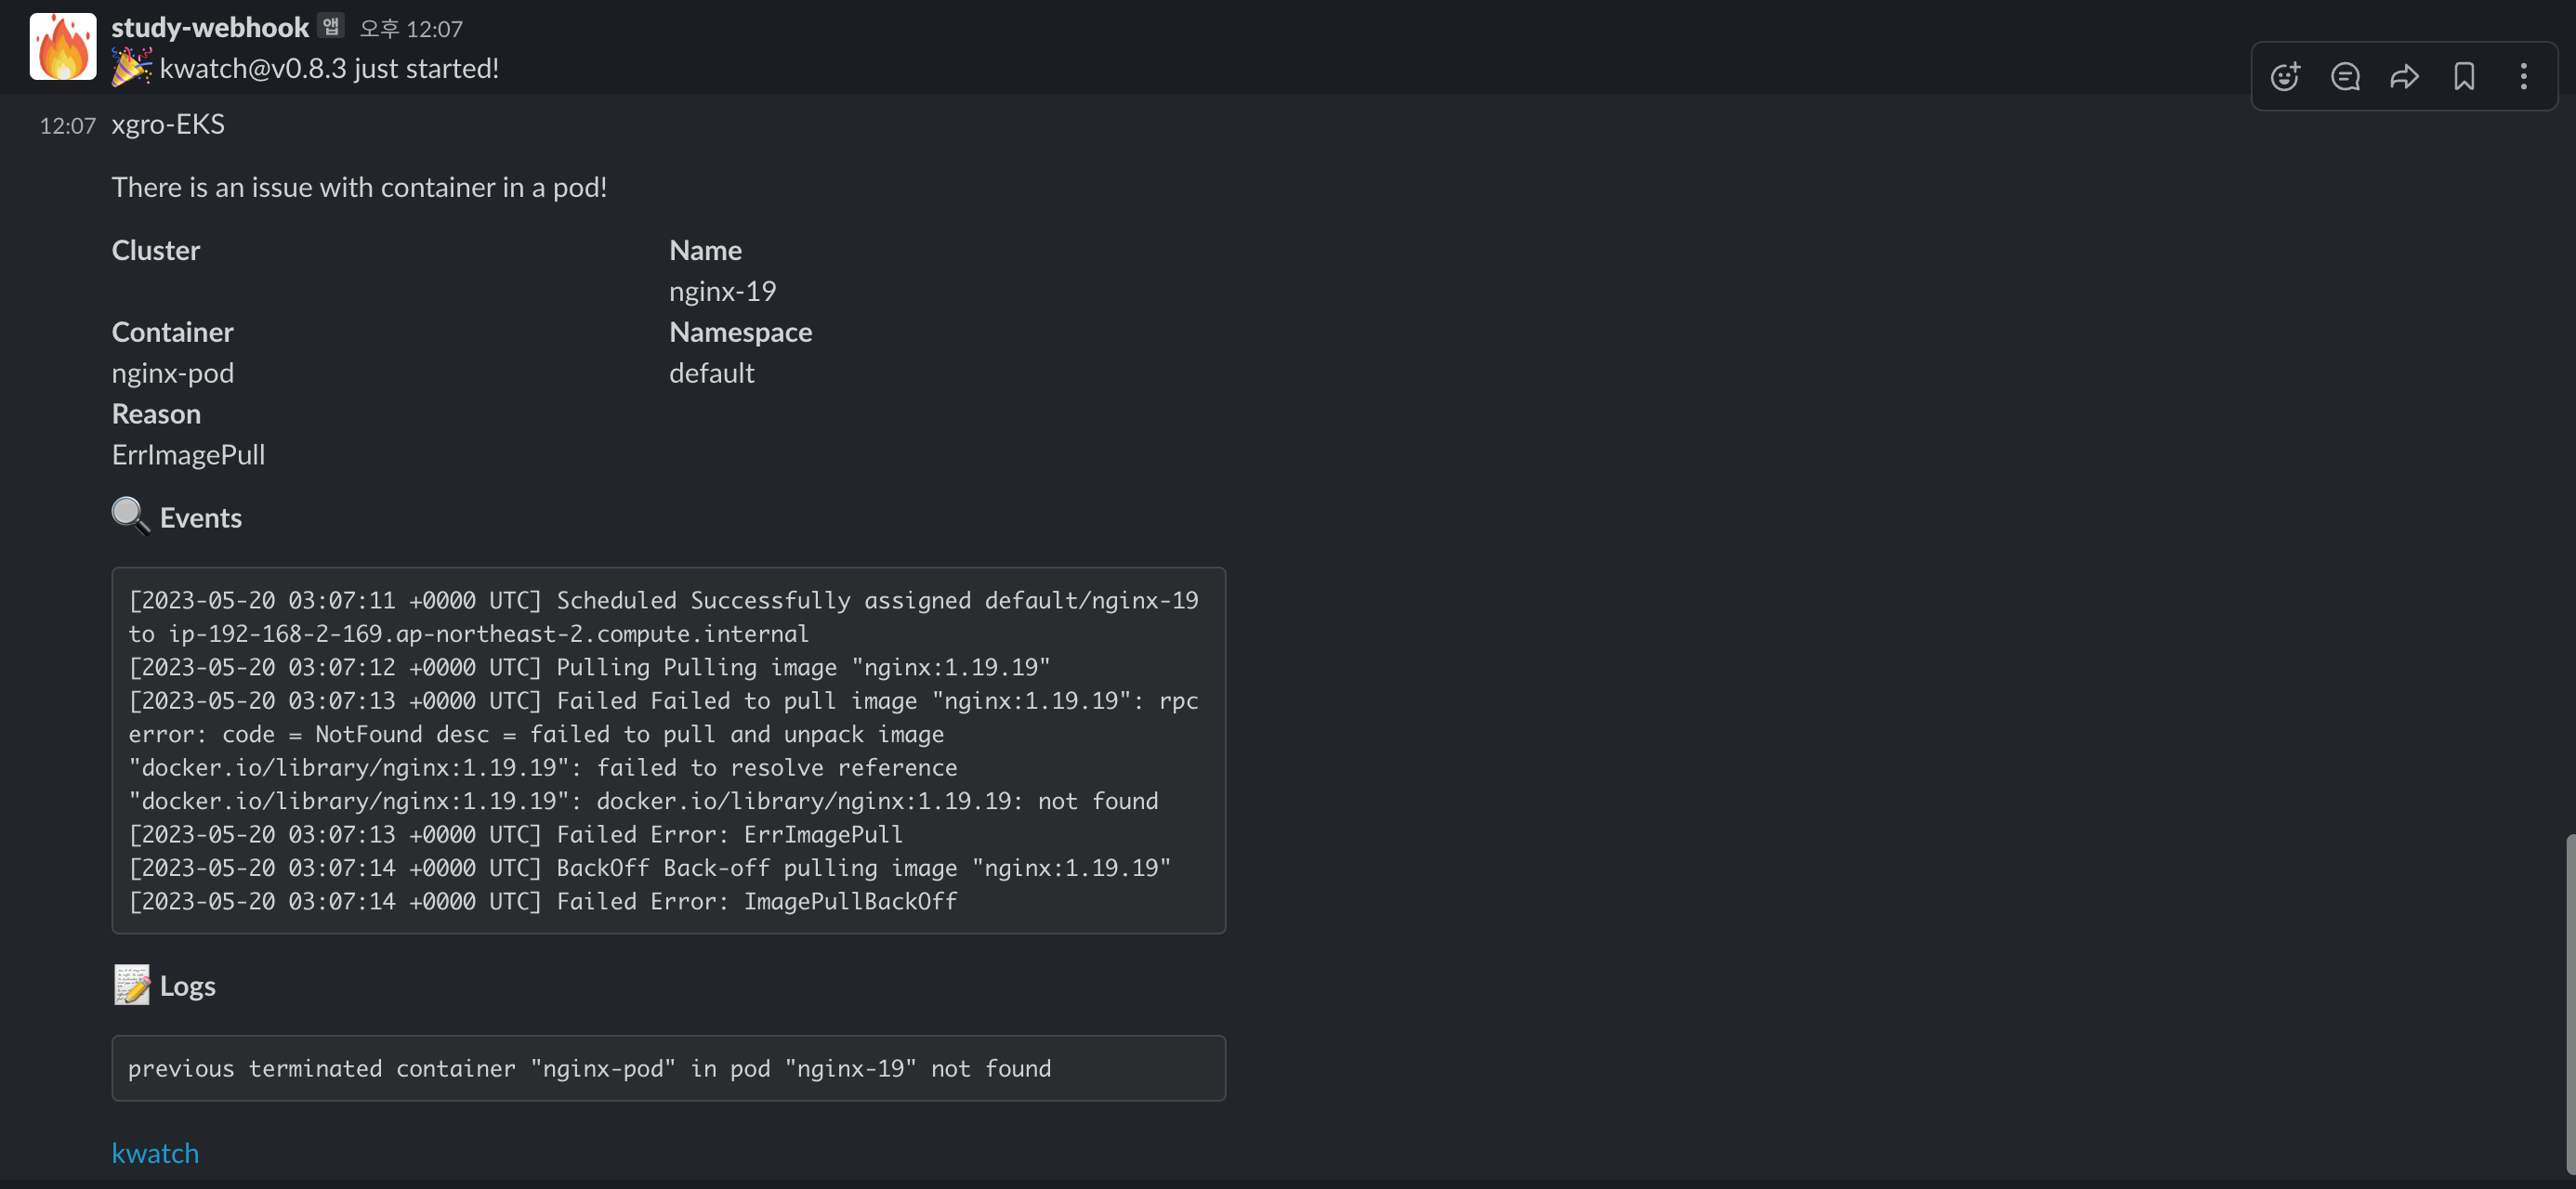
✅ kwatch
공식 문서
kwatch helps you monitor all changes in your Kubernetes(K8s) cluster, detects crashes in your running apps in realtime, and publishes notifications to your channels (Slack, Discord, etc.) instantlykwatch를 이용하여 지표의 상태나 알람을 Slack으로 손쉽게 전달할 수 있습니다.
Slack의 민감정보인 토큰이 공개될 우려가 있으므로 실습완료에 대한 내용만 게재하였습니다.
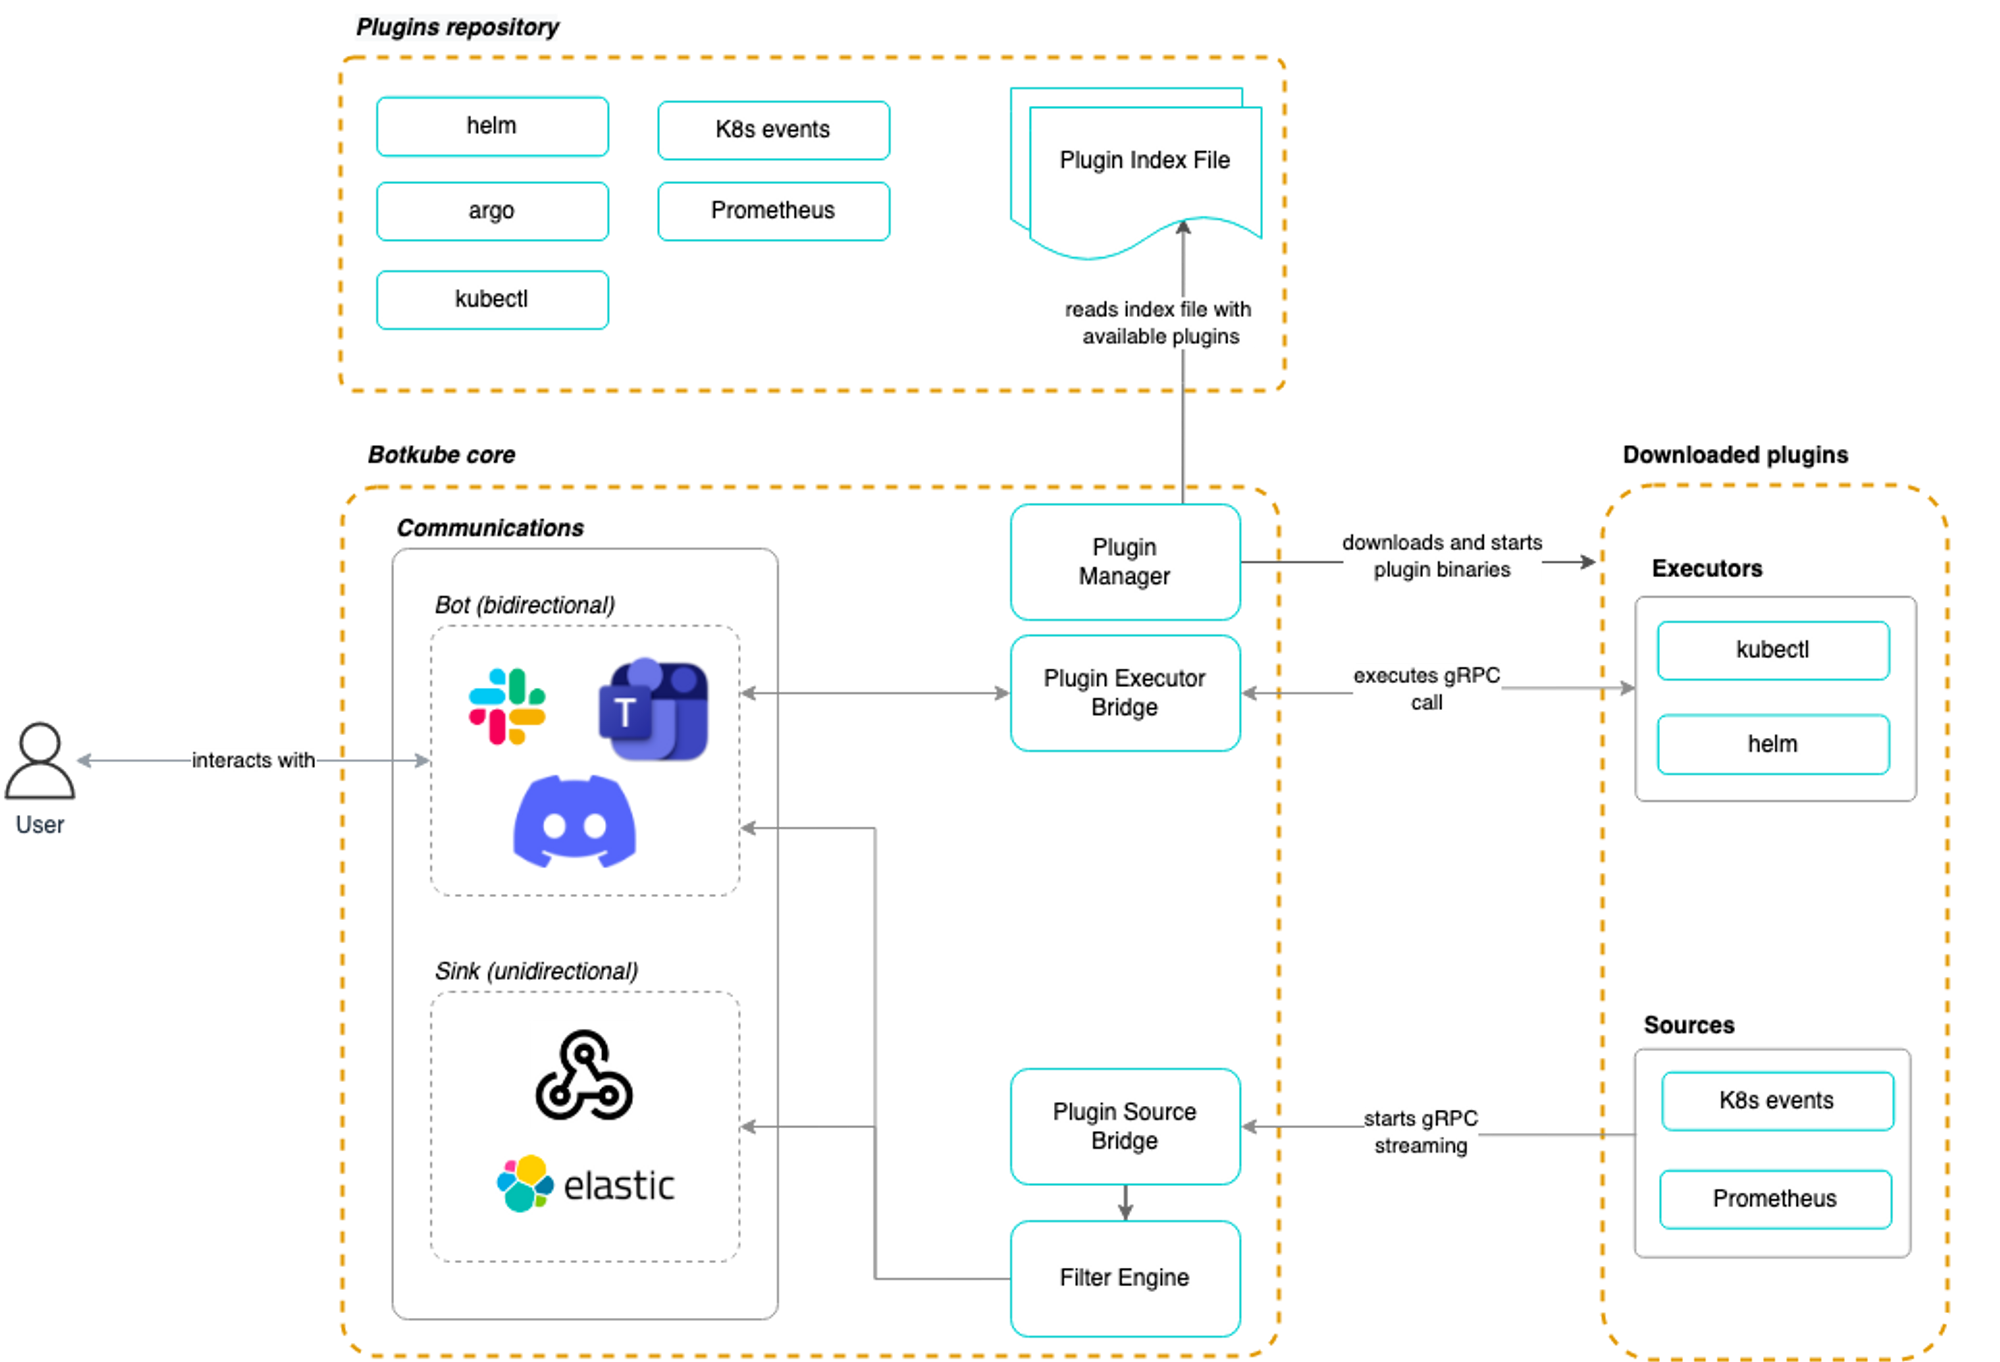
✅ Botkube
Botkube는 다양한 협업 도구의 BOT 기능을 연동하여 지표의 상태를 모니터링 하고, BOT을 이용한
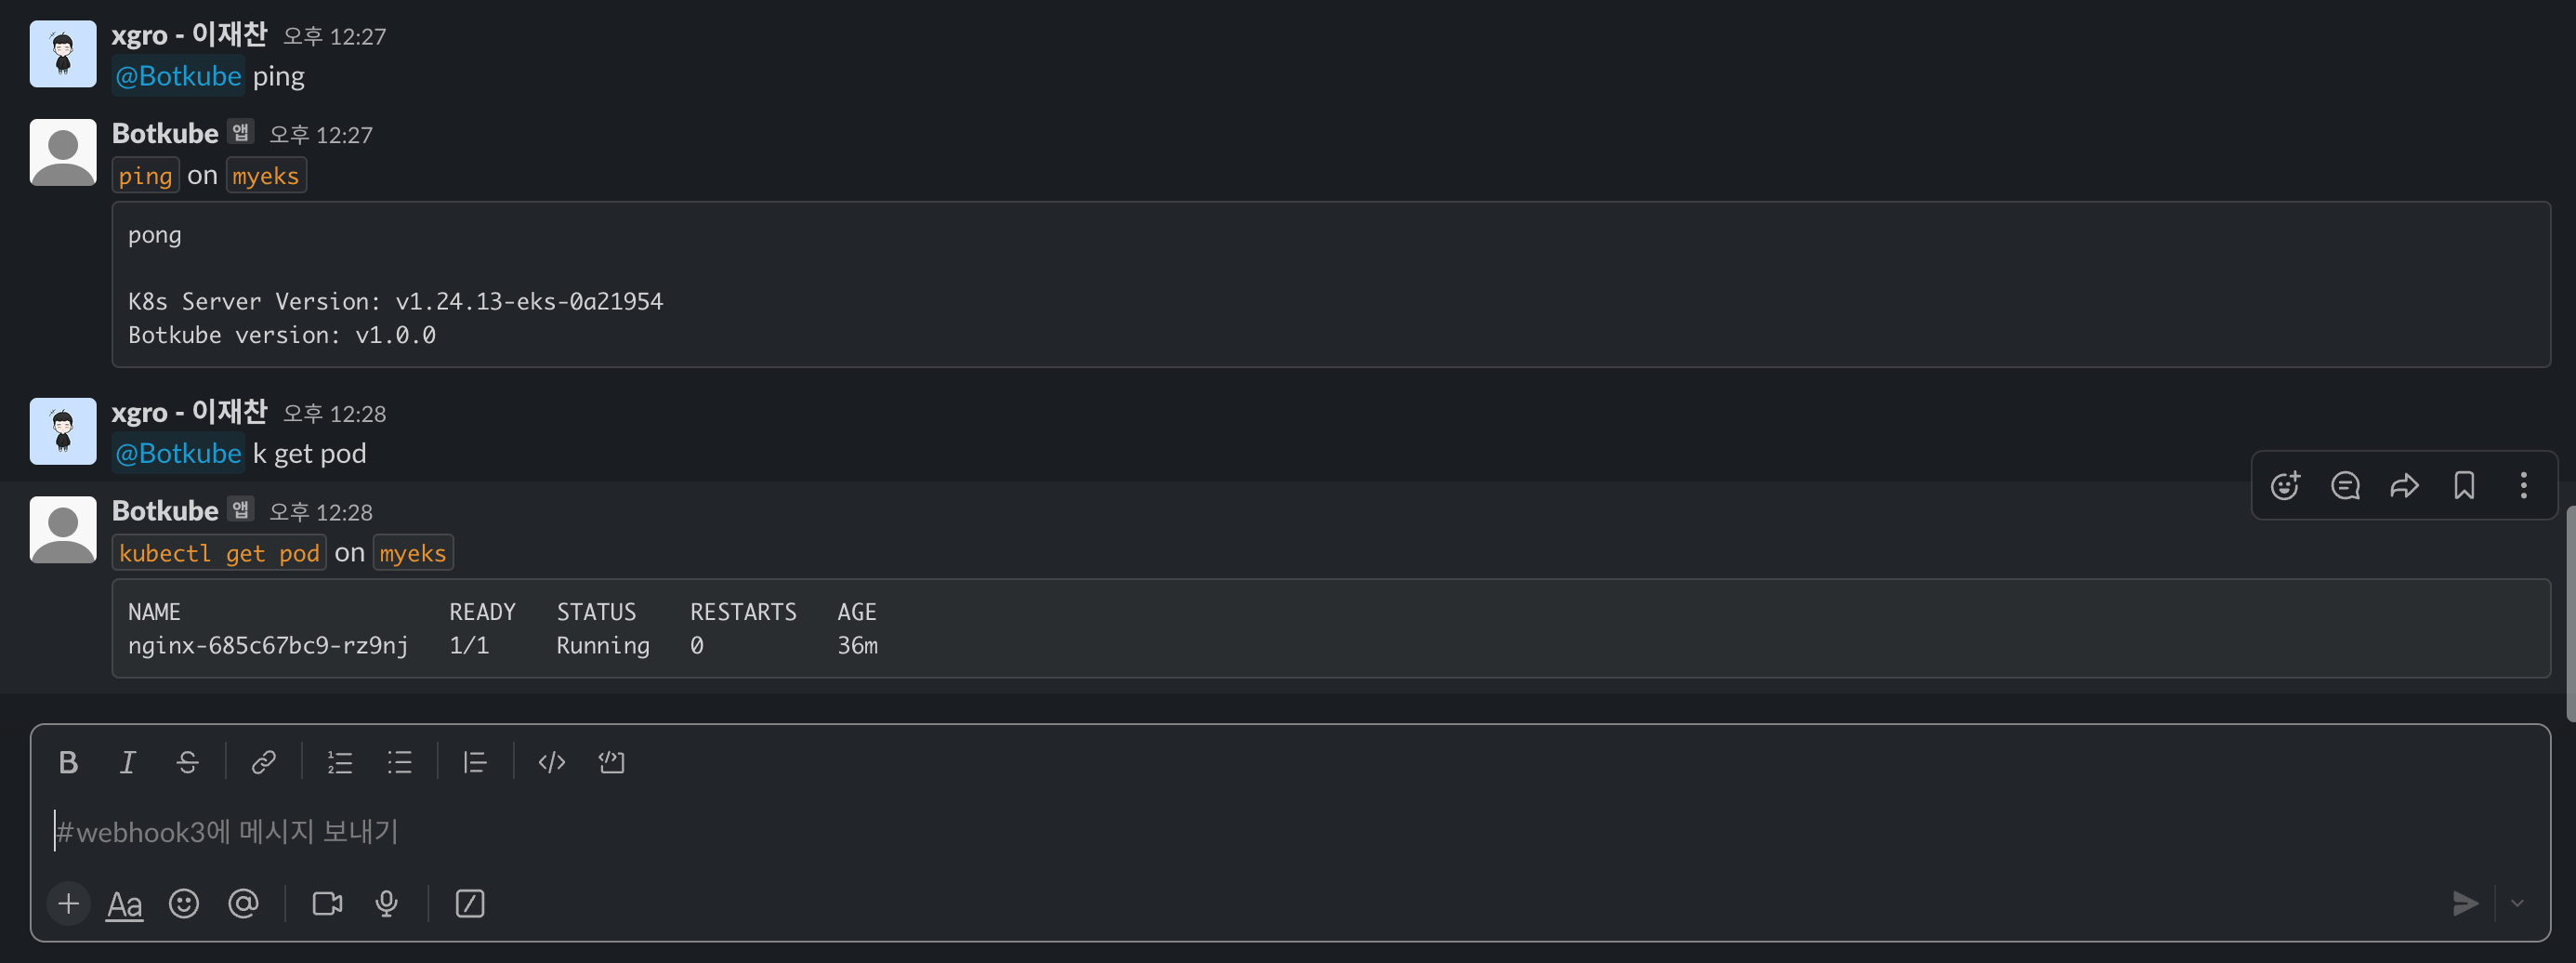
kubectl명령어 기능을 협업 도구에서 사용할 수 있도록 합니다.Slack의 민감정보인 토큰이 공개될 우려가 있으므로 실습완료에 대한 내용만 게재하였습니다.
# 연결 상태, notifications 상태 확인
@Botkube ping
@Botkube status notifications

# 파드 정보 조회
@Botkube k get pod
@Botkube kc get pod --namespace kube-system
@Botkube kubectl get pod --namespace kube-system -o wide

# Actionable notifications
@Botkube kubectl
👉 Step 05. 프로메테우스-스택
Prometheus is an open-source systems monitoring and alerting toolkit originally built at SoundCloud
✅ Prometheus란?
프로메테우스는 Soundcloud에서 개발한 오픈소스이며, 대상 시스템의 지표를 수집하여 저장하고 검색할 수 있는 프로그램 입니다.
프로메테우스는 다음과 같은 기능을 제공합니다.
a multi-dimensional data model with time series data(=TSDB, 시계열 데이터베이스) identified by metric name and key/value pairs
PromQL, a flexible query language to leverage this dimensionality
no reliance on distributed storage; single server nodes are autonomous
time series collection happens via a pull model over HTTP ⇒ Push 와 Pull 수집 방식 장단점 - 링크
pushing time series is supported via an intermediary gateway
targets are discovered via service discovery or static configuration
multiple modes of graphing and dashboarding support

프로메테우스-스택 설치 :
모니터링에 필요한 여러 요소를 단일 차트(스택)으로 제공 ← 시각화(그라파나), 이벤트 메시지 정책(경고 임계값, 경고 수준) 등 - Helm
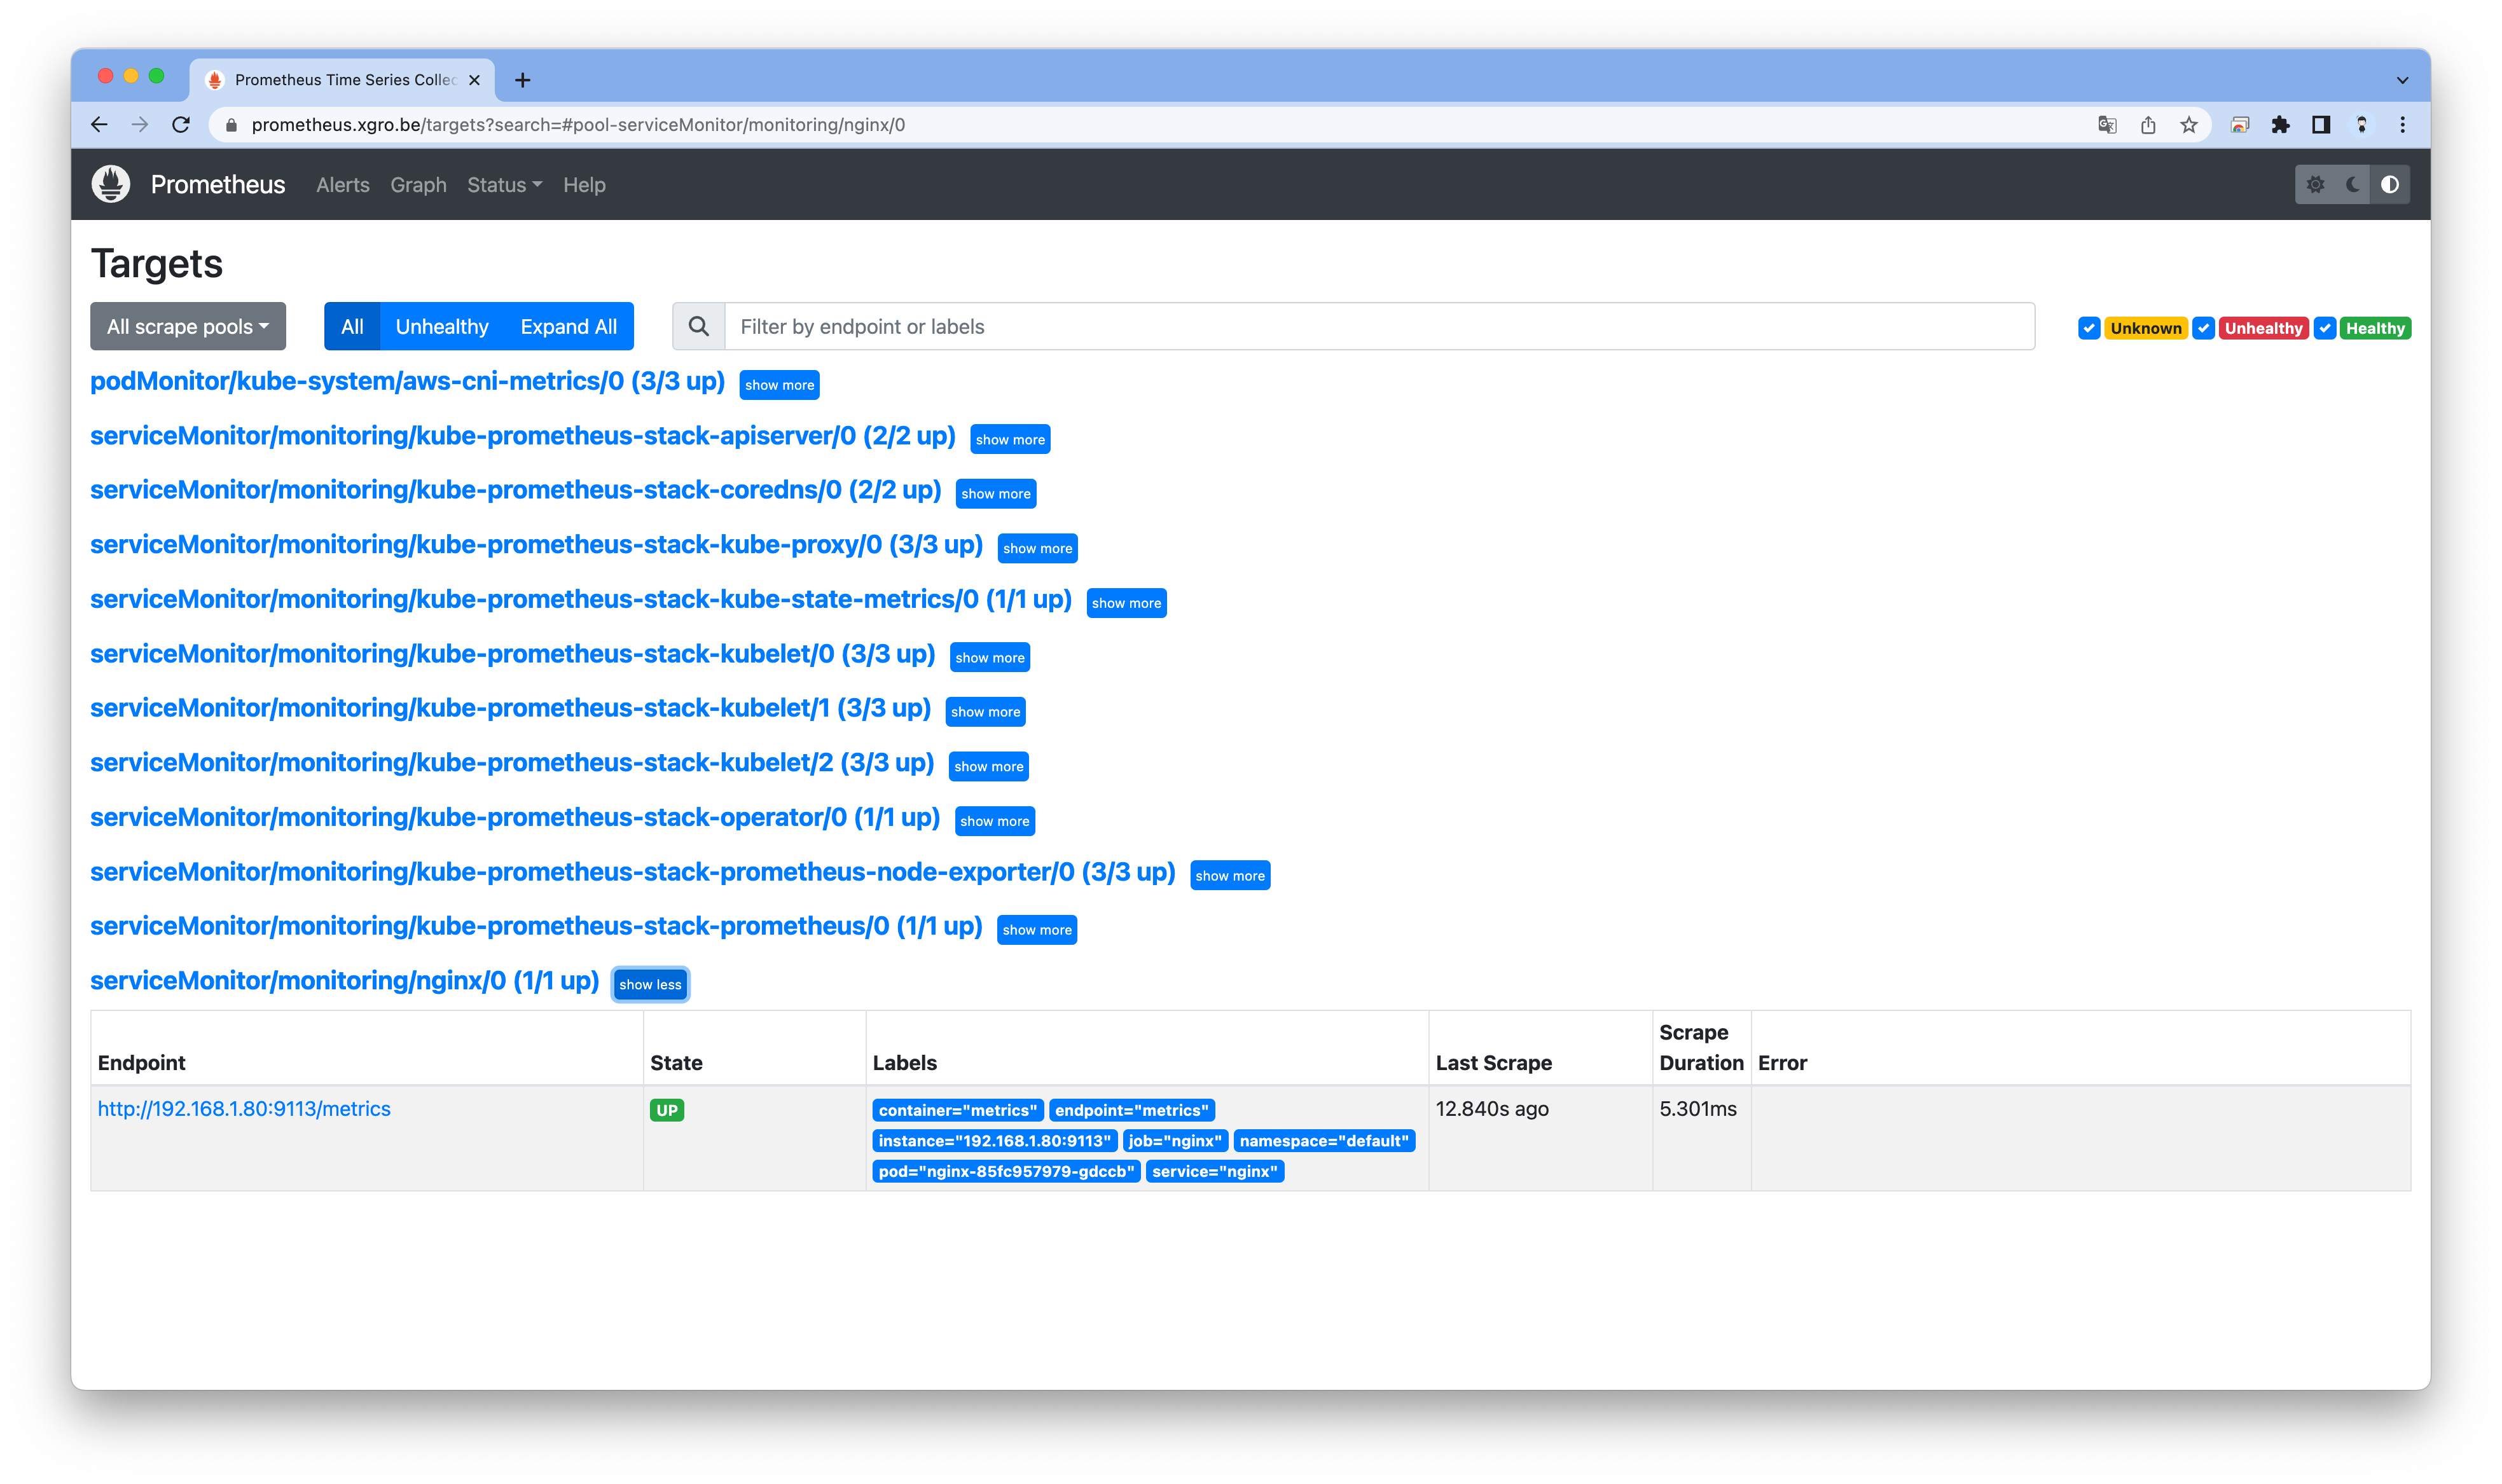
전체 메트릭 대상(Targets) 확인 : Status → Targets
- 해당 스택은 ‘노드-익스포터’, cAdvisor, 쿠버네티스 전반적인 현황 이외에 다양한 메트릭을 포함
- 현재 각 Target 클릭 시 메트릭 정보 확인 : 아래 예시
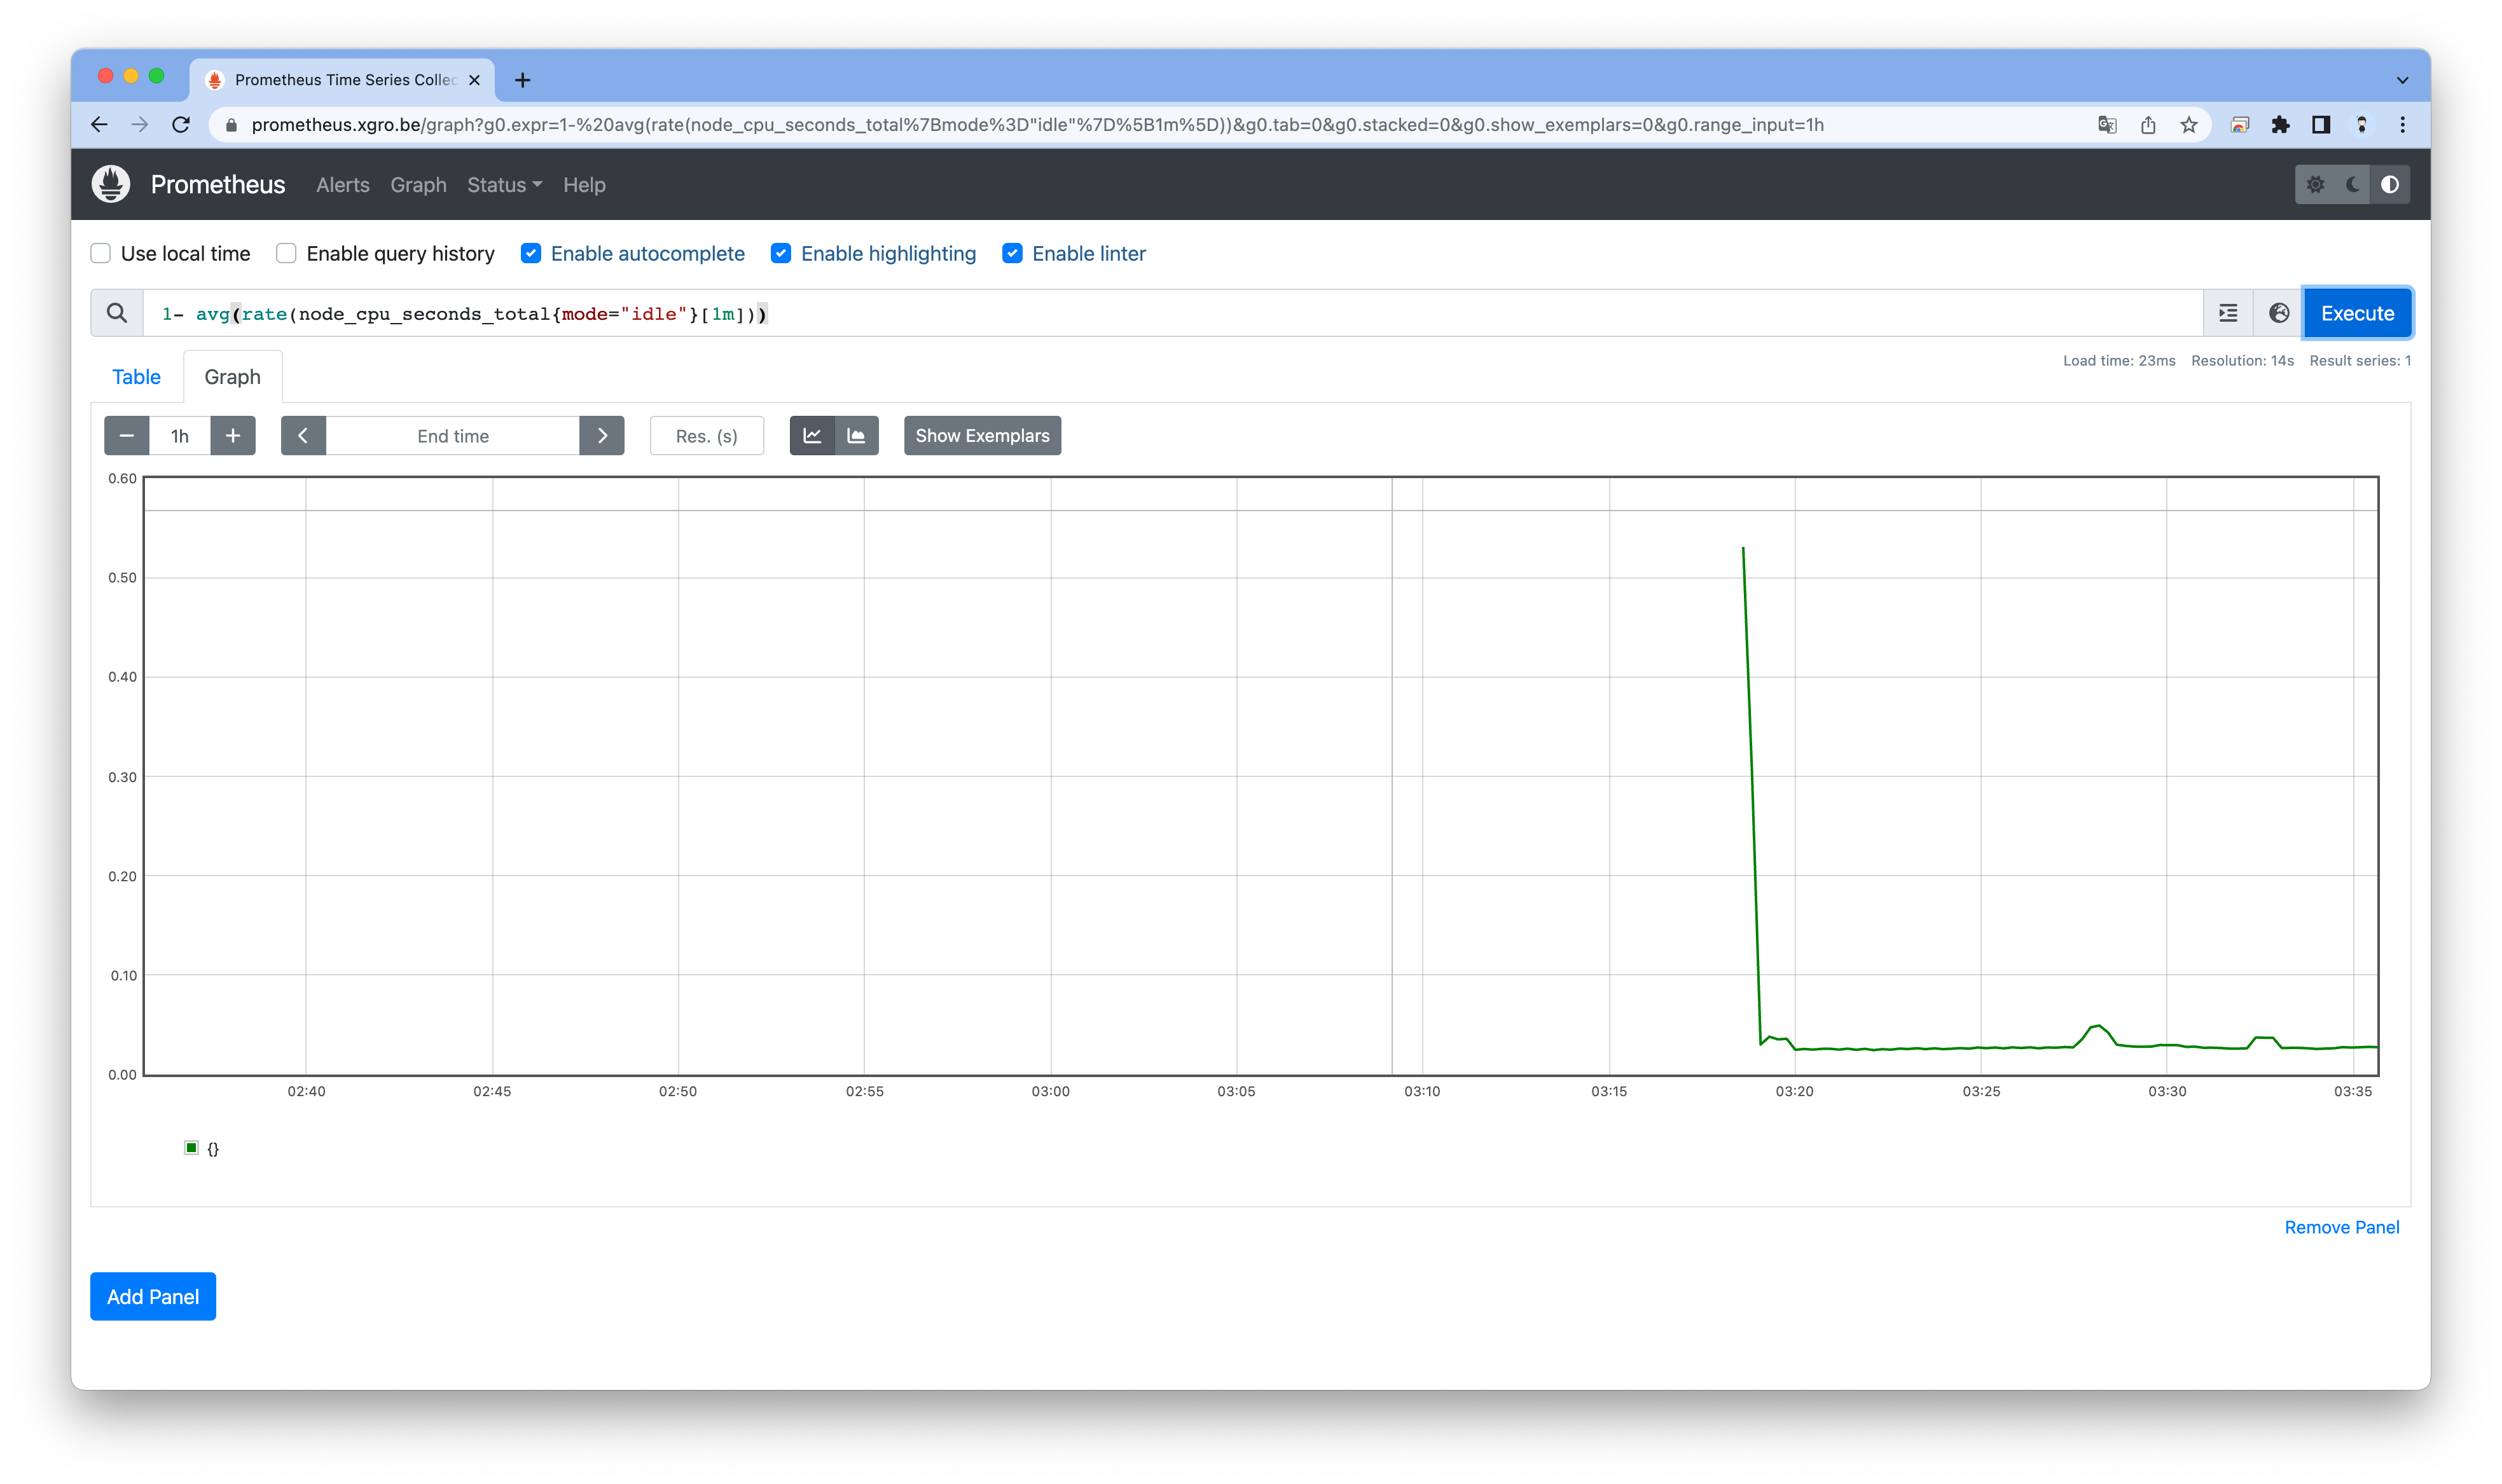
메트릭을 그래프(Graph)로 조회 : Graph - 아래 PromQL 쿼리(전체 클러스터 노드의 CPU 사용량 합계)입력 후 조회 → Graph 확인
- 혹은 지구 아이콘(Metrics Explorer) 클릭 시 전체 메트릭 출력되며, 해당 메트릭 클릭해서 확인

👉 Step 06. 그라파나 Grafana
그라파나란?
TSDB 데이터를 시각화하고, 다양한 데이터 형식을 지원합니다. - 링크
Grafana open source software enables you to query, visualize, alert on, and explore your metrics, logs, and traces wherever they are stored. Grafana OSS provides you with tools to turn your time-series database (TSDB) data into insightful graphs and visualizations.
그라파나는 시각화 솔루션으로 데이터 자체를 저장하지 않습니다.
현재 실습 환경에서는 데이터 소스는 프로메테우스를 사용합니다.
접속 정보 확인 및 로그인 : 기본 계정 - admin / prom-operator
Grafana의 여러 대시보드를 사용해보는 실습을 진행하였습니다.
여러 대시보드 사용해 보기
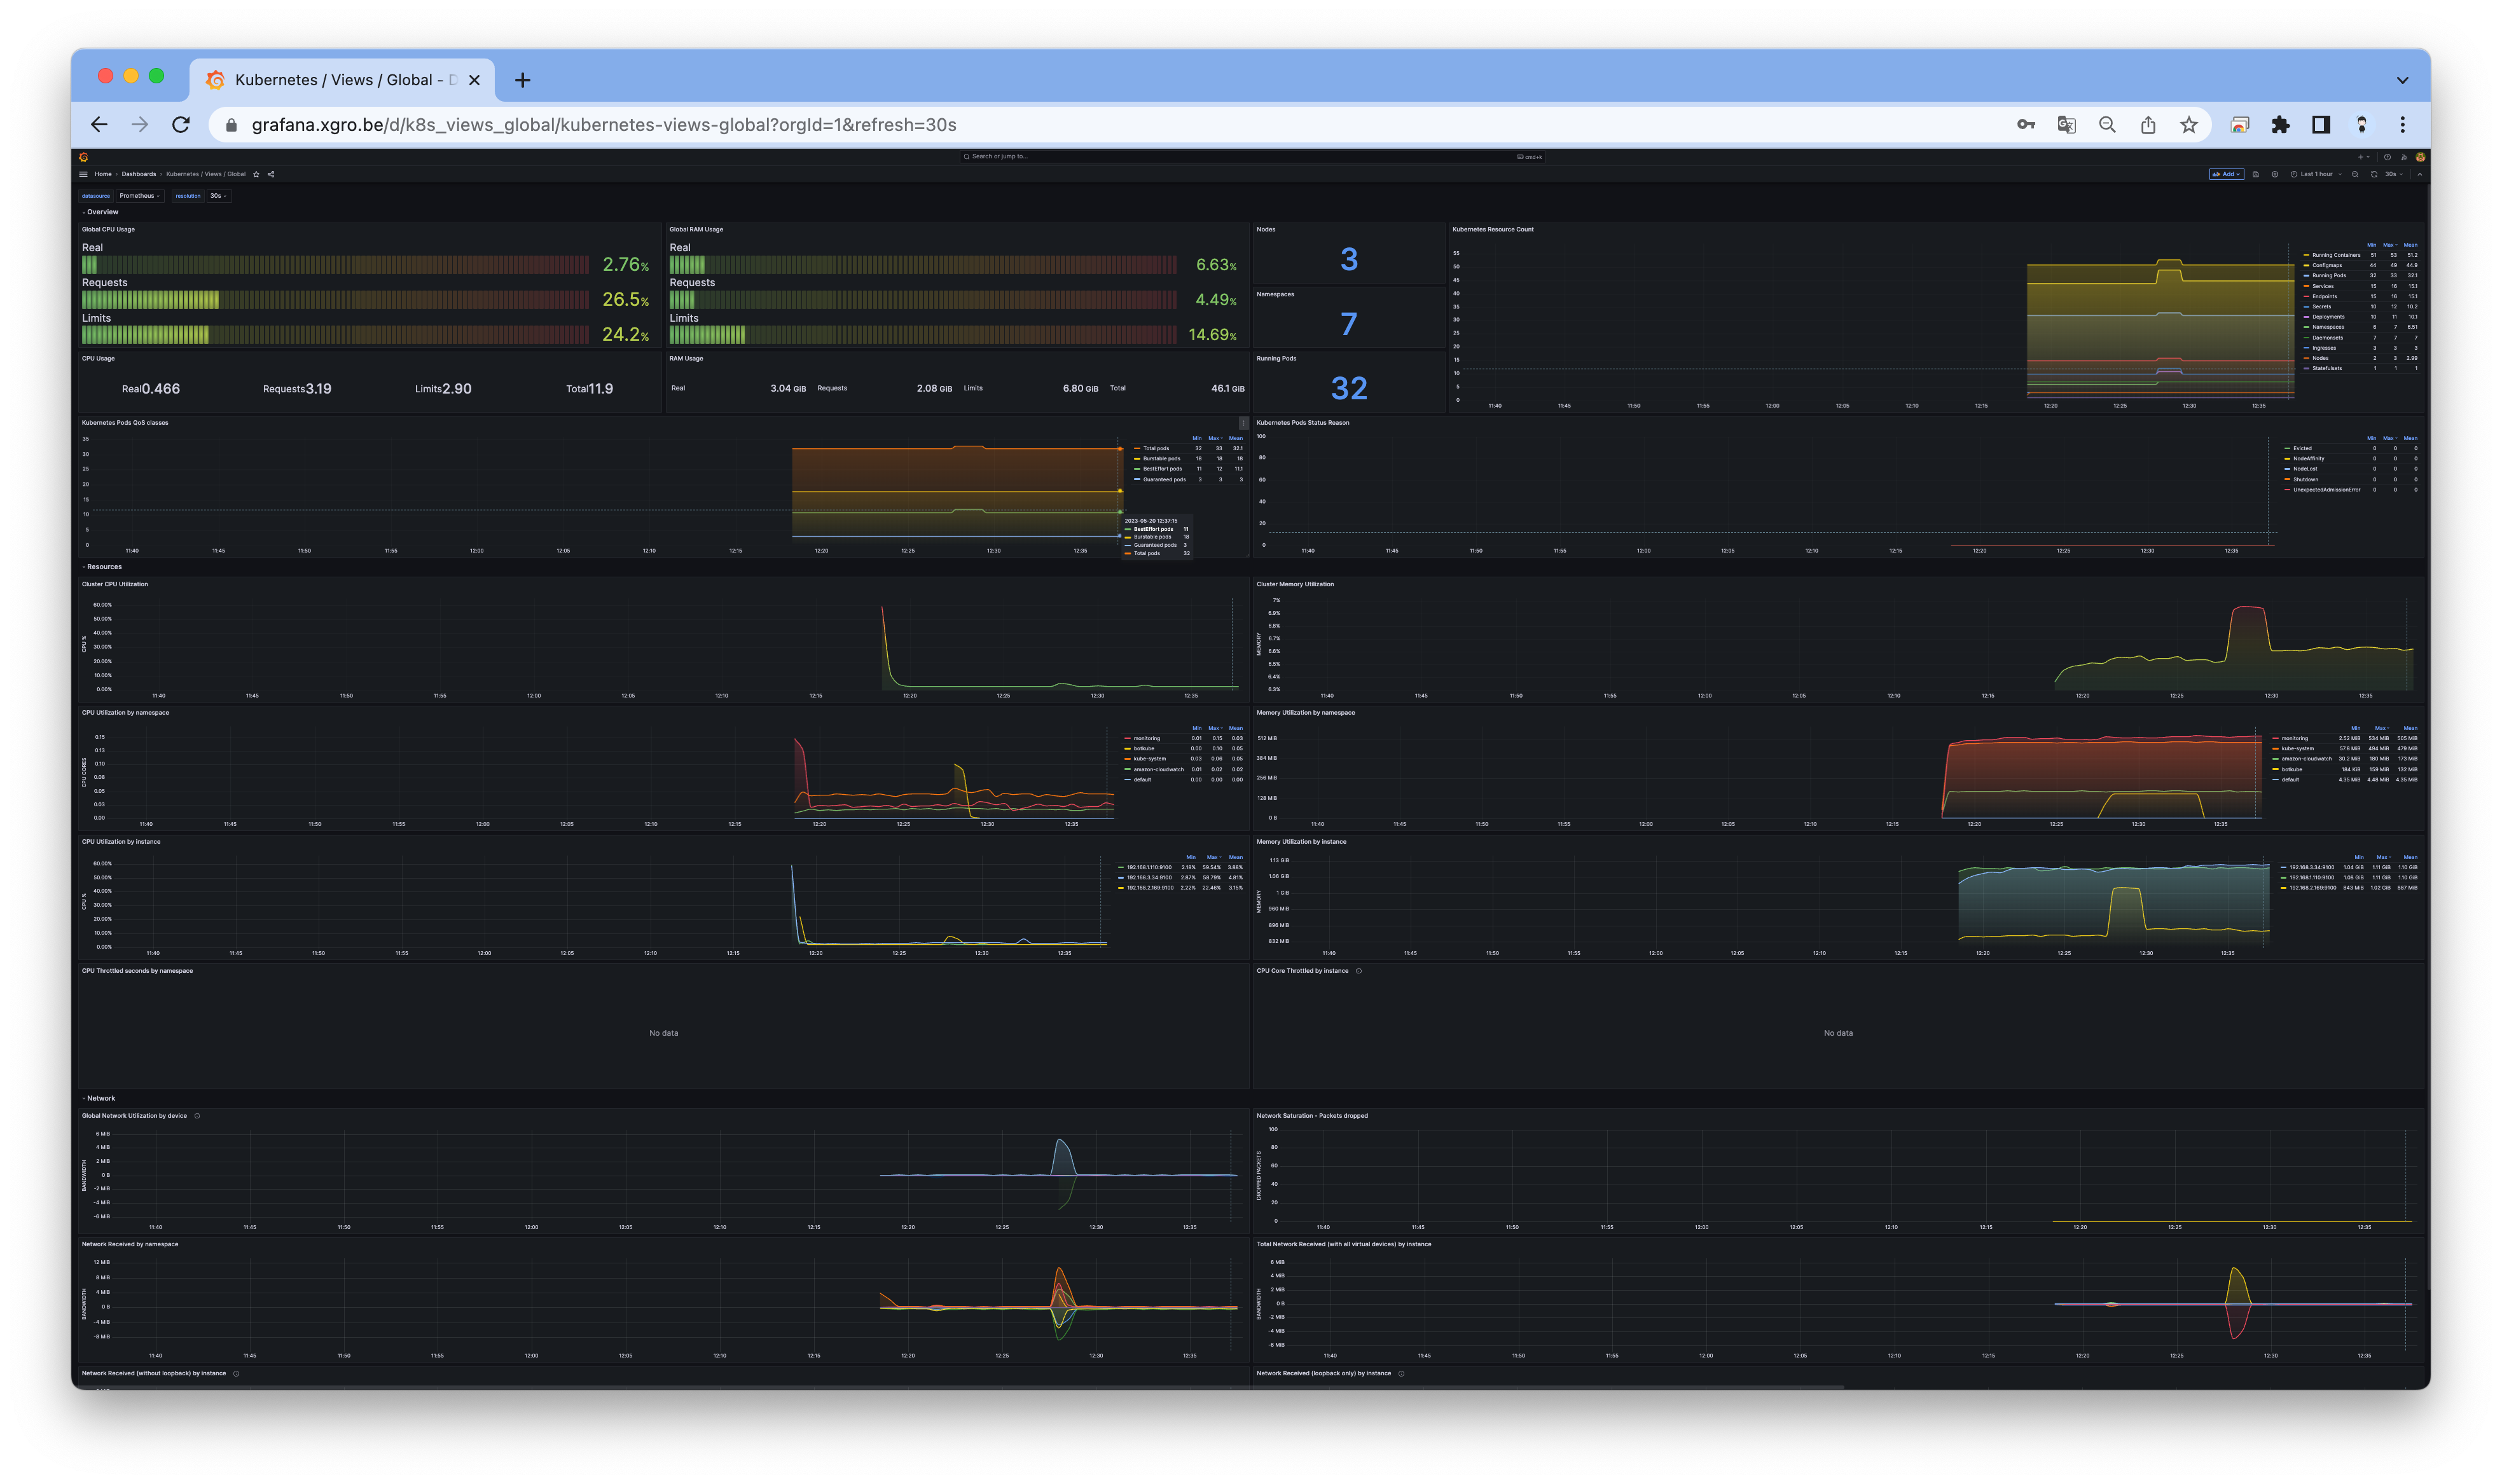
[Kubernetes / Views / Global] Dashboard → New → Import →
15757입력 후 Load ⇒ 데이터소스(Prometheus 선택) 후 Import 클릭
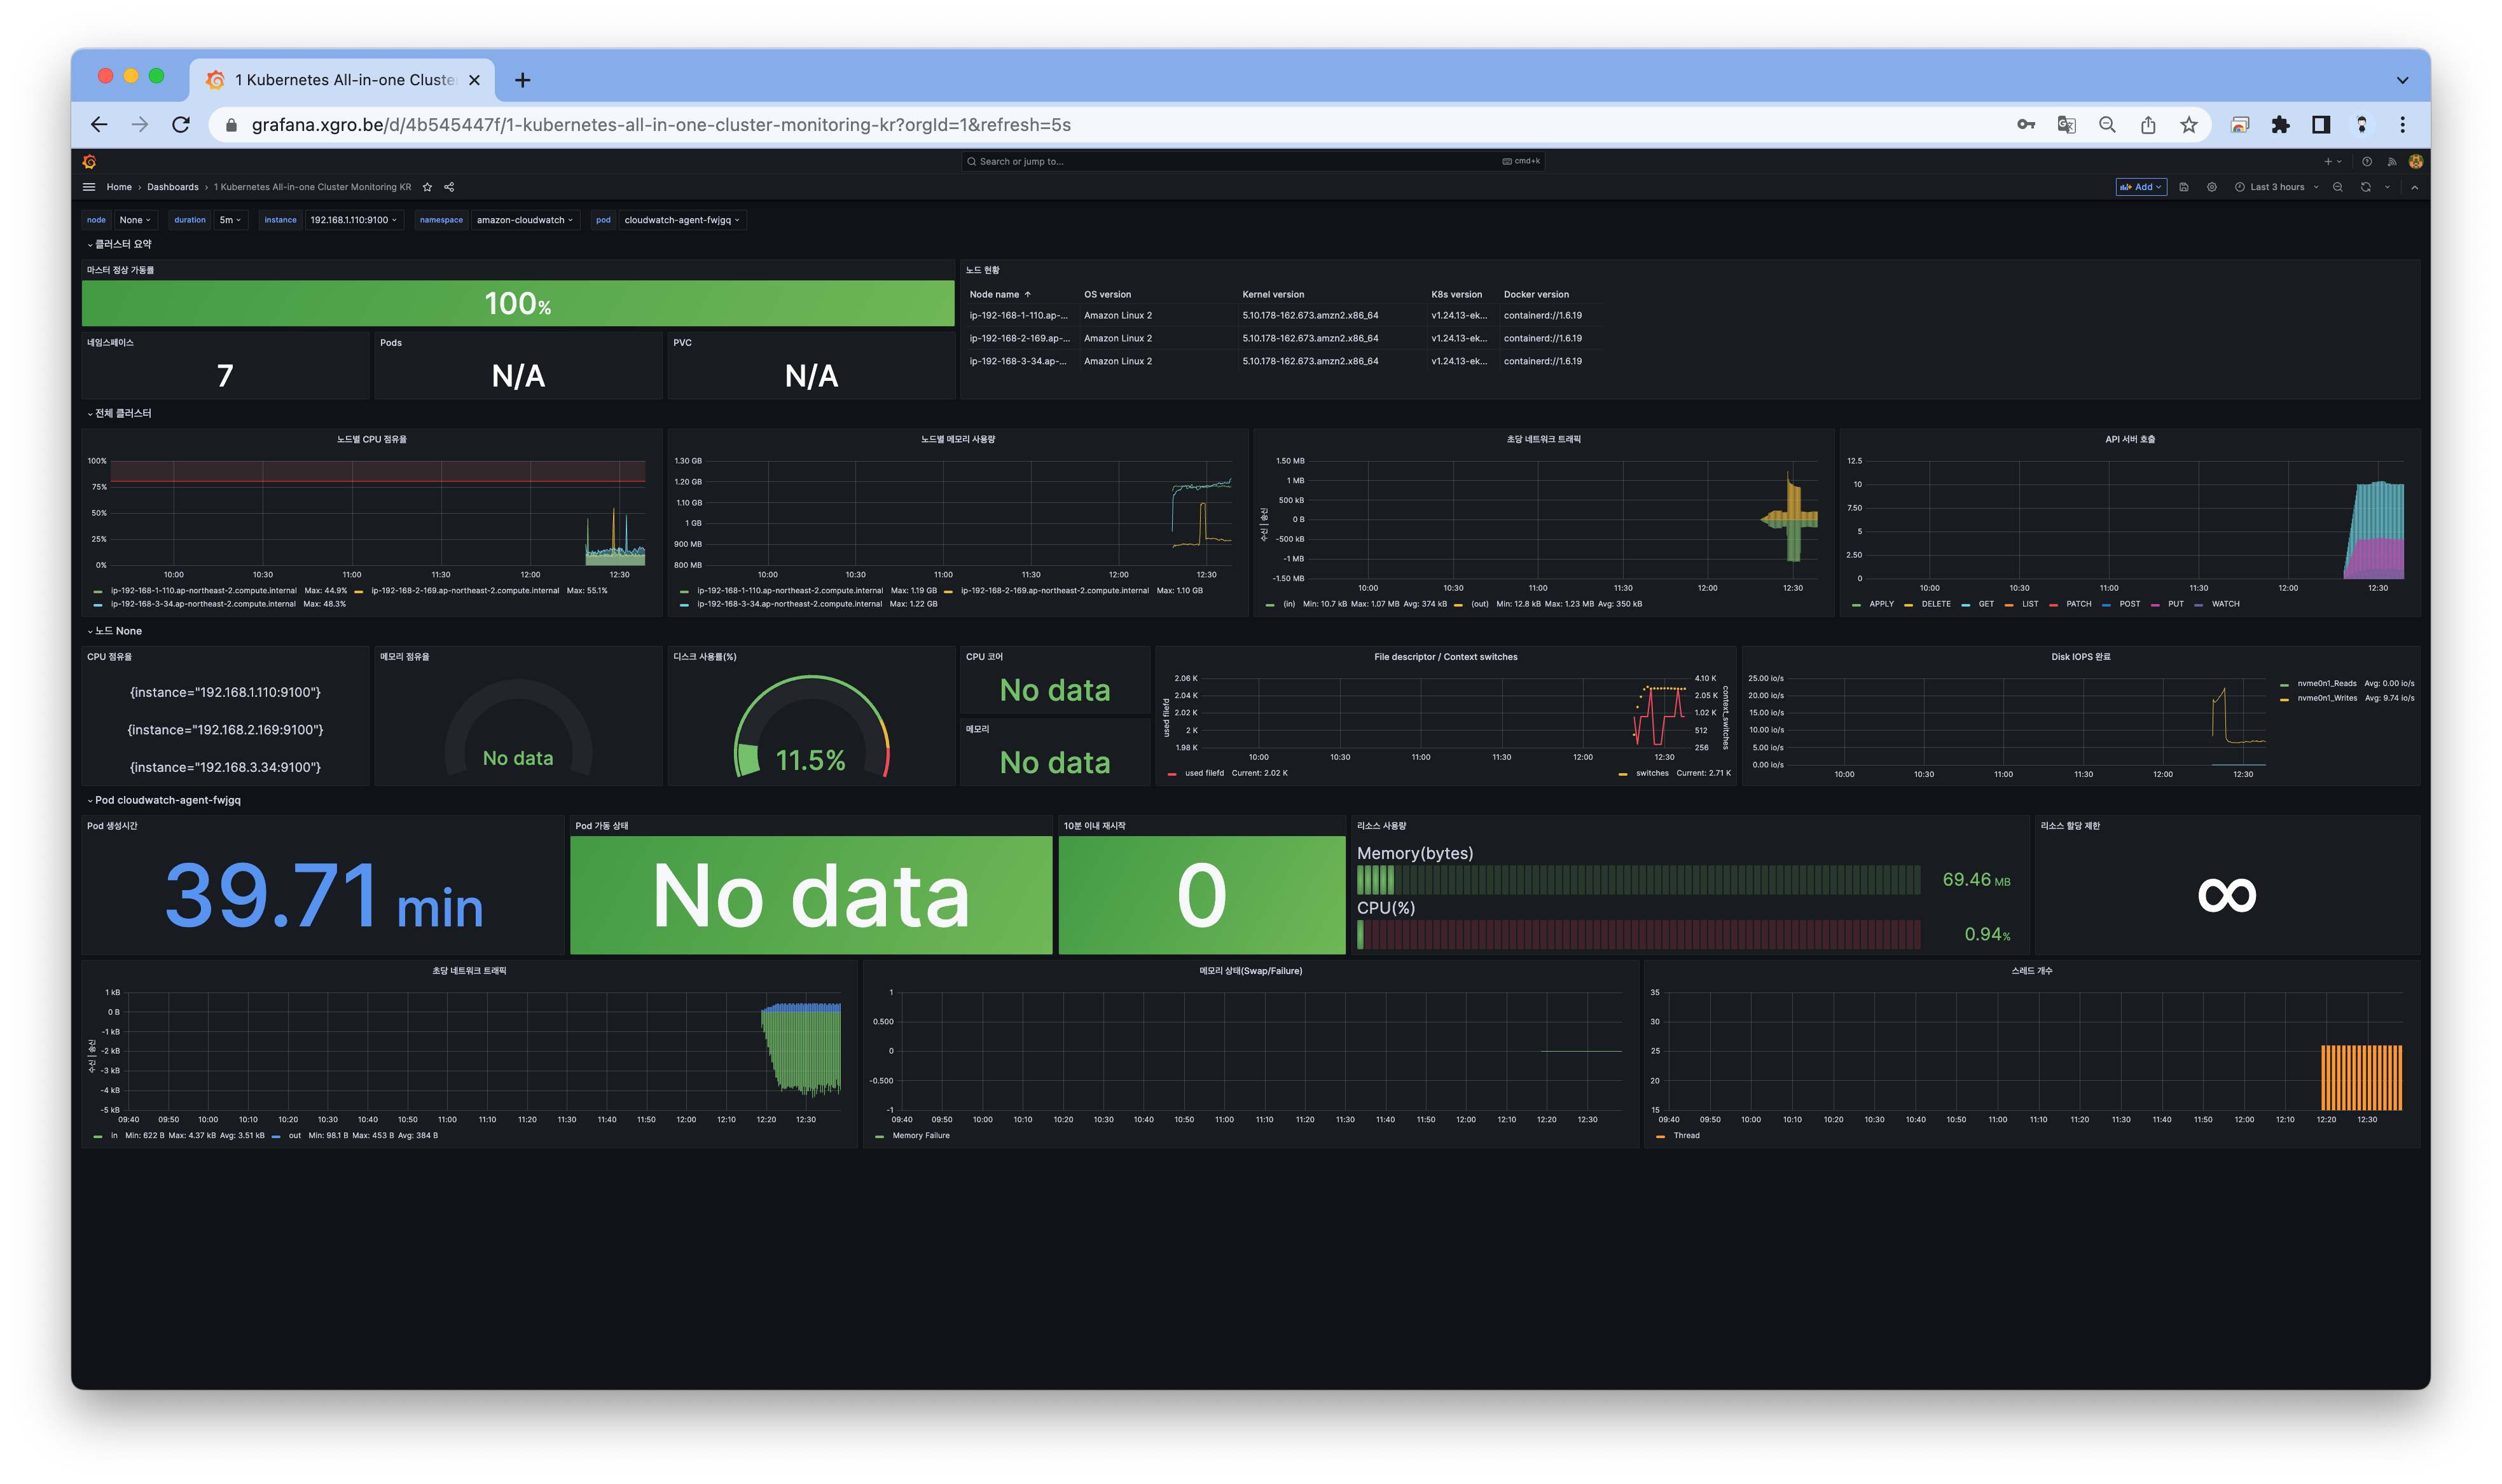
[1 Kubernetes All-in-one Cluster Monitoring KR] Dashboard → New → Import →
13770or17900입력 후 Load ⇒ 데이터소스(Prometheus 선택) 후 Import 클릭
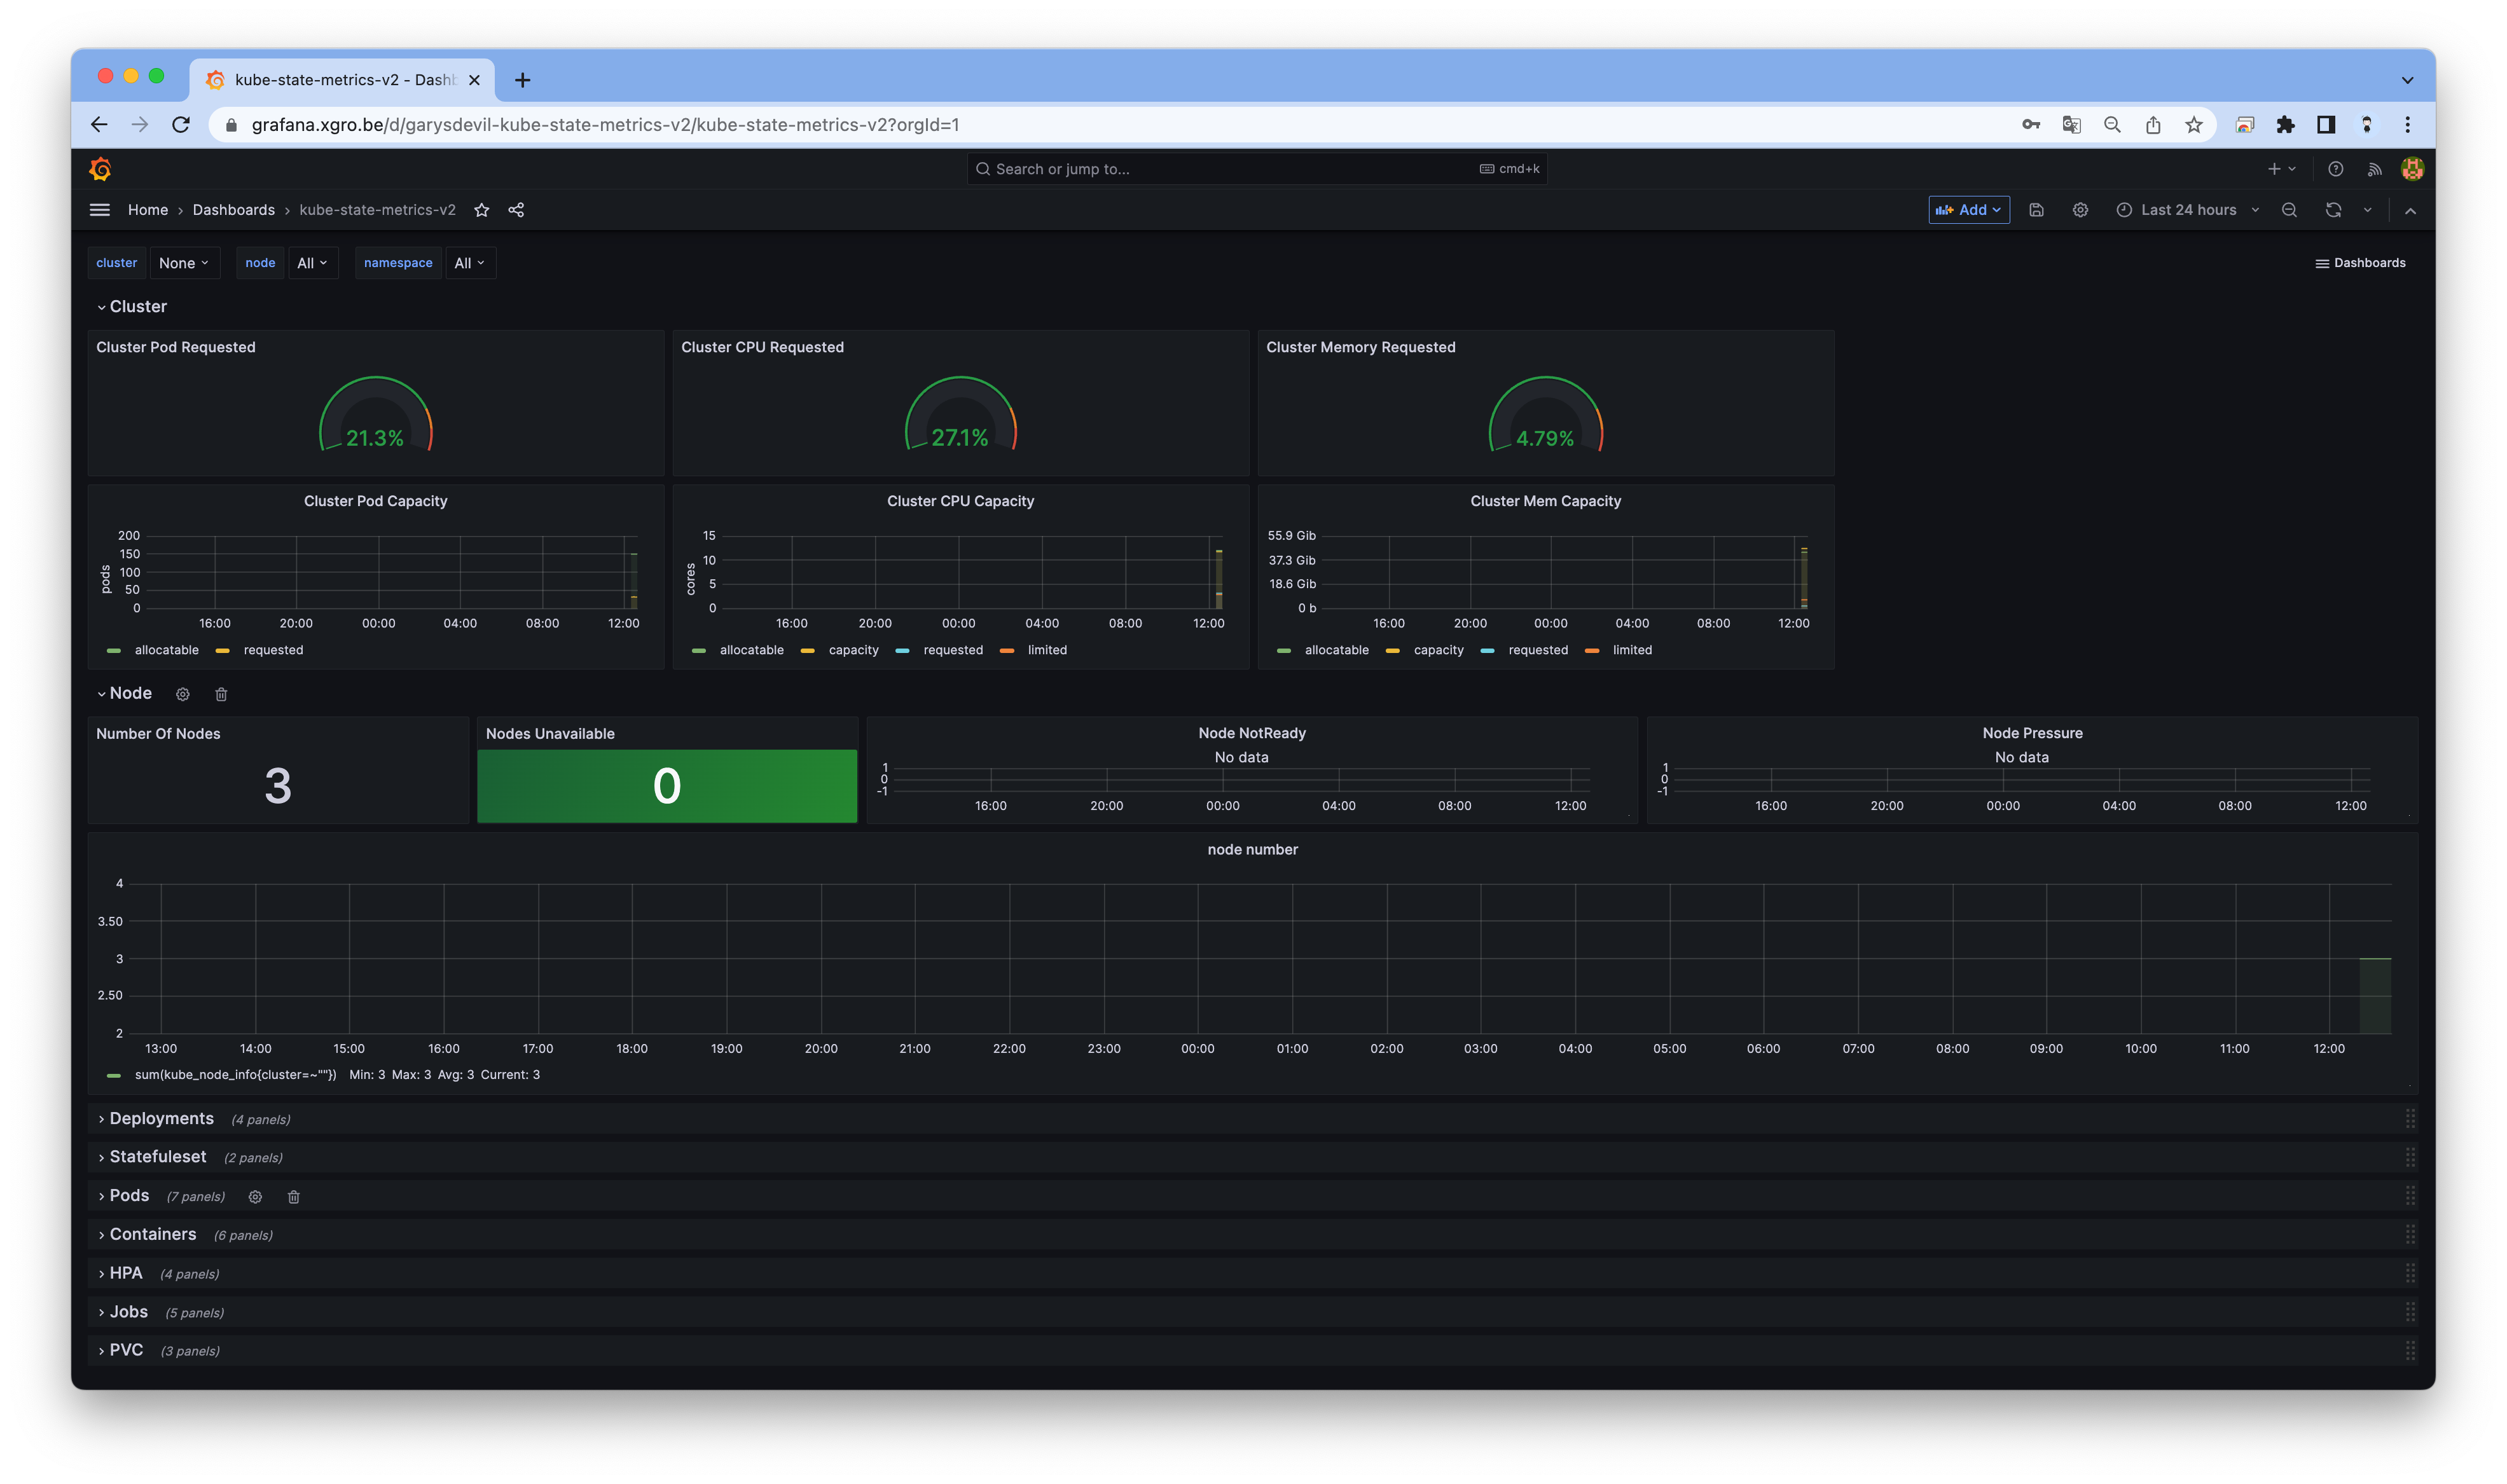
[kube-state-metrics-v2] Dashboard → New → Import →
13332입력 후 Load ⇒ 데이터소스(Prometheus 선택) 후 Import 클릭
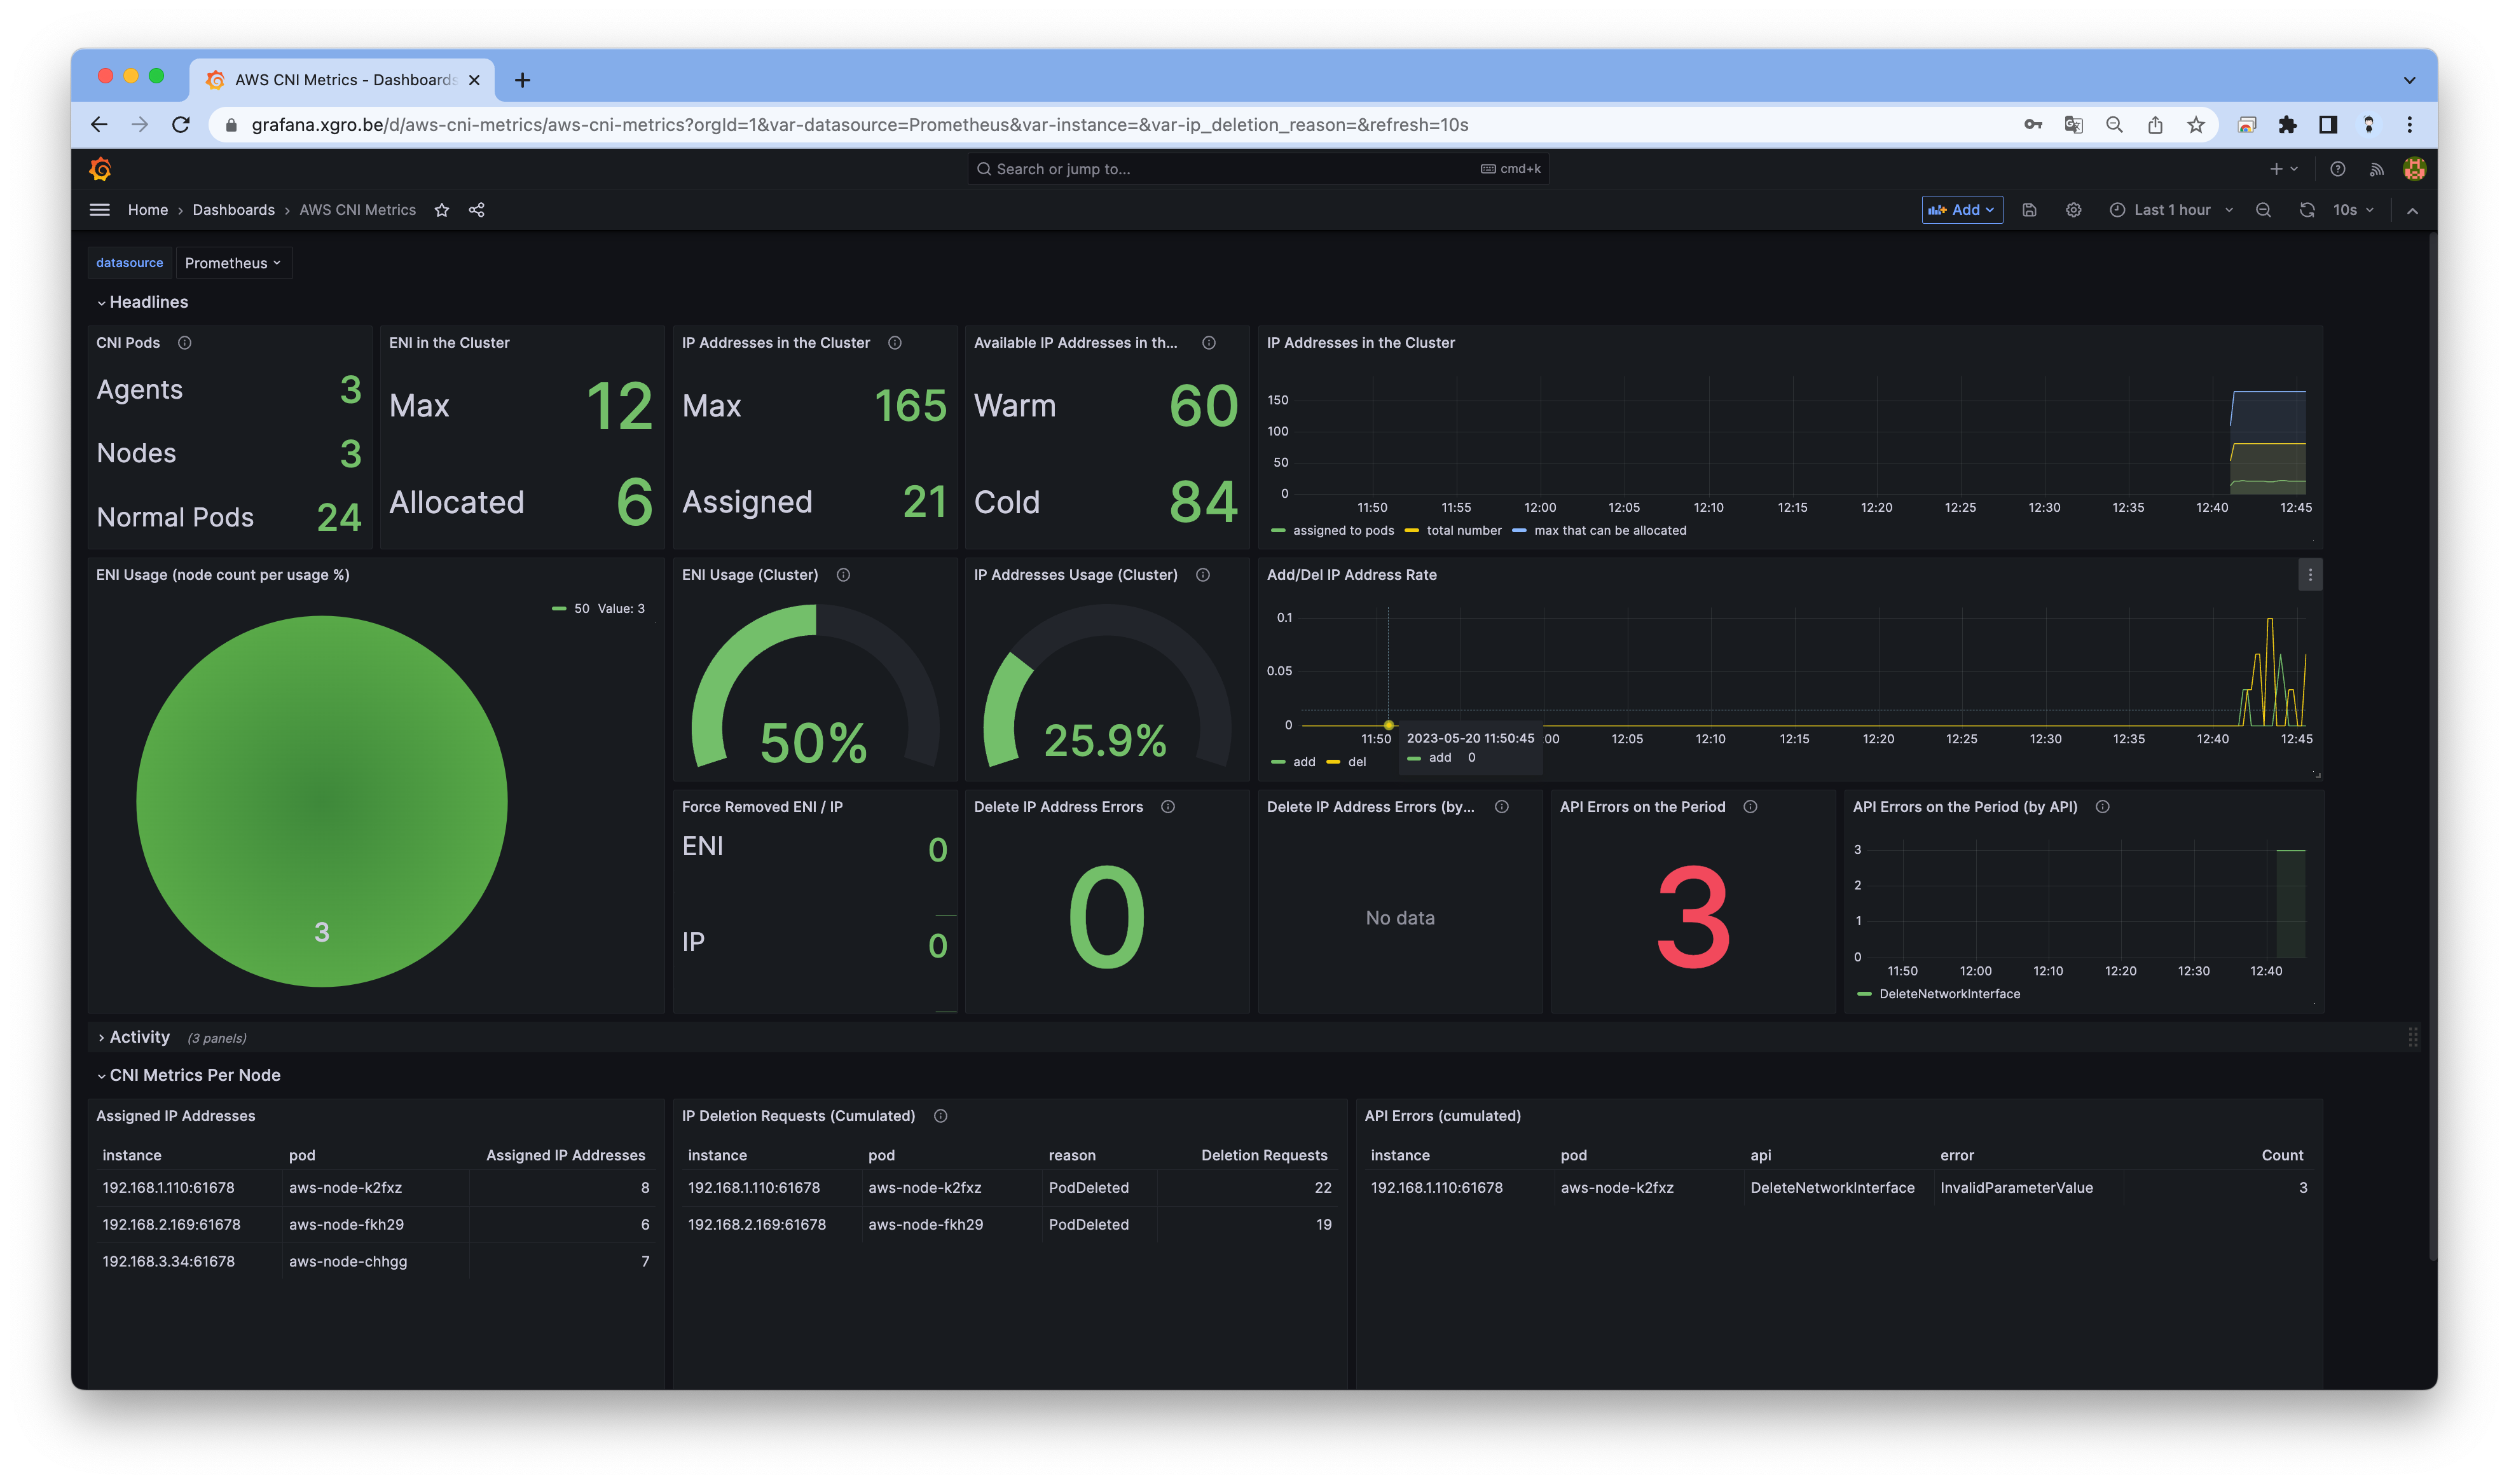
[Amazon EKS] AWS CNI Metrics
16032
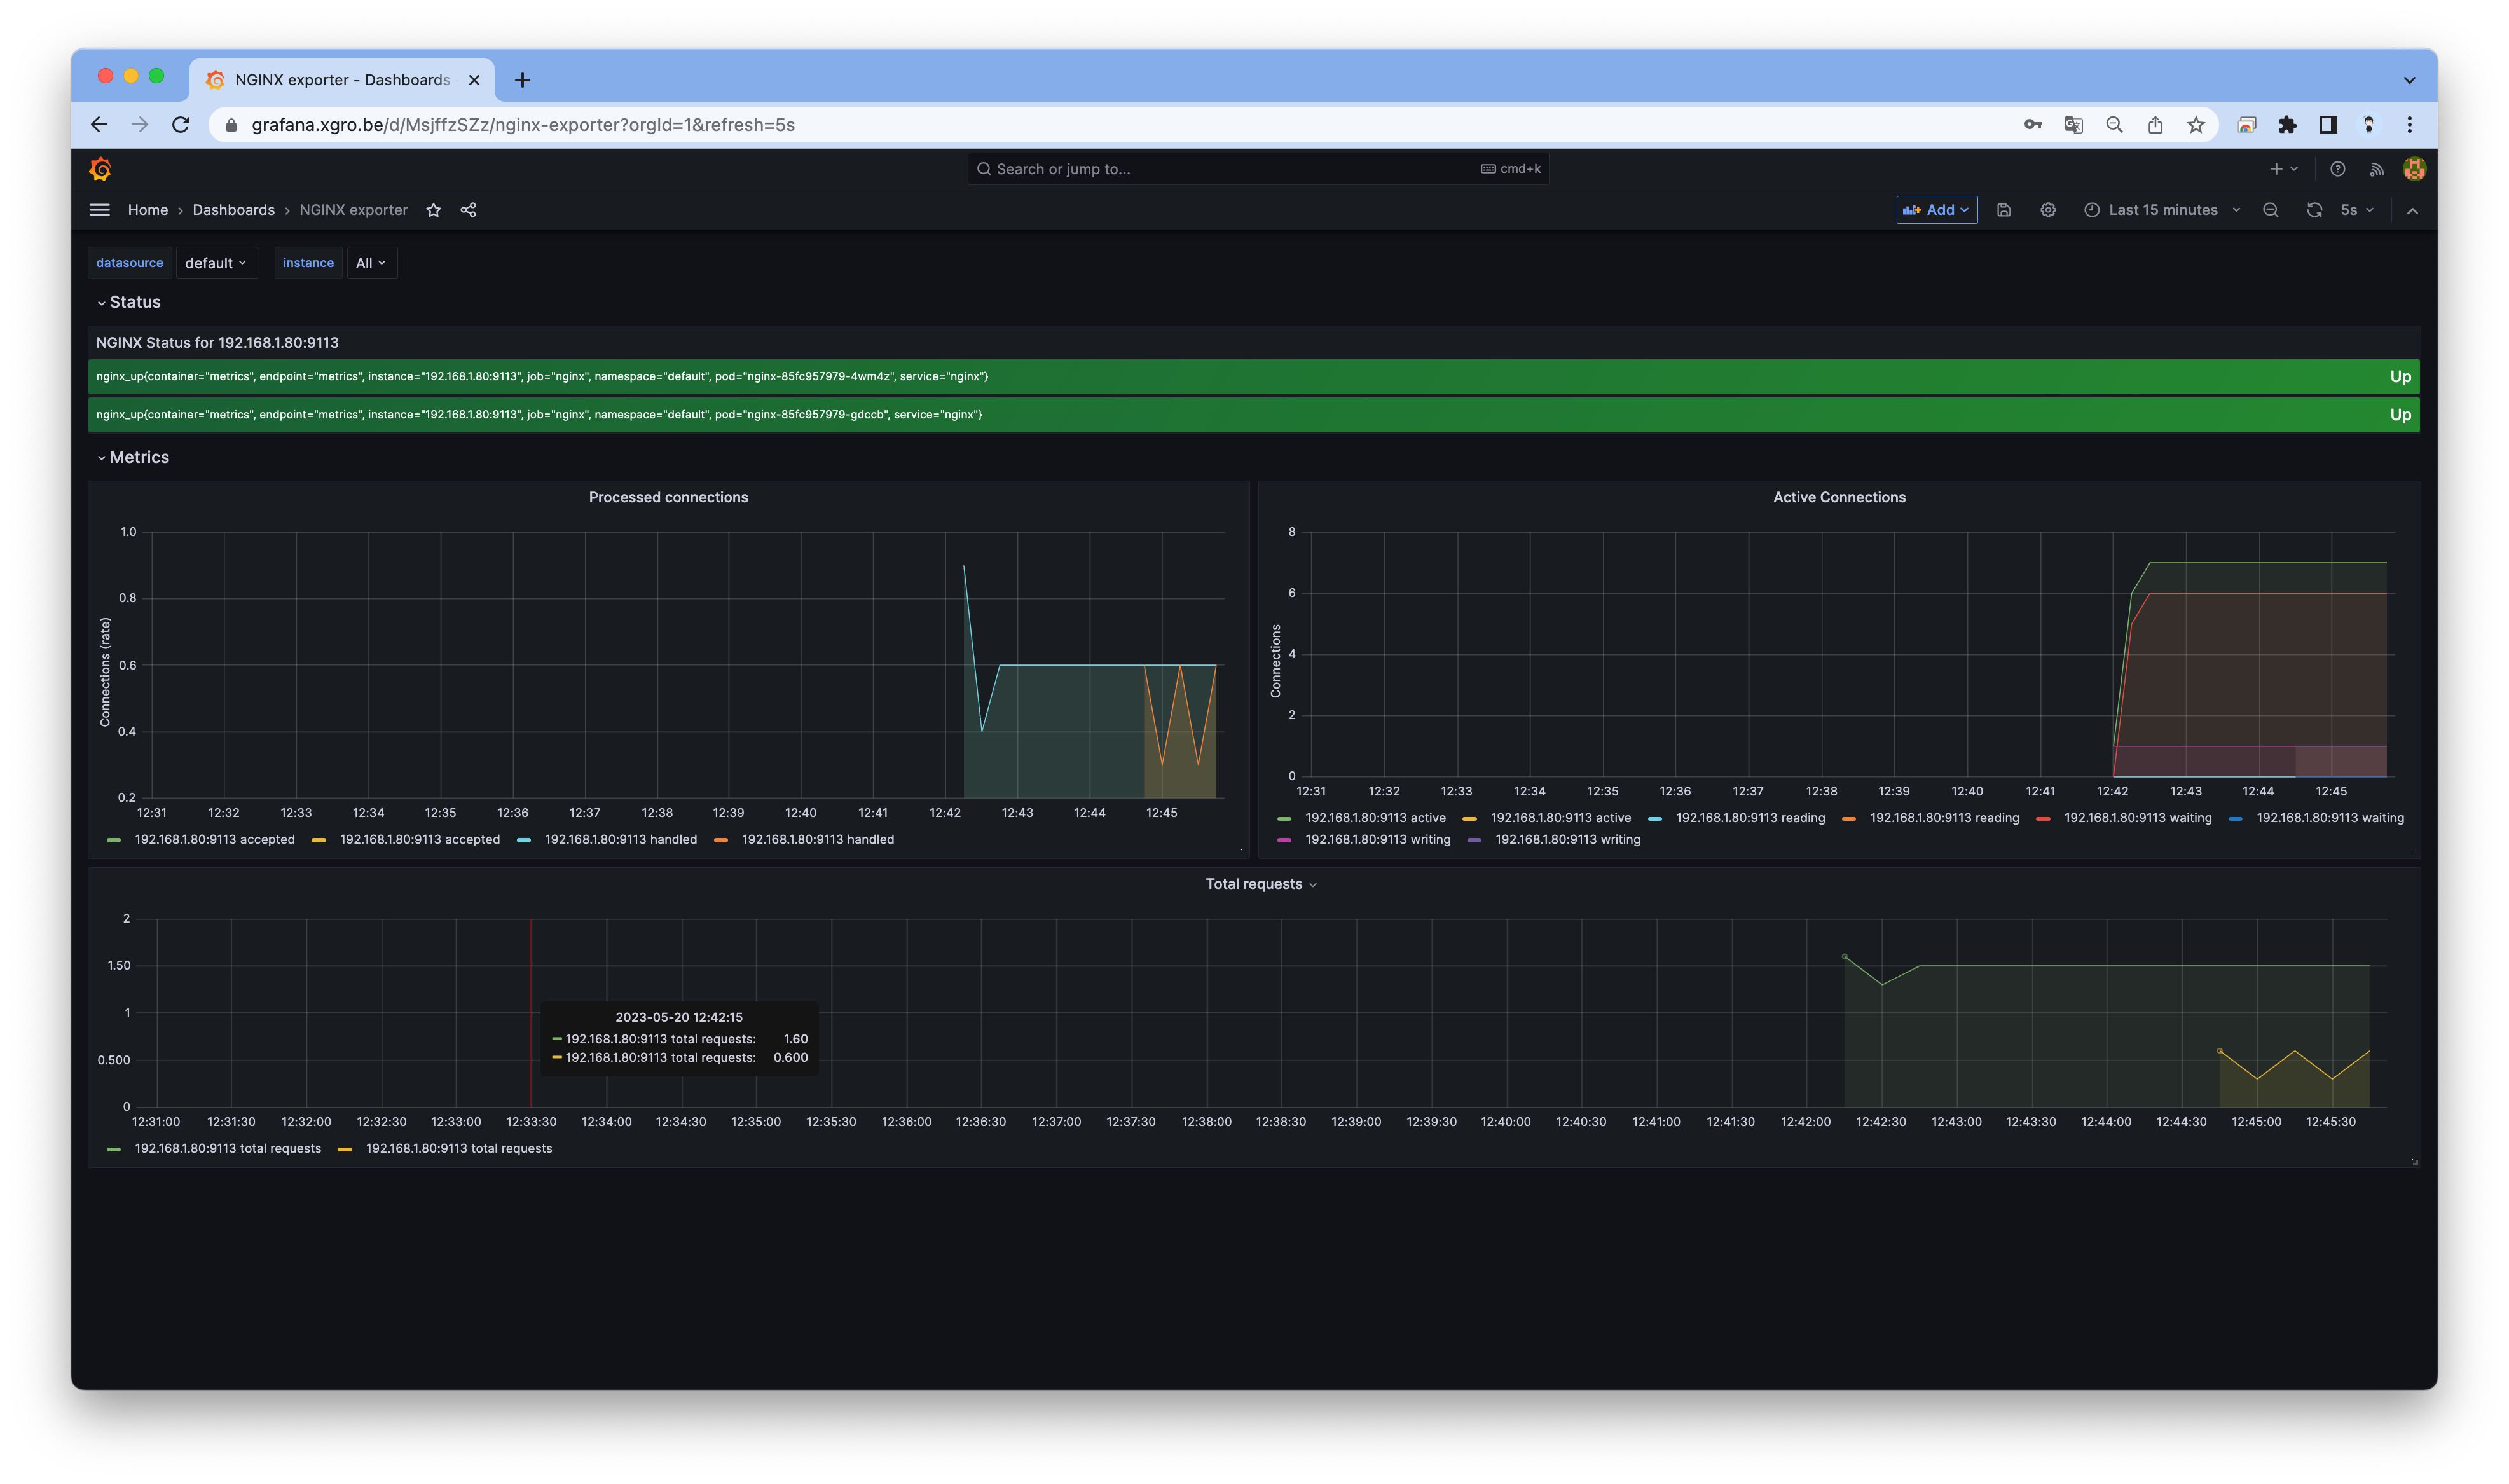
NGINX 애플리케이션 모니터링 대시보드 추가
12708
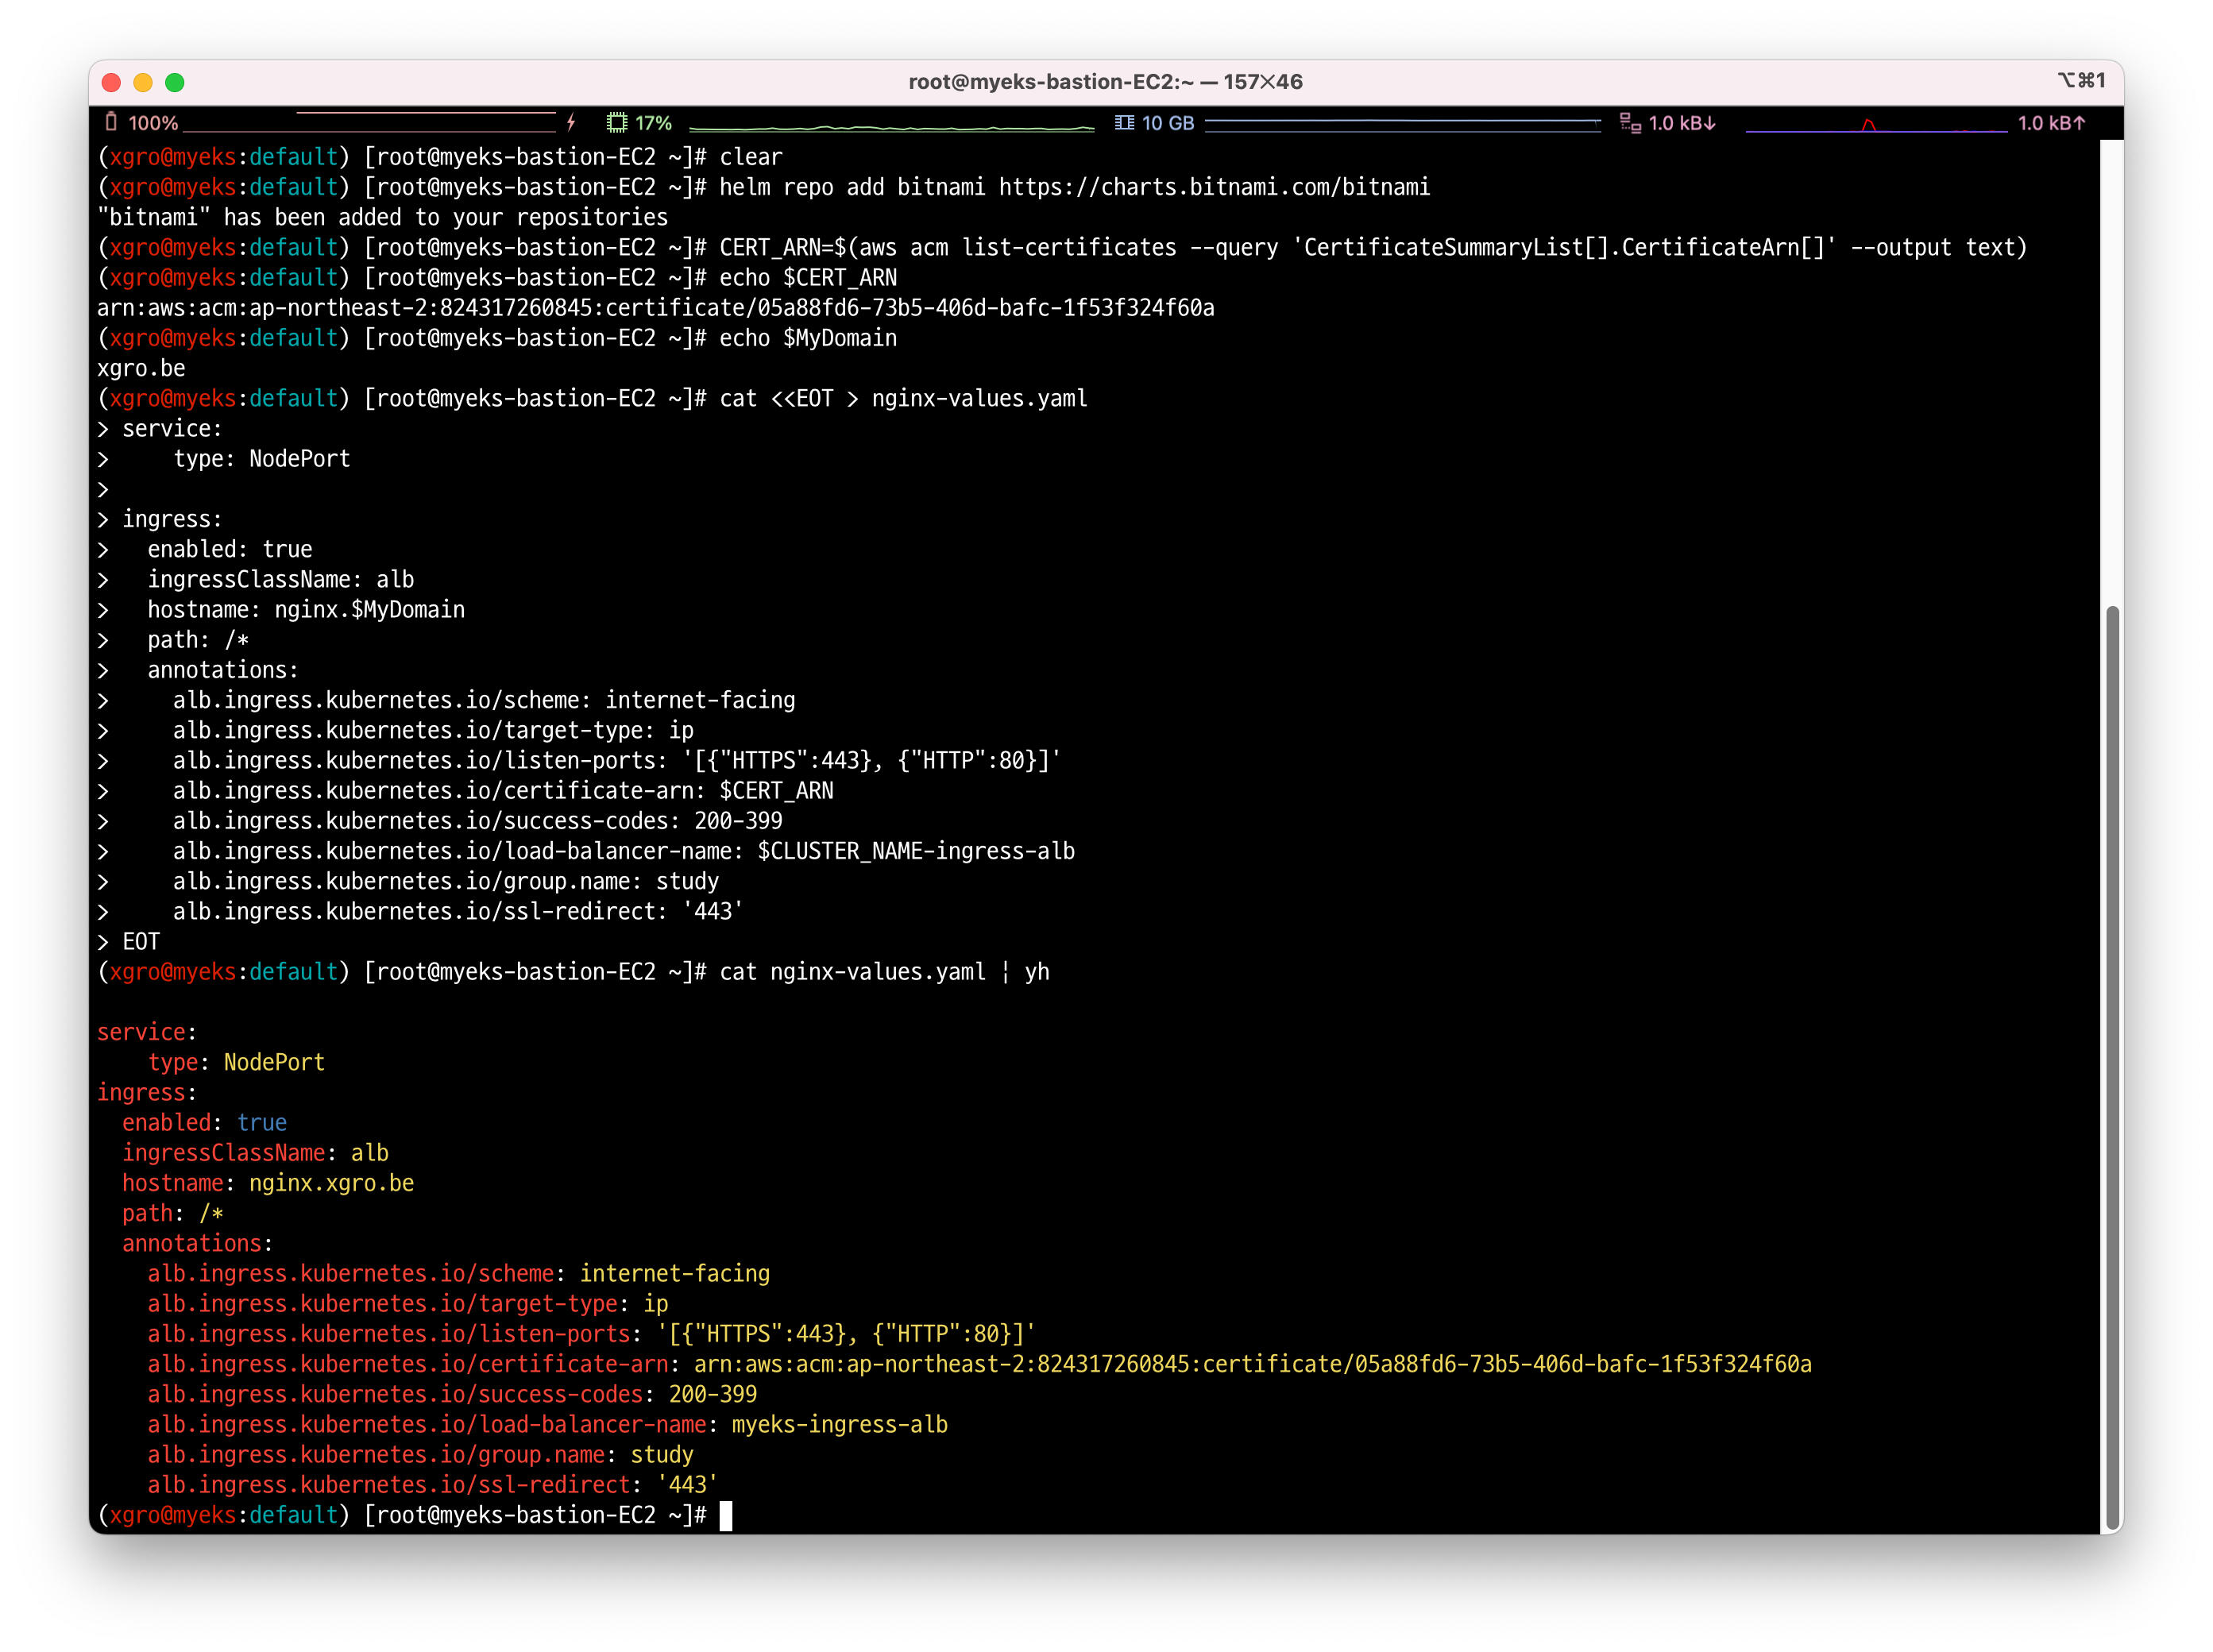
✅ NGINX 웹서버 배포 및 애플리케이션 모니터링 설정 및 접속
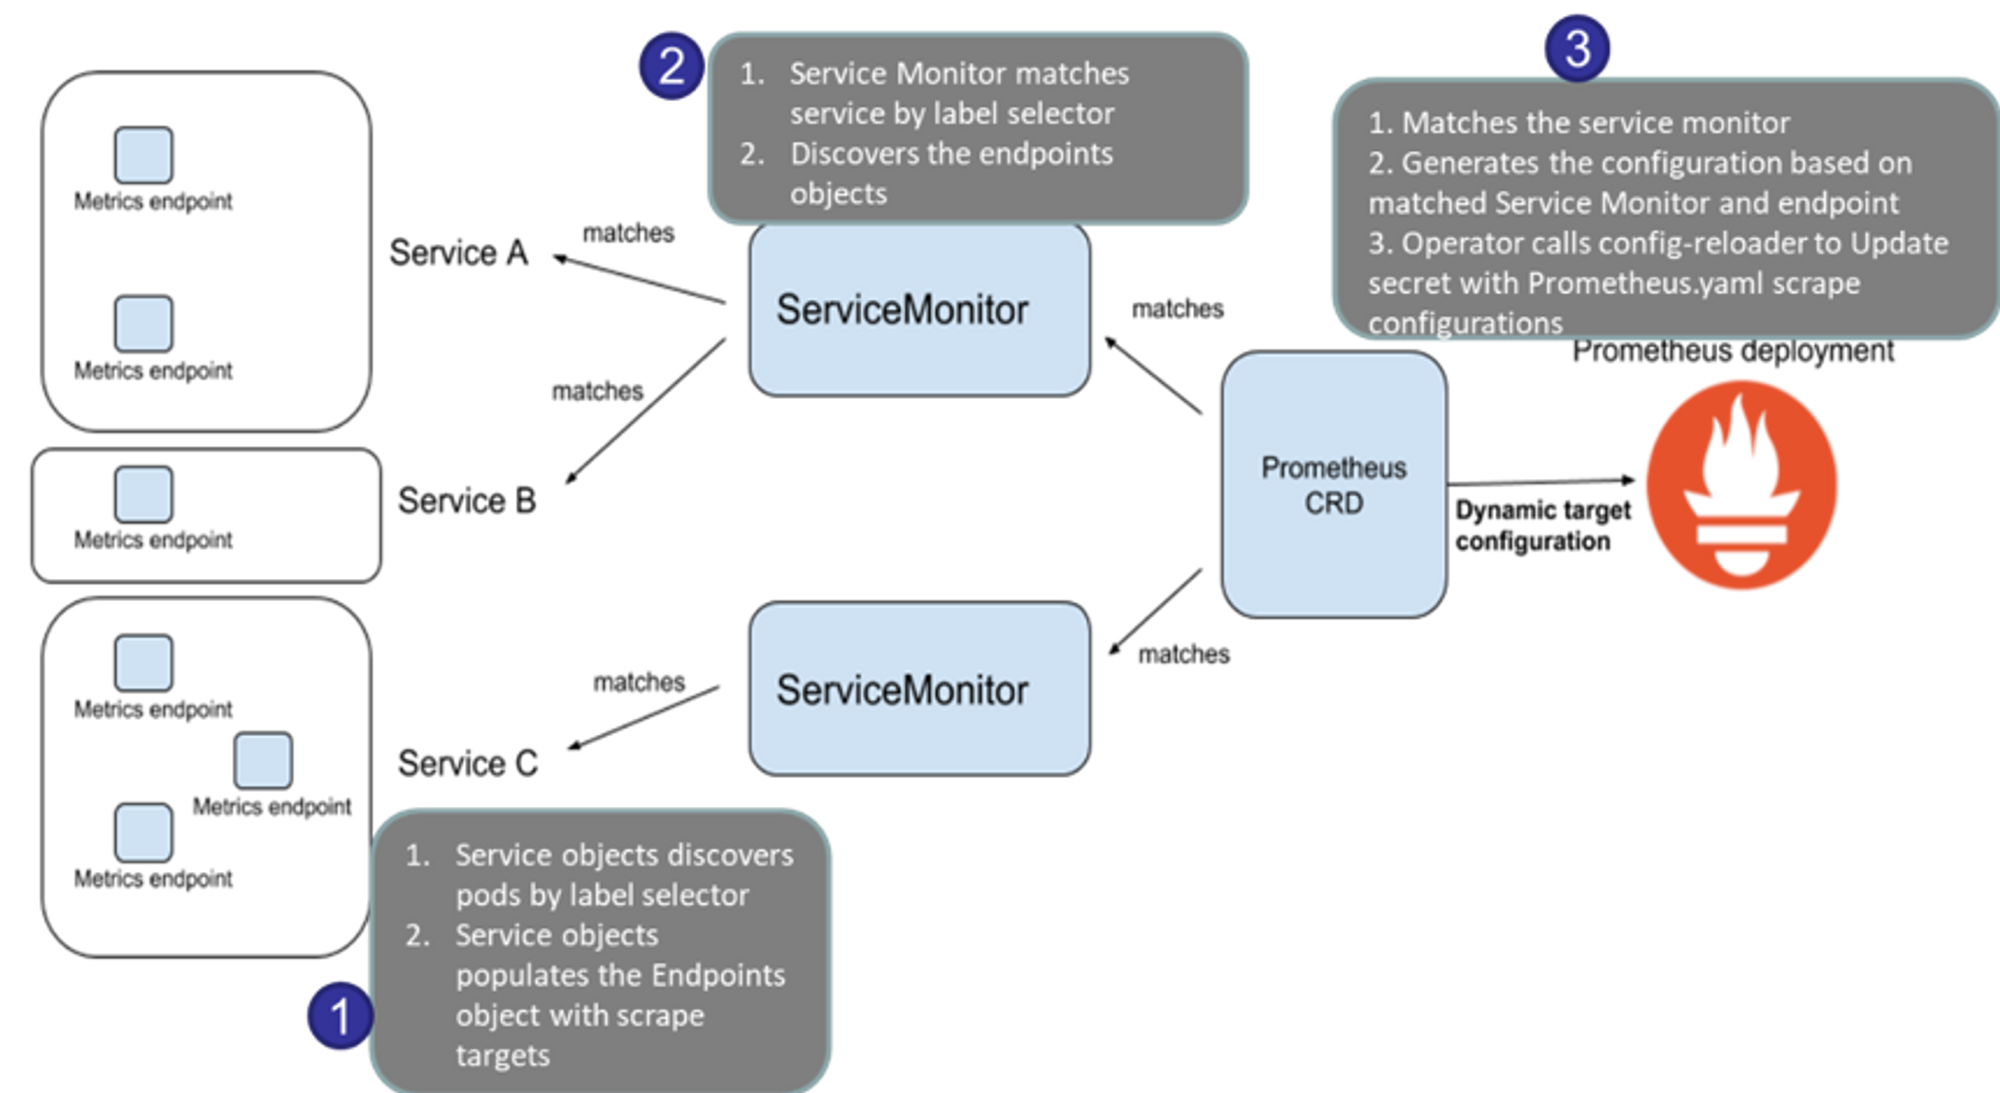
- nginx 를 helm 설치 시 프로메테우스 익스포터 Exporter 옵션 설정 시 자동으로 nginx 를 프로메테우스 모니터링에 등록 가능합니다.
- 프로메테우스 설정에서 nginx 모니터링 관련 내용을 서비스 모니터 CRD로 추가할 수 있습니다.
- 기존 애플리케이션 파드에 프로메테우스 모니터링을 추가하려면 사이드카 방식을 사용하며 exporter 컨테이너를 추가합니다.
- nginx 웹 서버(with helm)에 metrics 수집 설정을 추가합니다. - Helm
# 모니터링
watch -d kubectl get pod

# 파라미터 파일 생성 : 서비스 모니터 방식으로 nginx 모니터링 대상을 등록하고, export 는 9113 포트 사용, nginx 웹서버 노출은 AWS CLB 기본 사용
cat <<EOT > ~/nginx_metric-values.yaml
metrics:
  enabled: true

  service:
    port: 9113

  serviceMonitor:
    enabled: true
    namespace: monitoring
    interval: 10s
EOT

# 배포
helm upgrade nginx bitnami/nginx --reuse-values -f nginx_metric-values.yaml

# 확인
kubectl get pod,svc,ep
kubectl get servicemonitor -n monitoring nginx
kubectl get servicemonitor -n monitoring nginx -o json | jq

# 메트릭 확인 >> 프로메테우스에서 Target 확인
NGINXIP=$(kubectl get pod -l app.kubernetes.io/instance=nginx -o jsonpath={.items[0].status.podIP})
curl -s http://$NGINXIP:9113/metrics # nginx_connections_active Y 값 확인해보기
curl -s http://$NGINXIP:9113/metrics | grep ^nginx_connections_active

# nginx 파드내에 컨테이너 갯수 확인
kubectl get pod -l app.kubernetes.io/instance=nginx
kubectl describe pod -l app.kubernetes.io/instance=nginx

# 접속 주소 확인 및 접속
echo -e "Nginx WebServer URL = https://nginx.$MyDomain"
curl -s https://nginx.$MyDomain
kubectl logs deploy/nginx -f

# 반복 접속
while true; do curl -s https://nginx.$MyDomain -I | head -n 1; date; sleep 1; done
서비스 모니터링 생성 후 1분 정도 후에 프로메테우스 웹서버에서 State → Targets 에 nginx 서비스 모니터 추가되는것을 확인할 수 있습니다.
그라파나에
12708대시보드 추가하여 모니터링을 확인합니다.

📌 Reference
-
Botkube - https://botkube.io/