
📌 Notice
Istio Hands-on Study (=Istio)
직접 실습을 통해 Isito를 배포 및 설정하는 내용을 정리한 블로그입니다.
CloudNetaStudy그룹에서 스터디를 진행하고 있습니다.
Gasida님께 다시한번 🙇 감사드립니다.
EKS 관련 이전 스터디 내용은 아래 링크를 통해 확인할 수 있습니다.
📌 Overview
이번 스터디에서는 운영 환경에서 발생하는 문제를 빠르게 감지하고 정확히 진단하기 위한 관측 가능성의 핵심 구성 요소들을 Istio 기반으로 학습합니다.
서비스 장애는 장애 그 자체보다, 늦은 감지와 잘못된 대응이 더 큰 피해로 이어집니다.
이를 방지하기 위해선 서비스 간 트래픽 흐름, 응답 지연, 오류율 등을 정량적으로 분석하고 시각적으로 파악할 수 있는 체계가 필요합니다.
Istio는 Envoy 사이드카 프록시 기반으로 강력한 메트릭 수집과 트래픽 추적 기능을 제공하며, Kiali, Prometheus, Jaeger 등과 연동하여 클러스터 내부의 흐름을 투명하게 보여줍니다.
이 글을 읽으신 후에는:
- 서비스 간 요청 수, 오류율, 지연 시간 등을 실시간으로 관찰하는 방법을 이해하실 수 있습니다
- 분산 트레이싱을 통해 요청의 흐름과 병목 구간을 파악하는 실습을 경험하실 수 있습니다
- 시각화 도구(Kiali)를 활용해 서비스 맵을 구성하고 의존 관계를 파악하는 능력을 갖추게 됩니다
- 이상 징후를 사전에 감지하고 대응할 수 있는 관측 체계를 직접 구성해볼 수 있습니다
무엇보다 복잡한 마이크로서비스 환경에서 관측 가능성을 확보한다는 것이 어떤 의미인지, 그리고 그 효과가 실무에 어떤 식으로 반영되는지 실제로 체감할 수 있을 것입니다.
📌 Istio 메트릭 완전 정복: 수집부터 커스터마이징, 확장까지
Istio는 서비스 간 트래픽을 가로채면서 풍부한 메트릭 데이터를 생성합니다.
이 장에서는 Istio에서 제공하는 표준 메트릭을 어떻게 수집하고, 커스터마이징하며,
나아가 도메인에 특화된 지표로 확장할 수 있는지를 실습을 통해 단계별로 살펴봅니다.
👉 Step 00. 실습 환경 구성
[실습 환경 구성] k8s(1.23.17) 배포 : NodePort(30000 HTTP, 30005 HTTPS)
먼저, 실습 환경을 구성하기 위해 Kubernetes 클러스터와 Istio를 설치합니다.
실습에서는 Kind를 사용하여 로컬에 Kubernetes 클러스터를 생성합니다.
#
git clone https://github.com/AcornPublishing/istio-in-action
cd istio-in-action/book-source-code-master
pwd # 각자 자신의 pwd 경로
code .

# 아래 extramounts 생략 시, myk8s-control-plane 컨테이너 sh/bash 진입 후 직접 git clone 가능
kind create cluster --name myk8s --image kindest/node:v1.23.17 --config - <<EOF
kind: Cluster
apiVersion: kind.x-k8s.io/v1alpha4
nodes:
- role: control-plane
  extraPortMappings:
  - containerPort: 30000 # Sample Application (istio-ingrssgateway) HTTP
    hostPort: 30000
  - containerPort: 30001 # Prometheus
    hostPort: 30001
  - containerPort: 30002 # Grafana
    hostPort: 30002
  - containerPort: 30003 # Kiali
    hostPort: 30003
  - containerPort: 30004 # Tracing
    hostPort: 30004
  - containerPort: 30005 # Sample Application (istio-ingrssgateway) HTTPS
    hostPort: 30005
  - containerPort: 30006 # TCP Route
    hostPort: 30006
  - containerPort: 30007 # kube-ops-view
    hostPort: 30007
  kubeadmConfigPatches:
  - |
    kind: ClusterConfiguration
    controllerManager:
      extraArgs:
        bind-address: 0.0.0.0
  extraMounts: # 해당 부분 생략 가능
  - hostPath: /Users/gasida/Downloads/istio-in-action/book-source-code-master # 각자 자신의 pwd 경로로 설정
    containerPath: /istiobook
networking:
  podSubnet: 10.10.0.0/16
  serviceSubnet: 10.200.1.0/24
EOF

# 설치 확인
docker ps

# 노드에 기본 툴 설치
docker exec -it myk8s-control-plane sh -c 'apt update && apt install tree psmisc lsof wget bridge-utils net-tools dnsutils tcpdump ngrep iputils-ping git vim -y'

# (옵션) kube-ops-view
helm repo add geek-cookbook https://geek-cookbook.github.io/charts/
helm install kube-ops-view geek-cookbook/kube-ops-view --version 1.2.2 --set service.main.type=NodePort,service.main.ports.http.nodePort=30007 --set env.TZ="Asia/Seoul" --namespace kube-system
kubectl get deploy,pod,svc,ep -n kube-system -l app.kubernetes.io/instance=kube-ops-view

## kube-ops-view 접속 URL 확인
open "http://localhost:30007/#scale=1.5"
open "http://localhost:30007/#scale=1.3"

# (옵션) metrics-server
helm repo add metrics-server https://kubernetes-sigs.github.io/metrics-server/
helm install metrics-server metrics-server/metrics-server --set 'args[0]=--kubelet-insecure-tls' -n kube-system
kubectl get all -n kube-system -l app.kubernetes.io/instance=metrics-server
[실습 환경 구성] istio 1.17.8 설치 (addon 필수)
# myk8s-control-plane 진입 후 설치 진행
docker exec -it myk8s-control-plane bash
-----------------------------------
# (옵션) 코드 파일들 마운트 확인
tree /istiobook/ -L 1
혹은
git clone ... /istiobook

# istioctl 설치
export ISTIOV=1.17.8
echo 'export ISTIOV=1.17.8' >> /root/.bashrc

curl -s -L https://istio.io/downloadIstio | ISTIO_VERSION=$ISTIOV sh -
cp istio-$ISTIOV/bin/istioctl /usr/local/bin/istioctl
istioctl version --remote=false

# default 프로파일 컨트롤 플레인 배포
istioctl install --set profile=default -y

# 빠져나오기
exit
-----------------------------------

# 설치 확인 : istiod, istio-ingressgateway, crd 등
kubectl get istiooperators -n istio-system -o yaml
kubectl get all,svc,ep,sa,cm,secret,pdb -n istio-system
kubectl get cm -n istio-system istio -o yaml
kubectl get crd | grep istio.io | sort

# 실습을 위한 네임스페이스 설정
kubectl create ns istioinaction
kubectl label namespace istioinaction istio-injection=enabled
kubectl get ns --show-labels

# istio-ingressgateway 서비스 : NodePort 변경 및 nodeport 지정 변경 , externalTrafficPolicy 설정 (ClientIP 수집)
kubectl patch svc -n istio-system istio-ingressgateway -p '{"spec": {"type": "NodePort", "ports": [{"port": 80, "targetPort": 8080, "nodePort": 30000}]}}'
kubectl patch svc -n istio-system istio-ingressgateway -p '{"spec": {"type": "NodePort", "ports": [{"port": 443, "targetPort": 8443, "nodePort": 30005}]}}'
kubectl patch svc -n istio-system istio-ingressgateway -p '{"spec":{"externalTrafficPolicy": "Local"}}'
kubectl describe svc -n istio-system istio-ingressgateway


# 내부 접속 테스트용 netshoot 파드 생성
cat <<EOF | kubectl apply -f -
apiVersion: v1
kind: Pod
metadata:
  name: netshoot
spec:
  containers:
  - name: netshoot
    image: nicolaka/netshoot
    command: ["tail"]
    args: ["-f", "/dev/null"]
  terminationGracePeriodSeconds: 0
EOF
👉 Step 01. 관찰 가능성이란 무엇인가? (What is Observability?)
관찰 가능성(Observability)은 시스템의 외부에서 관찰 가능한 신호만을 통해 내부 상태를 이해하고 추론할 수 있는 능력을 의미합니다.
이는 단순한 운영 도구나 기술을 의미하는 것이 아니라, 시스템의 특성 자체를 가리킵니다.
이 개념은 제어 이론의 대가 루돌프 칼만(Rudolf E. Kalman)이 1960년에 발표한 논문 On the General Theory of Control Systems 에서 처음 정의되었으며, 오늘날 복잡한 분산 시스템에서 시스템의 안정성을 유지하고, 예기치 못한 문제 상황에 대응하기 위한 핵심 개념으로 자리잡고 있습니다.
시스템의 런타임 동작을 분석하고 제어 기능을 구현하려면, 먼저 시스템이 어떻게 작동하는지를 이해할 수 있어야 합니다. 이를 위해 Istio는 네트워크 계층에서 데이터를 수집하고, 복원력 확보와 정책 적용 같은 제어 기능을 실현할 수 있도록 돕습니다.
Istio는 애플리케이션 수준의 네트워크 계측을 보조할 수 있는 이상적인 위치에 존재합니다. 그러나 관찰 가능성이란 단지 Istio를 도입한다고 바로 얻어지는 것은 아닙니다.
네트워크 계측 외에도 애플리케이션 수준 계측, 시그널 수집 인프라, 로그와 트레이스 통합 등 다양한 수준의 데이터를 조합하여 전체 시스템의 그림을 그릴 수 있어야 합니다.
✅ 관찰 가능성과 모니터링의 차이
모니터링은 시스템 상태를 정의된 임계값과 비교하여 이상 여부를 판단하고 경고하는 전통적인 방법입니다.
예를 들어, 데이터베이스 디스크 사용량이 특정 기준을 넘어서면 알림을 통해 대응할 수 있습니다.
하지만 관찰 가능성은 이러한 모니터링보다 더 넓은 개념으로, 시스템의 알려지지 않은 문제까지 탐색할 수 있도록 설계되어야 합니다.
관찰 가능성은 사용자 ID, 요청 ID, 소스 IP 등 고카디널리티(high-cardinality)의 다양한 신호를 수집하고, 이를 기반으로 시스템 전반의 흐름과 상태를 탐색하는 능력을 포함합니다.
예를 들어, ID가 400000021인 사용자 홍길동이 장바구니 결제 도중 지연을 겪었을 때, 시스템의 기존 모니터링 지표가 모두 정상이라 하더라도 사용자는 나쁜 경험을 하게 됩니다.
관찰 가능성이 갖춰진 시스템이라면 요청 경로에 포함된 여러 계층을 따라가며 병목이나 지연 지점을 정확히 추적할 수 있습니다.
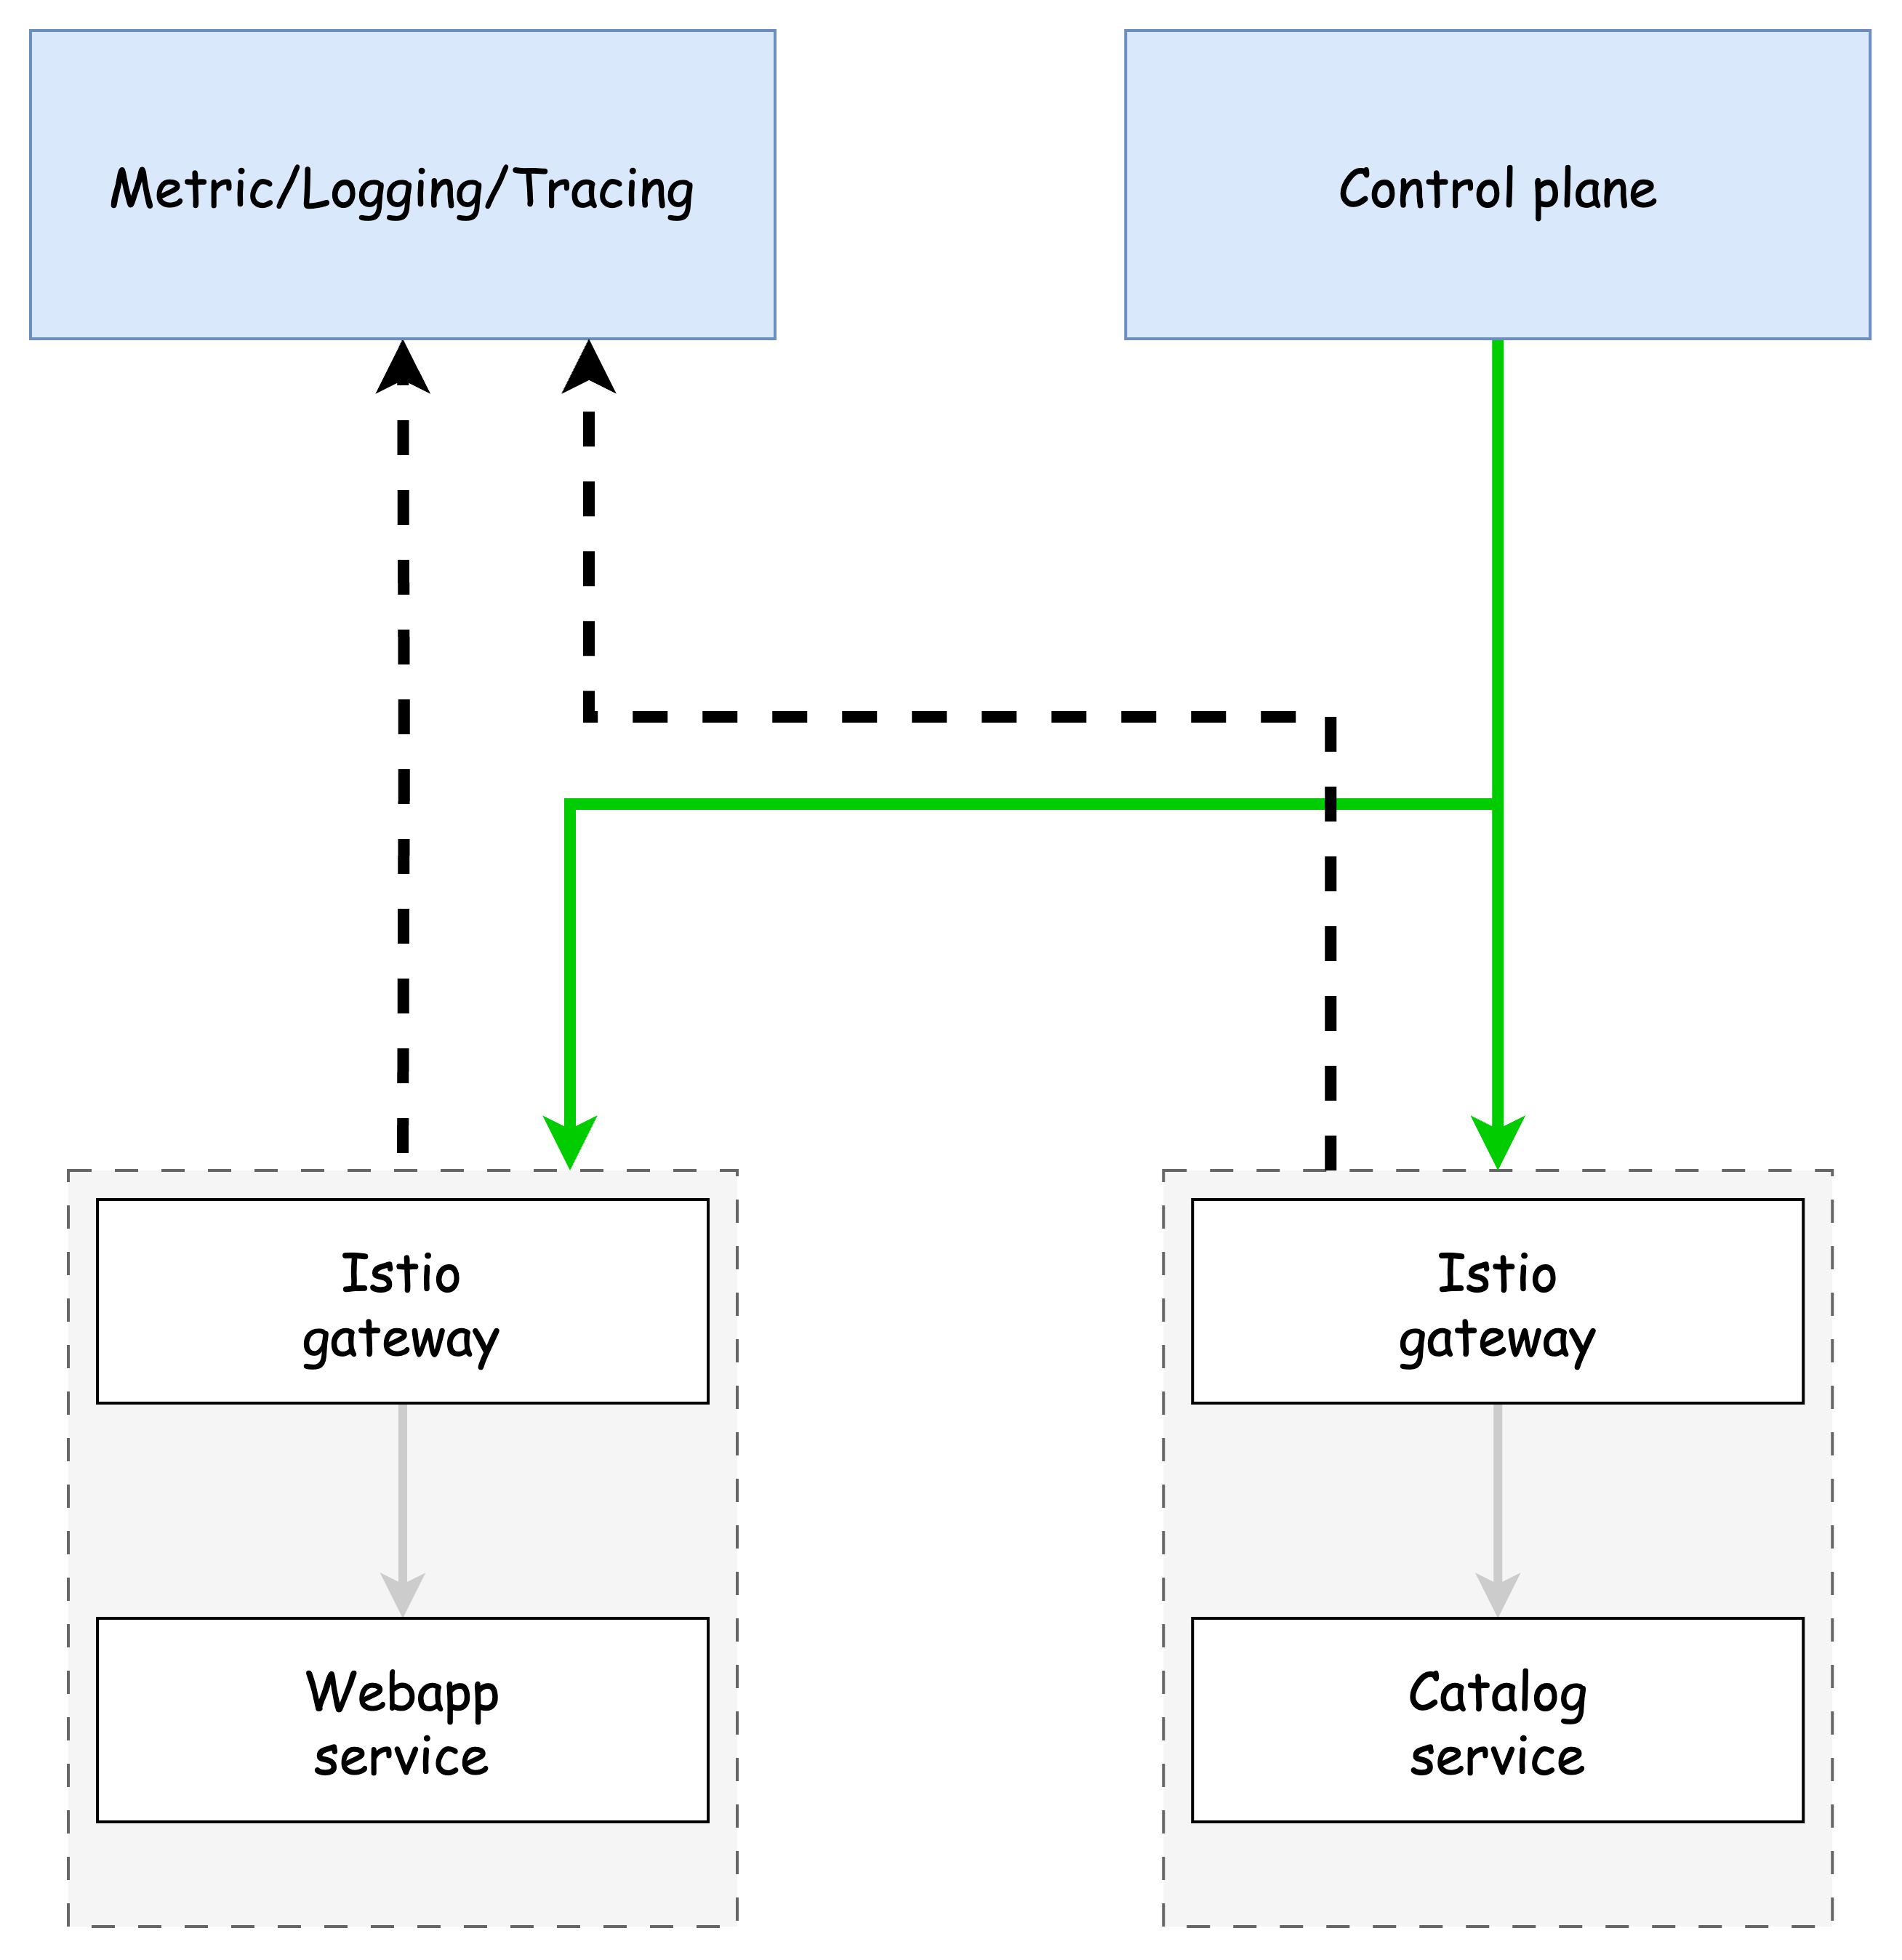
✅ Istio가 관찰 가능성을 돕는 방식
Istio는 Envoy 데이터 플레인 프록시를 통해 서비스 간 트래픽 흐름의 중요한 지점을 관찰할 수 있습니다.
이 프록시는 서비스 앞단에 배치되어 다음과 같은 메트릭을 수집합니다:
- 초당 요청 수
- 요청 지연 시간 (예: p95, p99)
- 실패한 요청 수
또한 Istio는 운영 중에도 새로운 메트릭을 동적으로 추가할 수 있으므로, 미처 고려하지 못했던 신호까지도 수집 대상이 될 수 있습니다.
요청 단위의 흐름을 추적하여 어떤 서비스가 호출되었고, 각 노드에서 처리에 걸린 시간을 분석함으로써 병목이나 장애 지점을 파악할 수 있습니다.
마지막으로, Istio는 기본적으로 Prometheus, Grafana, Kiali 등의 도구와 통합되어 메트릭 수집, 시각화, 서비스 간 흐름 탐색을 위한 기능도 제공합니다.
실습에서는 기본 데모 도구 대신 실제 운영에 가까운 설정을 사용합니다.
👉 Step 02. 이스티오 메트릭 살펴보기 (실습)
Istio의 관찰 가능성 기능은 데이터 플레인(Envoy)과 컨트롤 플레인(istiod) 양쪽에서 메트릭을 수집하여 실시간으로 시스템의 동작 상태를 파악할 수 있도록 돕습니다. 이 장에서는 각각의 영역에서 수집 가능한 메트릭의 종류와 활용 방법을 실습을 통해 알아봅니다.
✅ 데이터 플레인의 메트릭: Envoy에서 관찰 가능한 정보
Envoy는 커넥션, 요청, 그리고 런타임 메트릭 등 다양한 정보를 수집합니다. 이를 통해 서비스 간 통신 상태를 분석할 수 있으며, 다음과 같은 단계를 통해 확인할 수 있습니다.
💡 실습 환경 초기화 및 애플리케이션 배포
# 기존 리소스 제거
kubectl delete -n istioinaction deploy,svc,gw,vs,dr,envoyfilter --all

# catalog, webapp 앱 배포
kubectl apply -f services/catalog/kubernetes/catalog.yaml -n istioinaction
kubectl apply -f services/webapp/kubernetes/webapp.yaml -n istioinaction

# 게이트웨이 및 가상 서비스 설정
kubectl apply -f services/webapp/istio/webapp-catalog-gw-vs.yaml -n istioinaction

# 리소스 확인
kubectl get deploy,pod,svc,ep,gw,vs -n istioinaction

# 테스트 호출
curl -s http://webapp.istioinaction.io:30000
curl -s http://webapp.istioinaction.io:30000/api/catalog | jq
💡 사이드카 프록시 메트릭 확인
# 프록시 상태 확인
istioctl proxy-status

# Envoy 통계 확인 (프록시 내부 HTTP 엔드포인트 사용)
kubectl exec -it deploy/catalog -c istio-proxy -n istioinaction -- curl localhost:15000/stats
kubectl exec -it deploy/webapp -c istio-proxy -n istioinaction -- curl localhost:15000/stats
이 때 수집되는 대표 메트릭은 다음과 같습니다:
istio_requests_total: 요청 수 (counter)istio_request_duration_milliseconds: 요청 지연 시간 (distribution)istio_request_bytes,istio_response_bytes: HTTP 바디 크기
이러한 메트릭을 통해 요청이 얼마나 있었고, 어느 정도의 응답 시간이 소요되었는지 파악할 수 있습니다.
<Image: Envoy proxy에서 메트릭 확인하는 curl 결과 예시>
고급 통계 활성화: 더 많은 Envoy 메트릭 보기
프록시는 기본적으로 필요한 메트릭만 수집하지만, 특정 클러스터나 업스트림 요청에 대한 상세한 통계를 보고 싶다면 다음 두 가지 방법 중 하나를 선택할 수 있습니다:
방법 1: IstioOperator에 포함하여 메시 전체에 적용
apiVersion: install.istio.io/v1alpha1
kind: IstioOperator
metadata:
  name: control-plane
spec:
  profile: demo
  meshConfig:
    defaultConfig:
      proxyStatsMatcher:
        inclusionPrefixes:
        - "cluster.outbound|80||catalog.istioinaction"
⚠️ 이 방법은 모든 워크로드에 적용되므로, 메트릭 양이 많아질 수 있어 주의가 필요합니다.
방법 2: Deployment의 애노테이션으로 워크로드 단위 설정 (권장)
template:
  metadata:
    annotations:
      proxy.istio.io/config: |-
        proxyStatsMatcher:
          inclusionPrefixes:
          - "cluster.outbound|80||catalog.istioinaction"
    labels:
      app: webapp
kubectl apply -n istioinaction -f ch7/webapp-deployment-stats-inclusion.yaml
이후 메트릭 확인:
# 적용 후 확인
curl -s http://webapp.istioinaction.io:30000/api/catalog | jq
kubectl exec -it deploy/webapp -c istio-proxy -n istioinaction -- curl localhost:15000/stats | grep catalog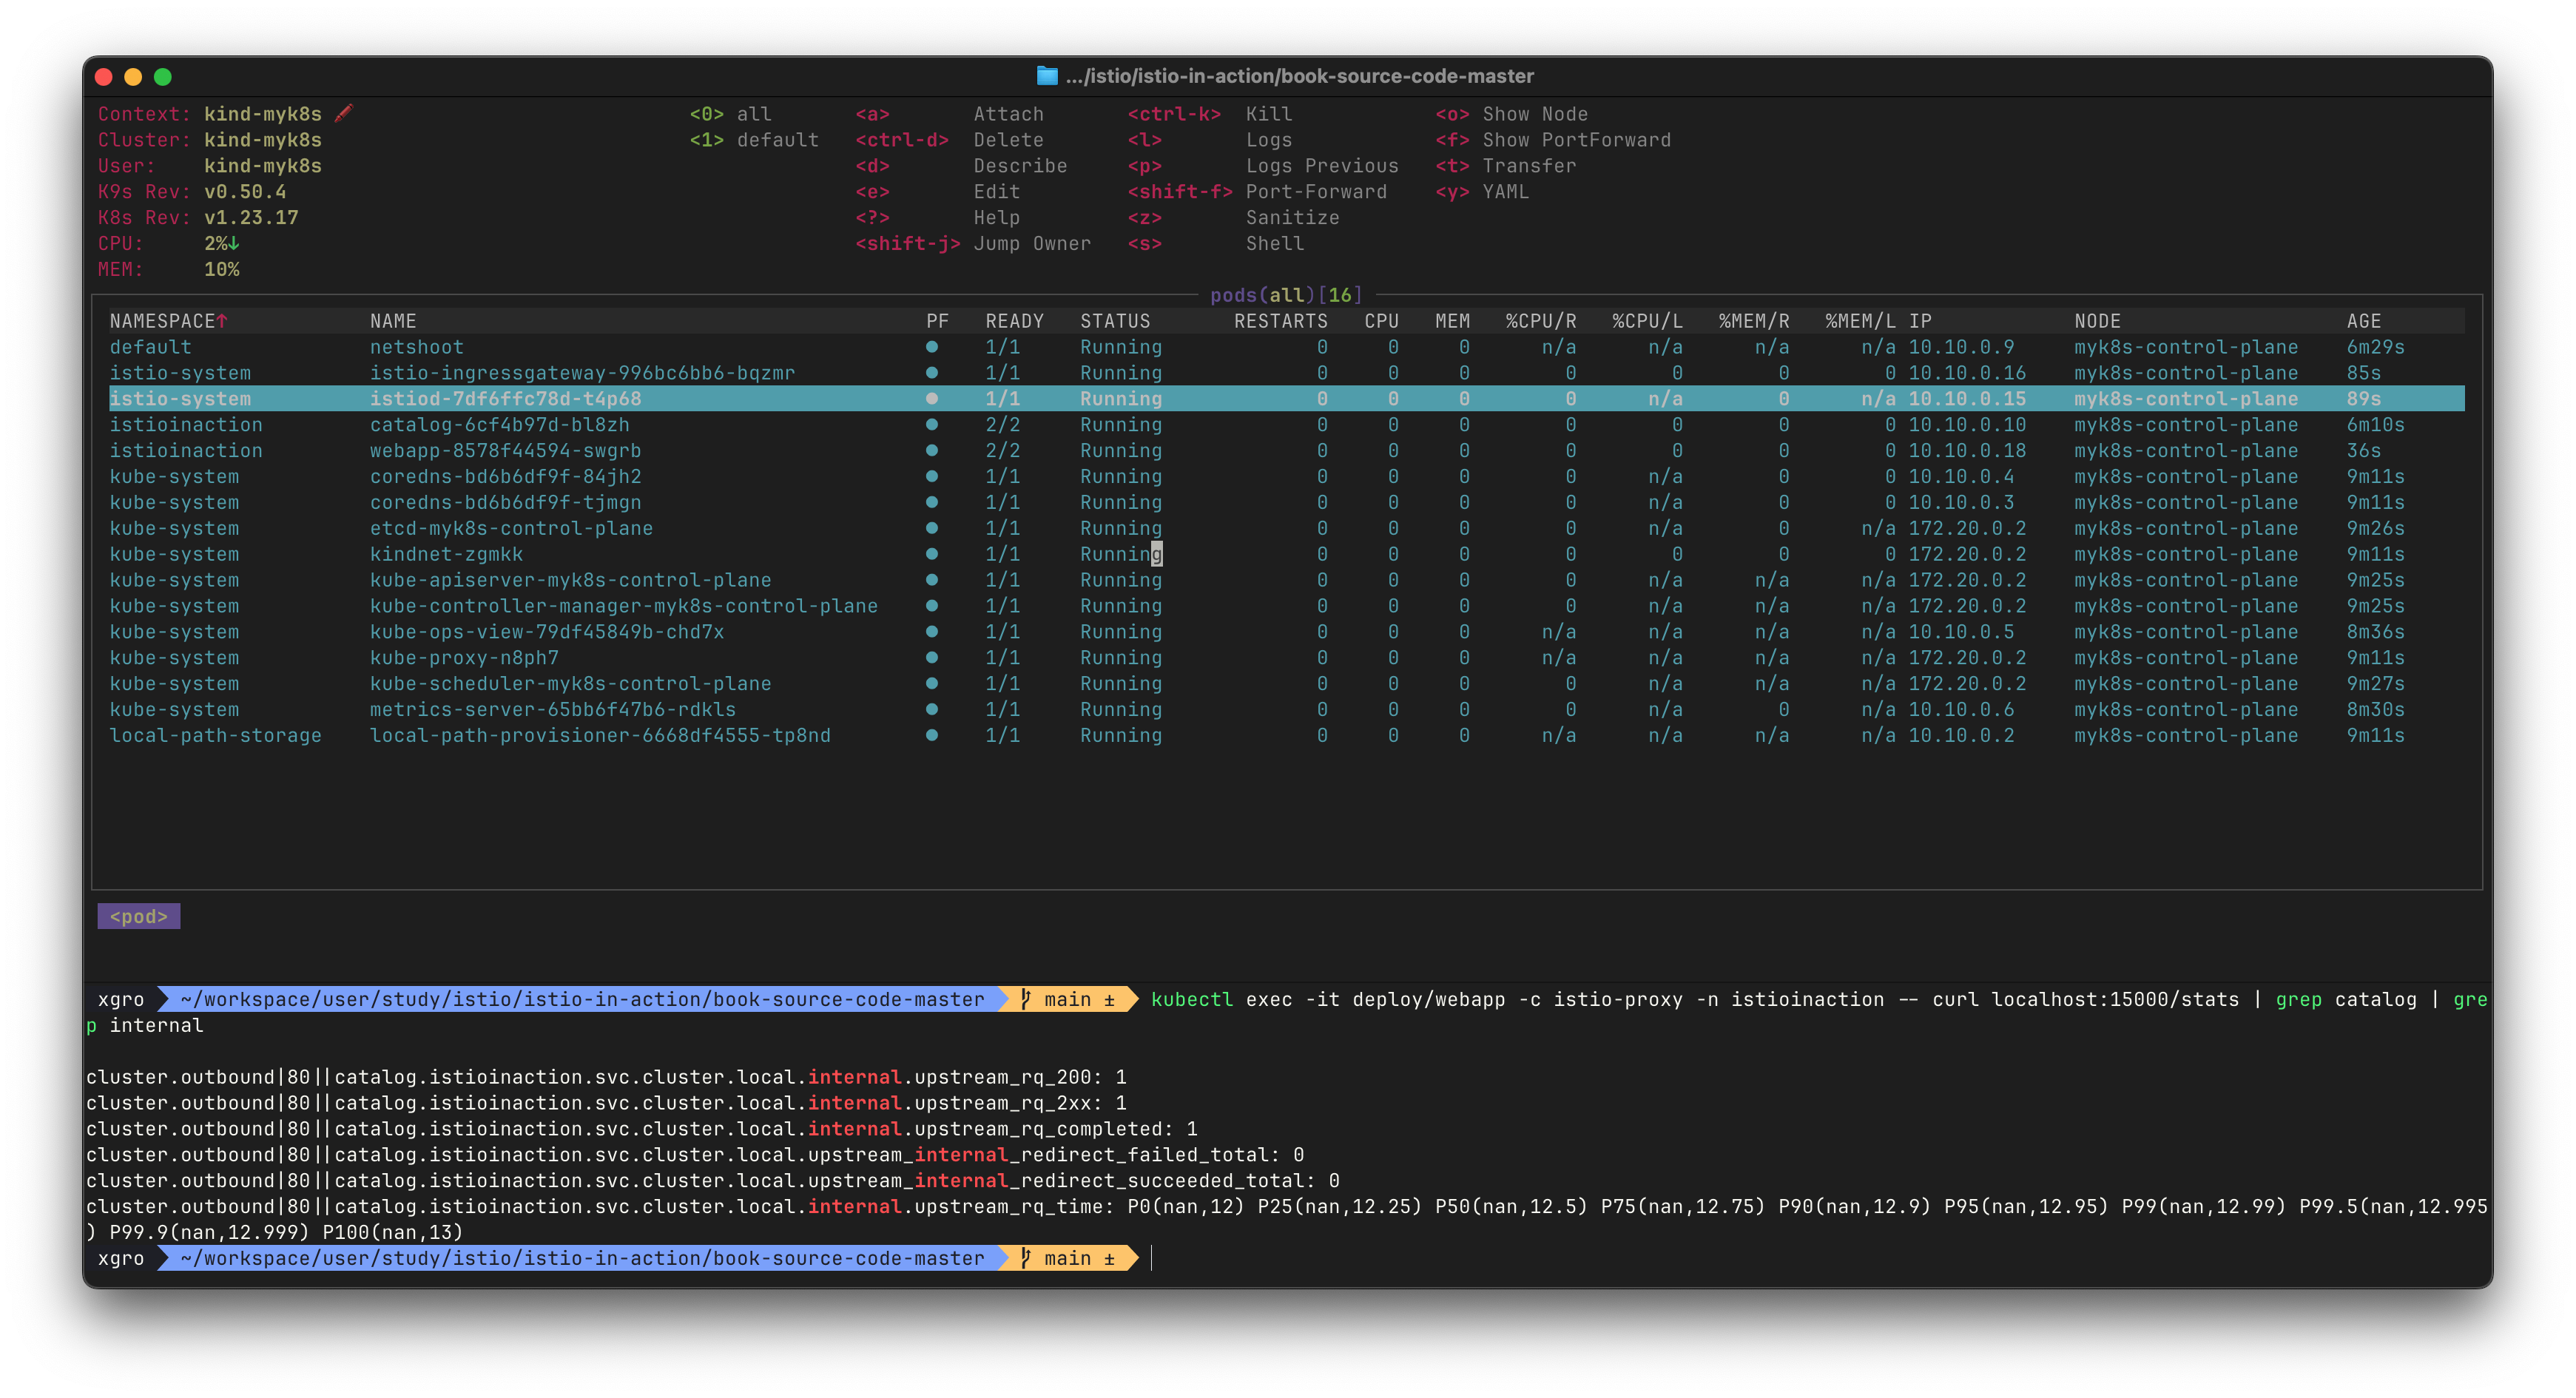
✅ 컨트롤 플레인의 메트릭: Istiod에서 수집 가능한 정보
컨트롤 플레인의 istiod는 인증서 발급, 설정 동기화, 서비스 등록 등 다양한 작업에 대한 메트릭을 제공합니다.
# 메트릭 확인
kubectl exec -it deploy/istiod -n istio-system -- curl localhost:15014/metrics | grep citadel
kubectl exec -it deploy/istiod -n istio-system -- curl localhost:15014/metrics | grep istio_build
kubectl exec -it deploy/istiod -n istio-system -- curl localhost:15014/metrics | grep pilot_proxy_convergence_time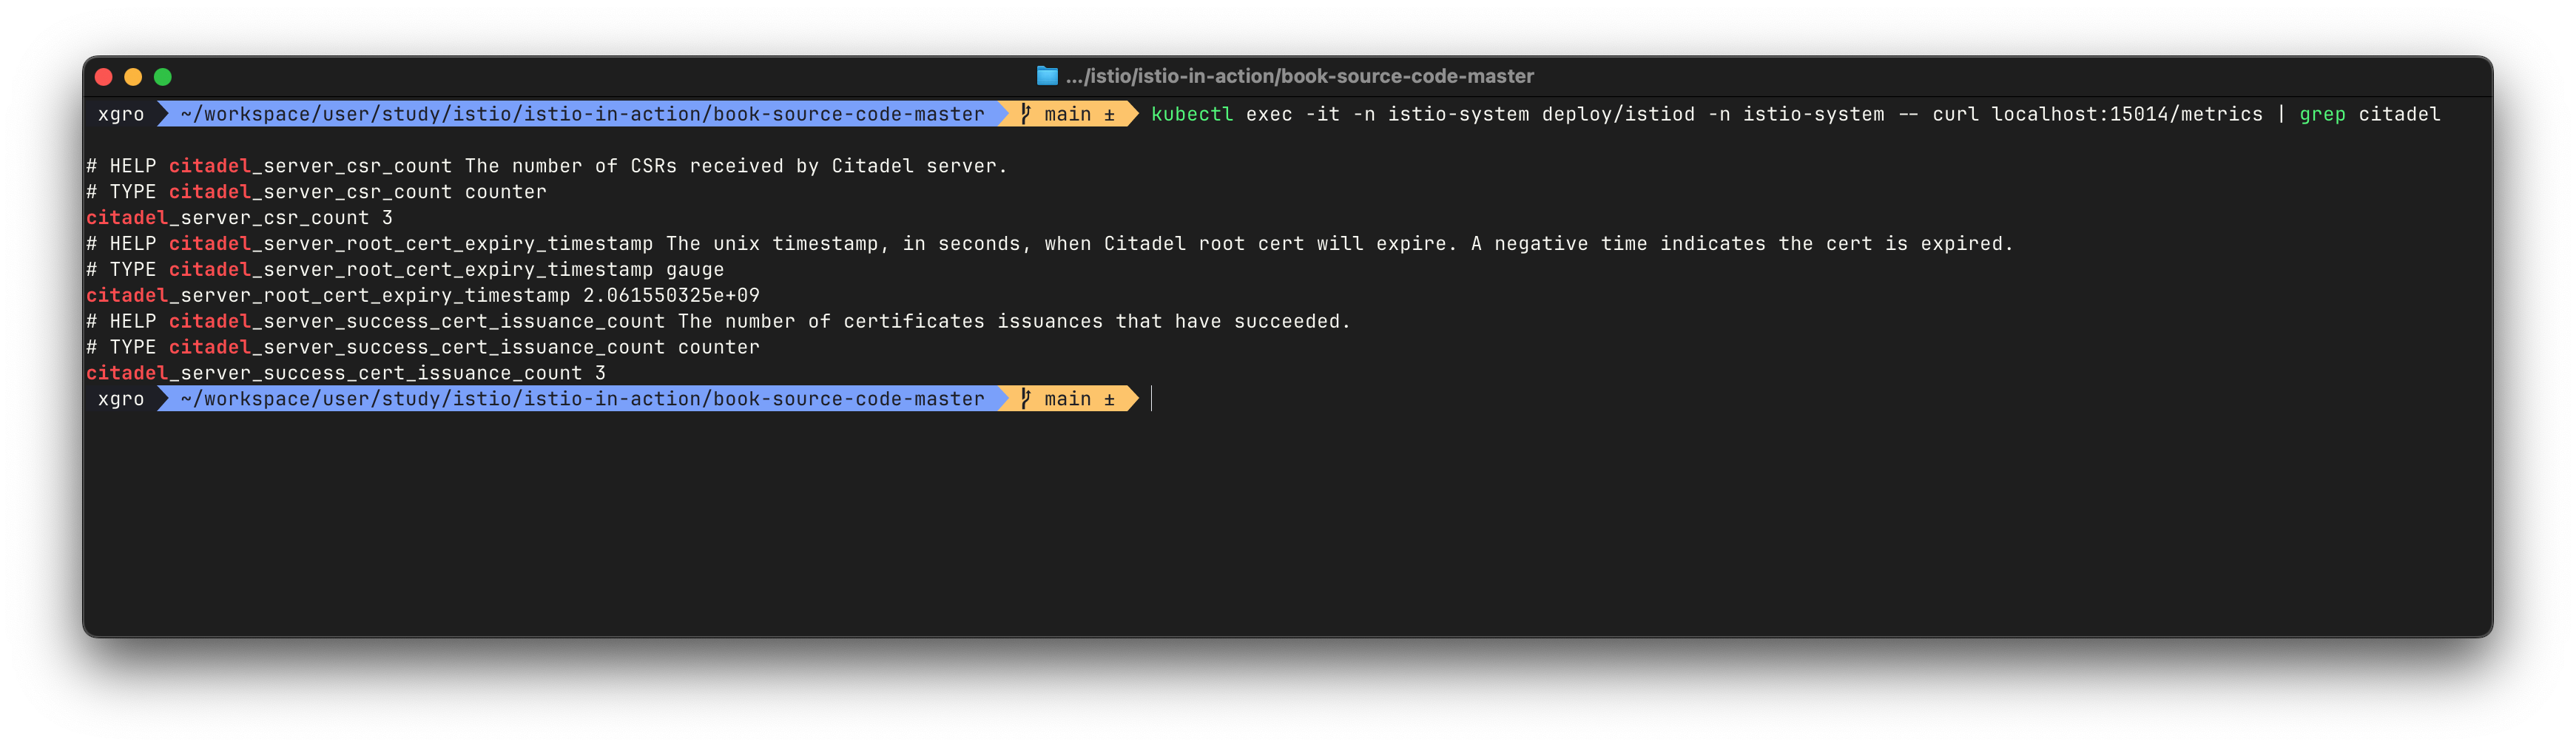
예를 들어 다음과 같은 메트릭이 있습니다:
citadel_server_csr_count: 인증서 발급 요청 수pilot_services: 컨트롤 플레인에서 인식 중인 서비스 개수pilot_proxy_convergence_time: 설정 전파 시간pilot_xds_pushes{type="cds"}: CDS 등의 설정 갱신 횟수
이러한 정보를 통해 프록시와 컨트롤 플레인 간 설정 동기화의 안정성과 속도를 확인할 수 있습니다.
데이터 플레인과 컨트롤 플레인의 메트릭을 종합적으로 확인하면, 단순한 요청 성공 여부를 넘어서 시스템이 어떻게 동작하고 있는지를 깊이 이해할 수 있습니다. Envoy 프록시가 보유한 풍부한 메트릭과 istiod의 운영 정보는 관찰 가능한 시스템을 구축하기 위한 핵심 자원이 됩니다.
컨트롤 플레인의 메트릭
컨트롤 플레인인 istiod는 서비스 메시 내 다양한 작업에 대한 정보를 메트릭 형태로 제공합니다. 주요 메트릭으로는 데이터 플레인과의 동기화 상태, 인증서 발급 상태, 버전 정보, xDS 업데이트 횟수 등이 포함됩니다.
💡 Istiod에서 수집 가능한 대표 메트릭
- 설정 동기화 시 프록시로의 전파 시간 분포
- CSR(Certificate Signing Request) 수 및 발급 성공 횟수
- Pilot 컴포넌트가 알고 있는 서비스 개수, VirtualService 개수
- xDS API의 동기화 횟수 (CDS, EDS, RDS, LDS)
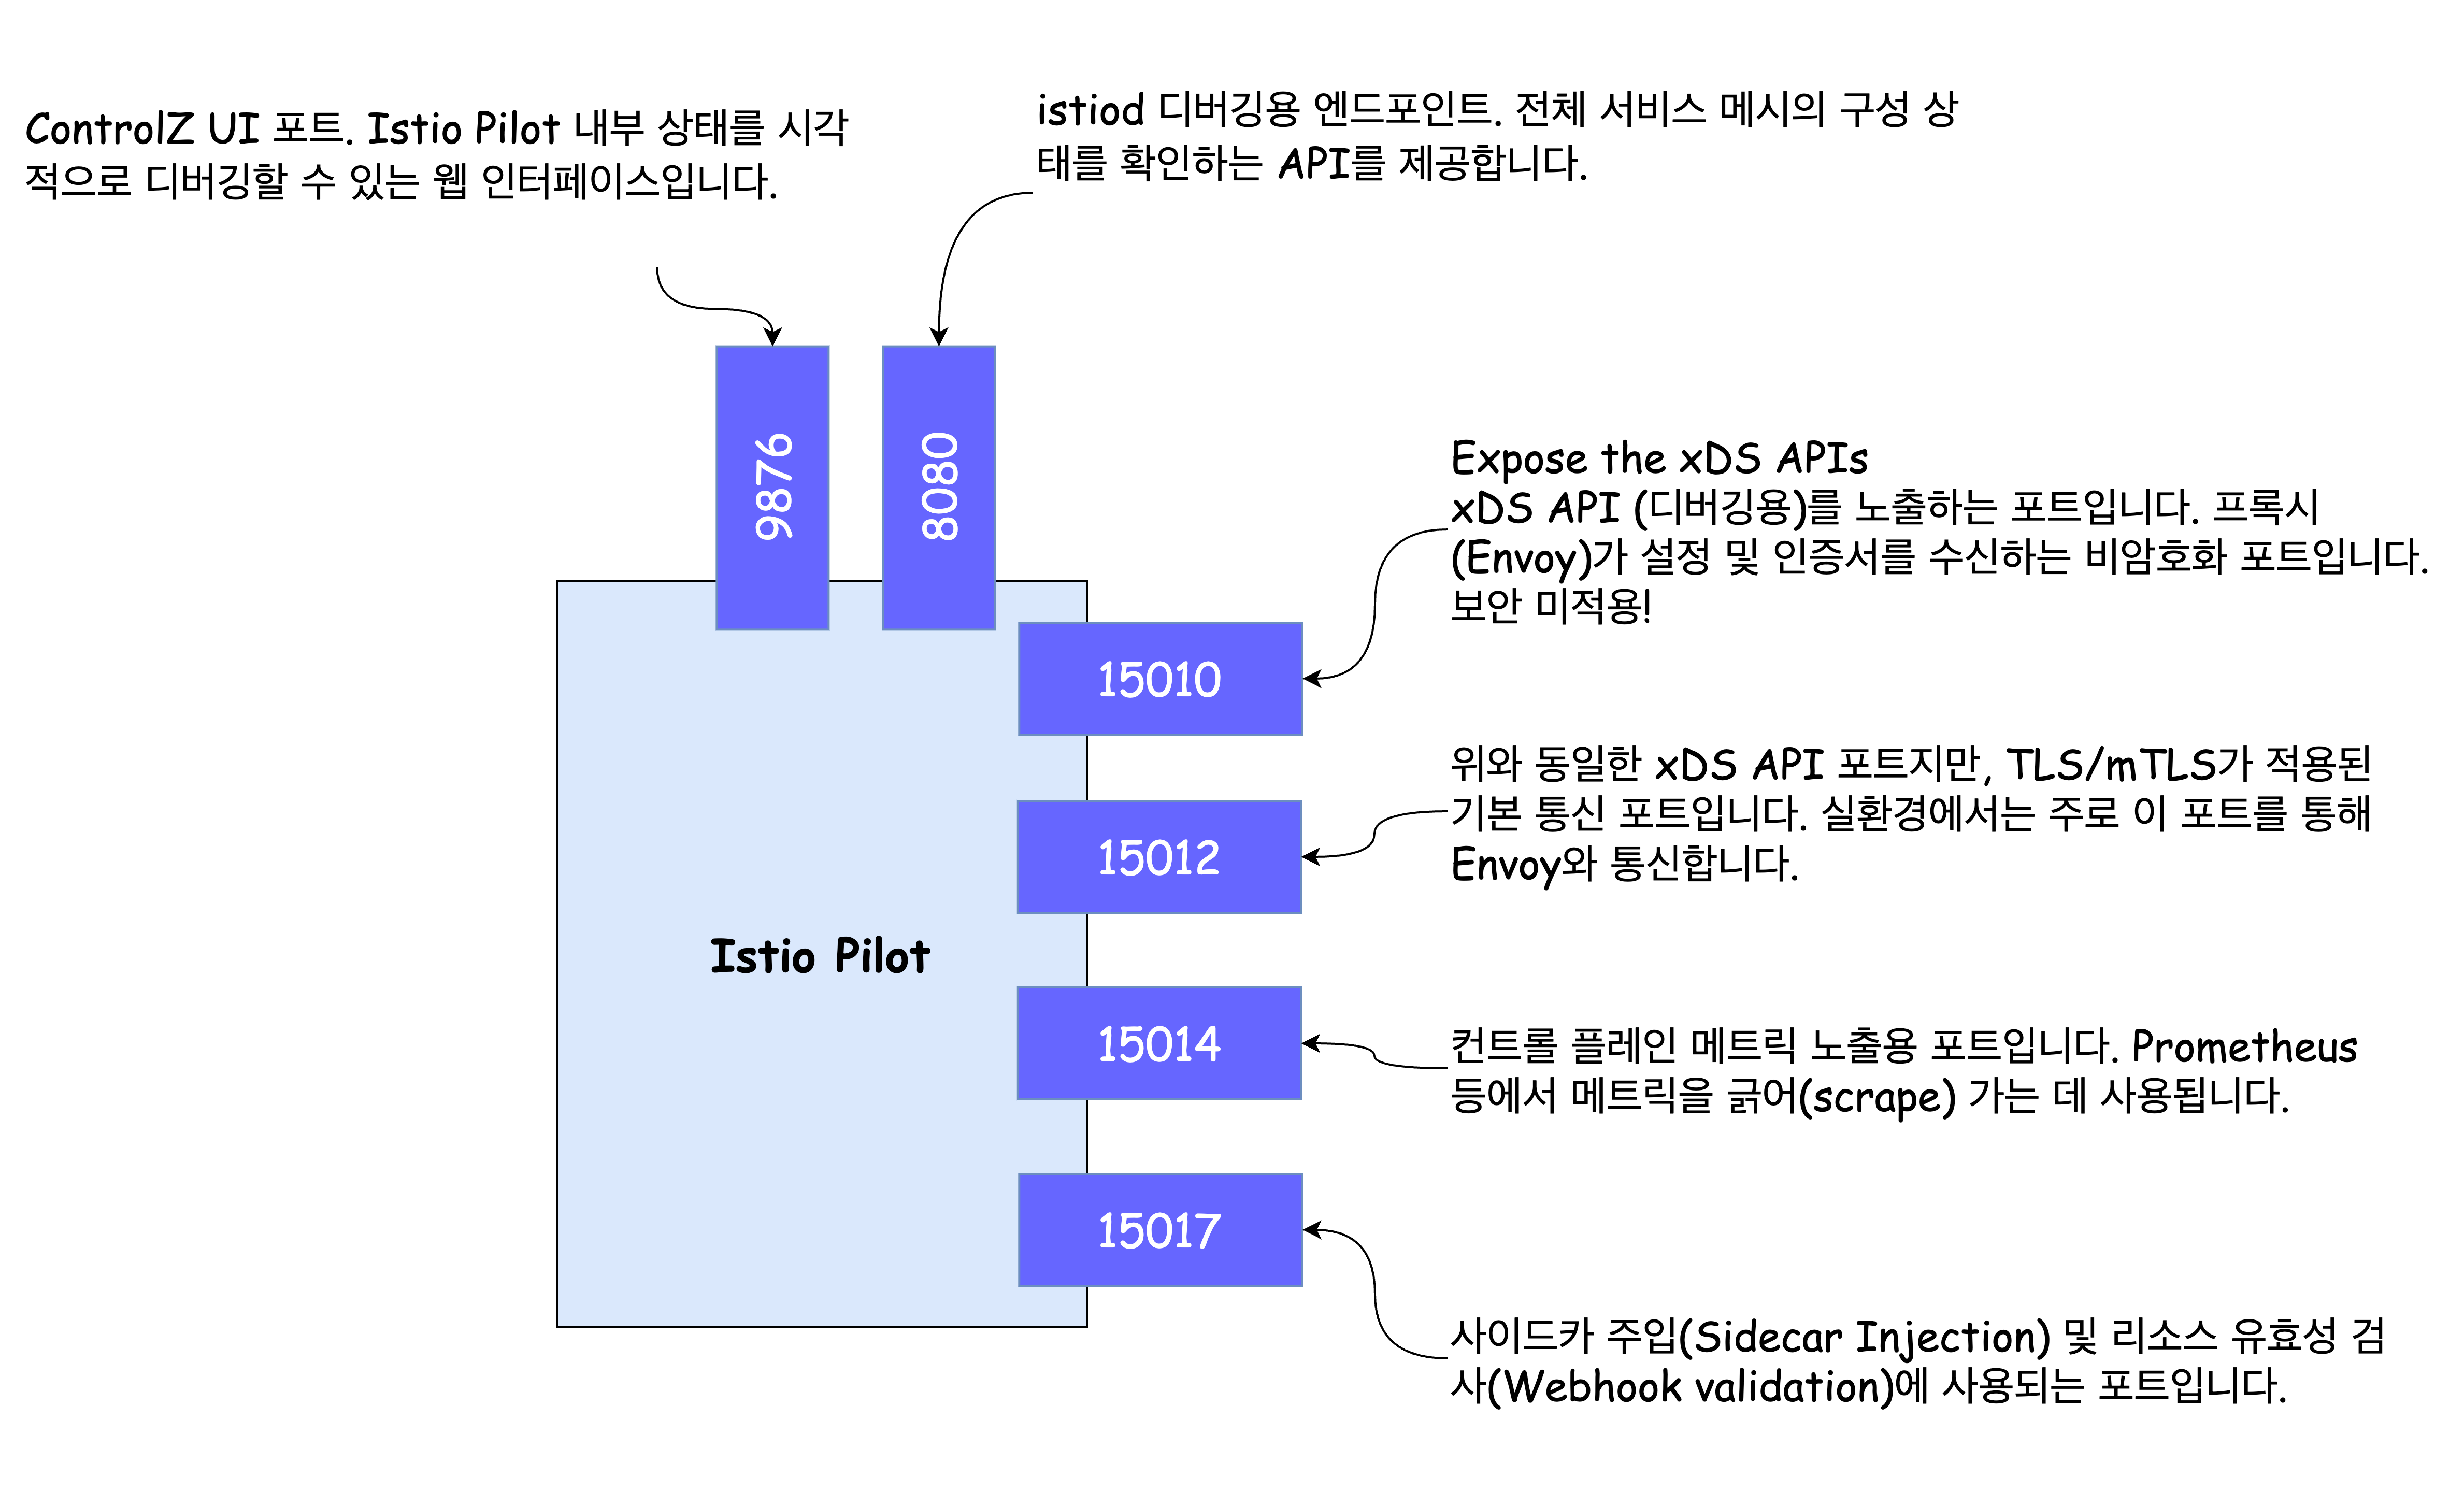
💡 메트릭 확인을 위한 기본 포트 탐색
kubectl exec -it deploy/istiod -n istio-system -- netstat -tnlistiod의 메트릭 포트는 15014입니다. 다음 명령어를 통해 실제 수집된 메트릭을 확인할 수 있습니다.
💡 Citadel 관련 인증서 메트릭 확인
kubectl exec -it deploy/istiod -n istio-system -- curl localhost:15014/metrics | grep citadelcitadel_server_csr_count: 인증서 발급 요청 수citadel_server_success_cert_issuance_count: 성공적으로 발급된 인증서 수citadel_server_root_cert_expiry_timestamp: 루트 인증서 만료 타임스탬프
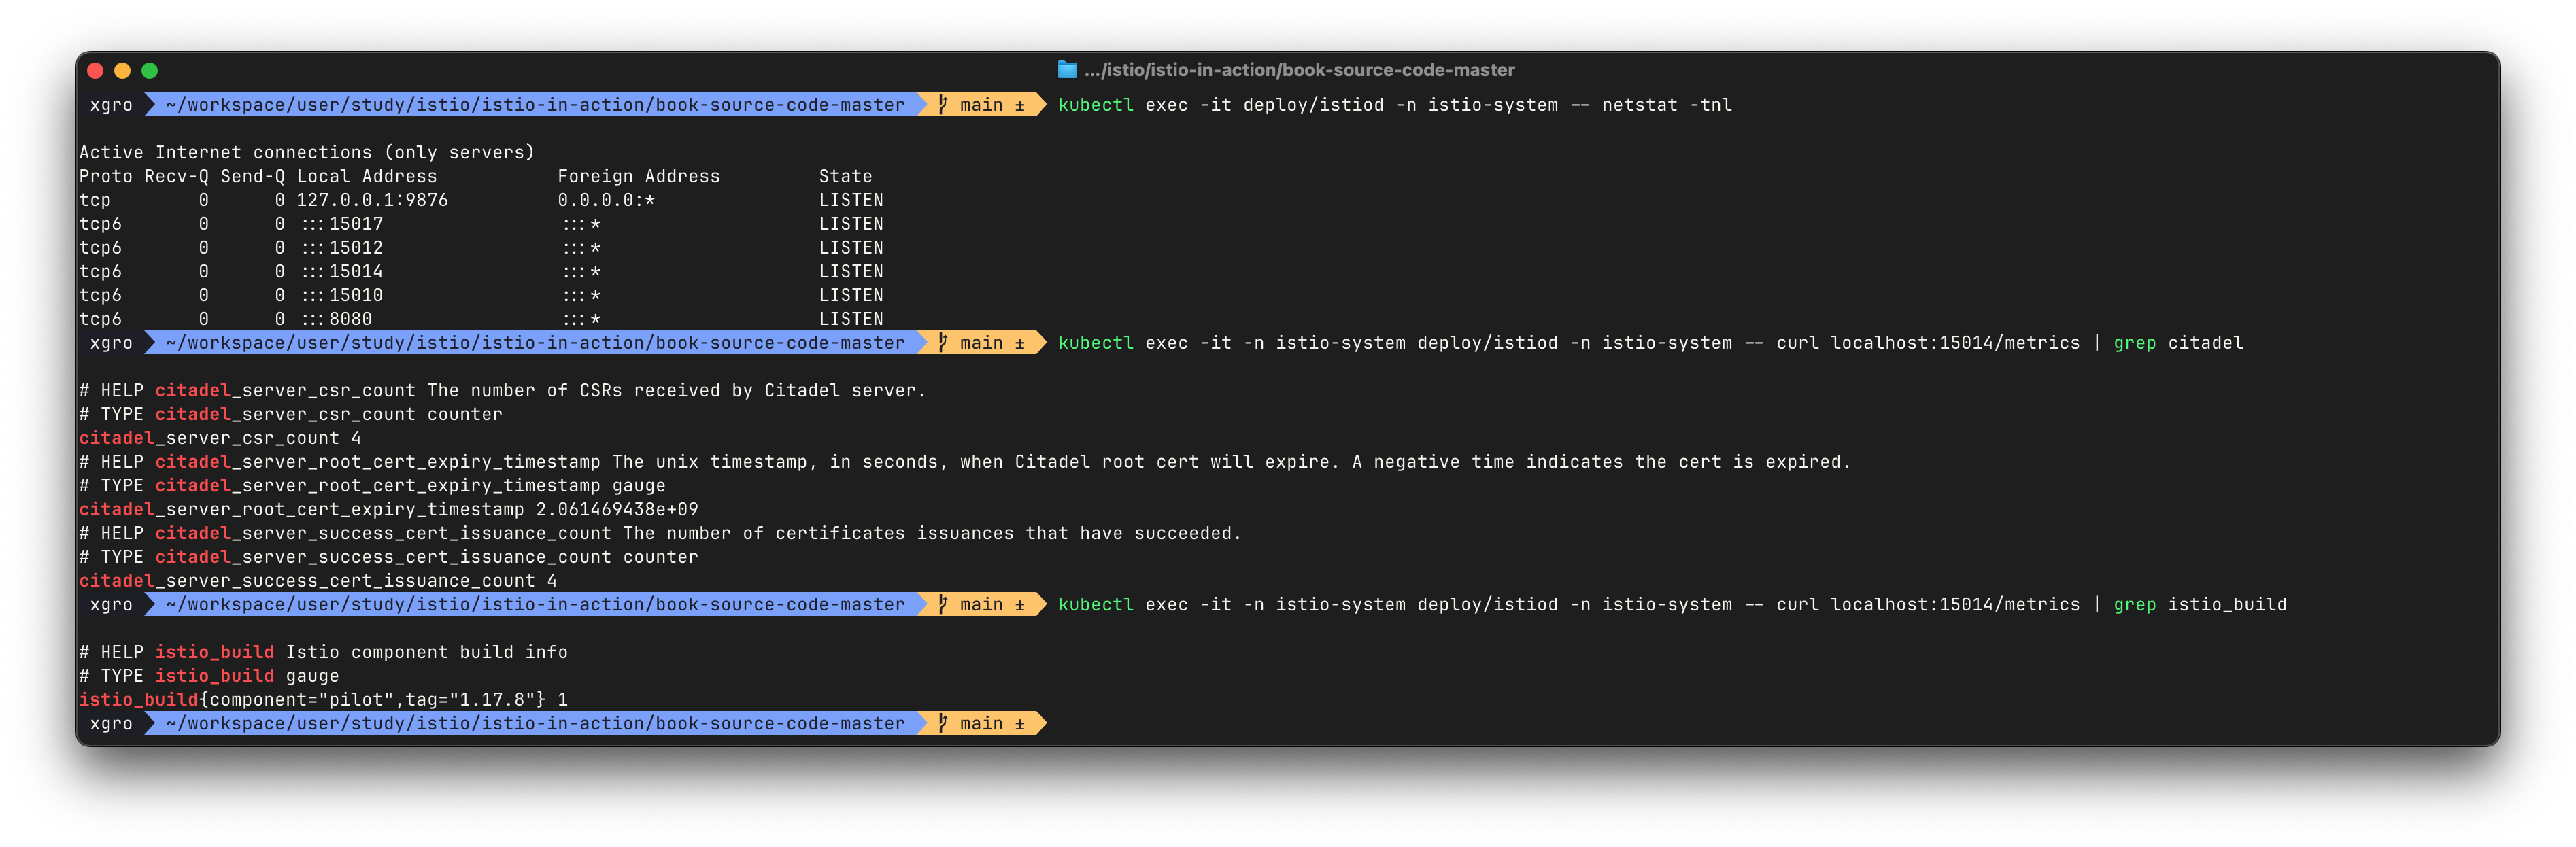
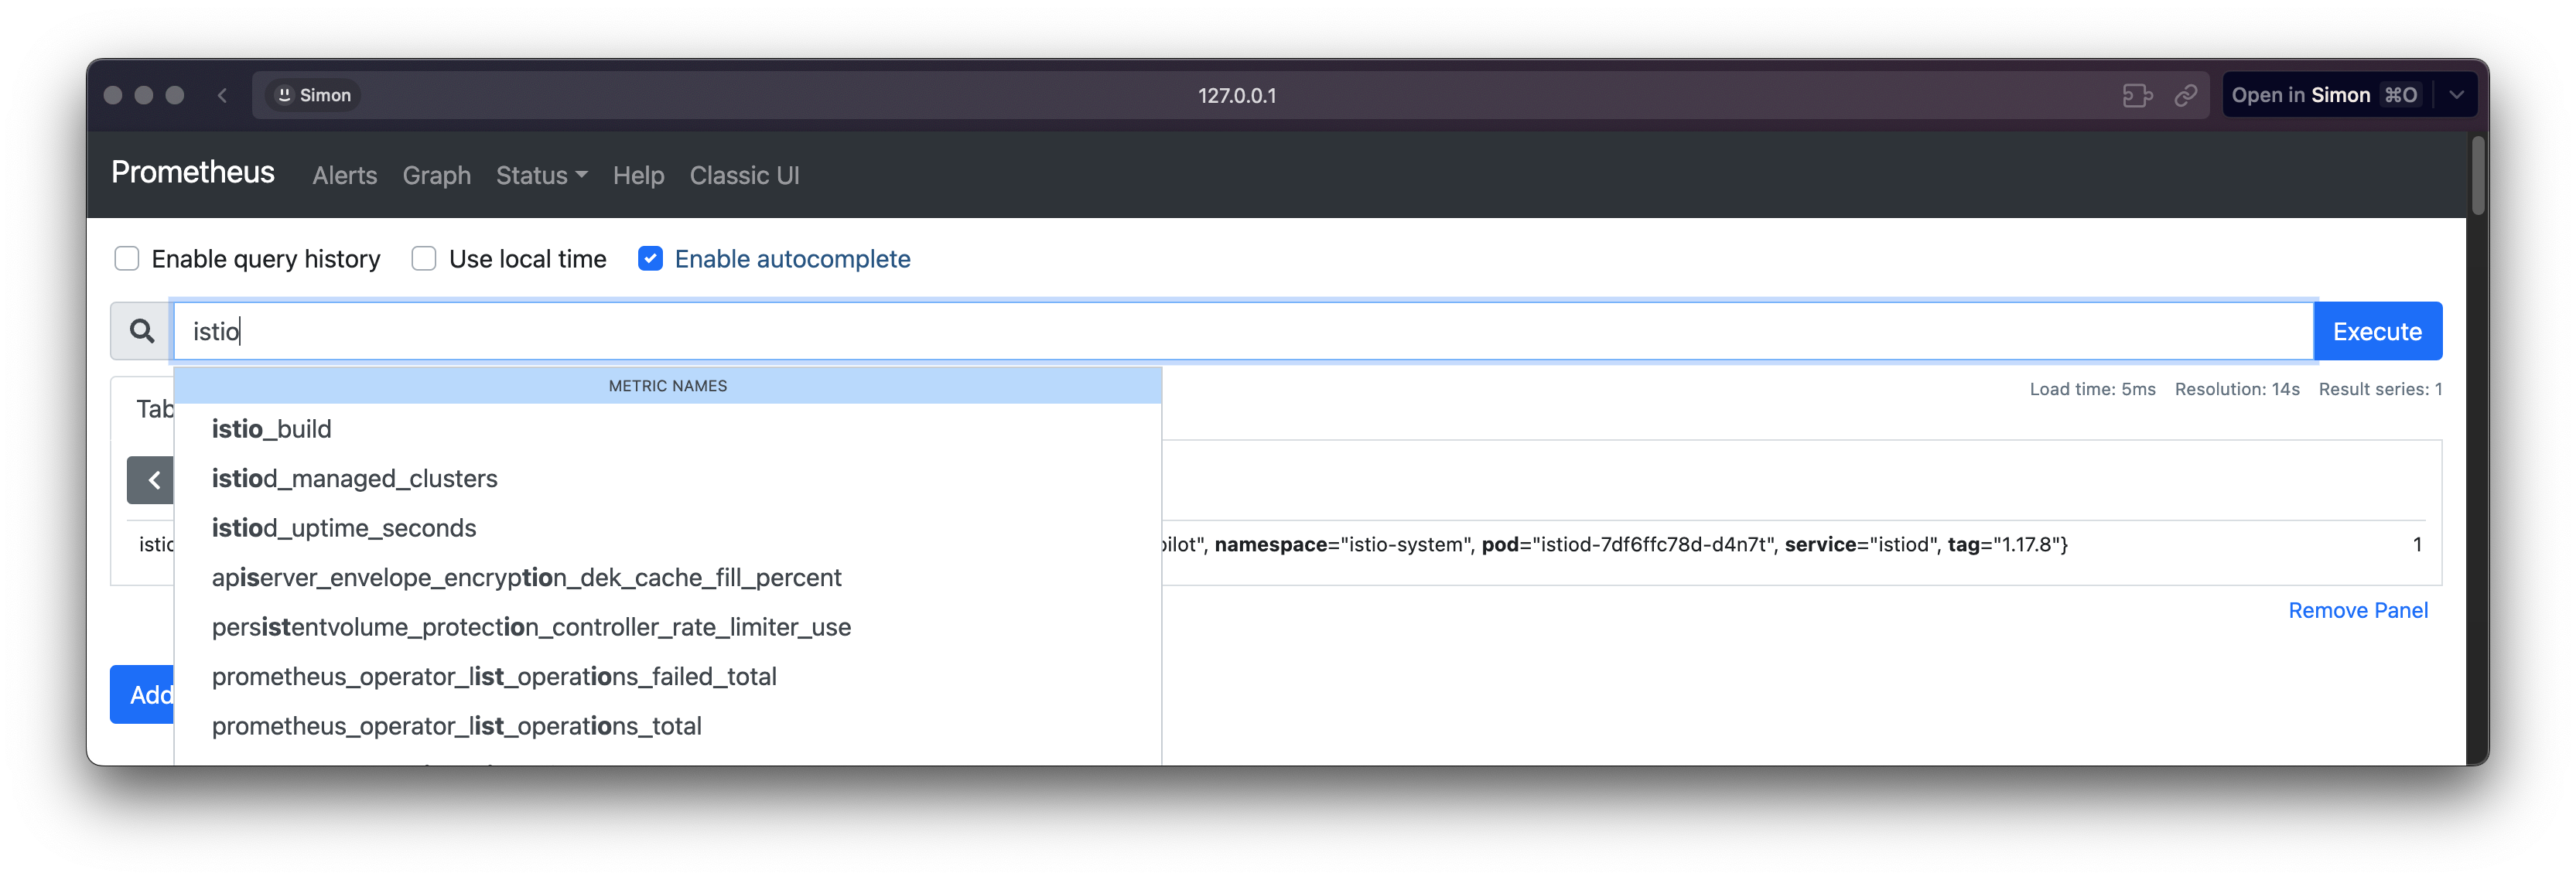
💡 Istio 버전 확인
kubectl exec -it deploy/istiod -n istio-system -- curl localhost:15014/metrics | grep istio_build- 예시 출력:
istio_build{component="pilot",tag="1.17.8"} 1
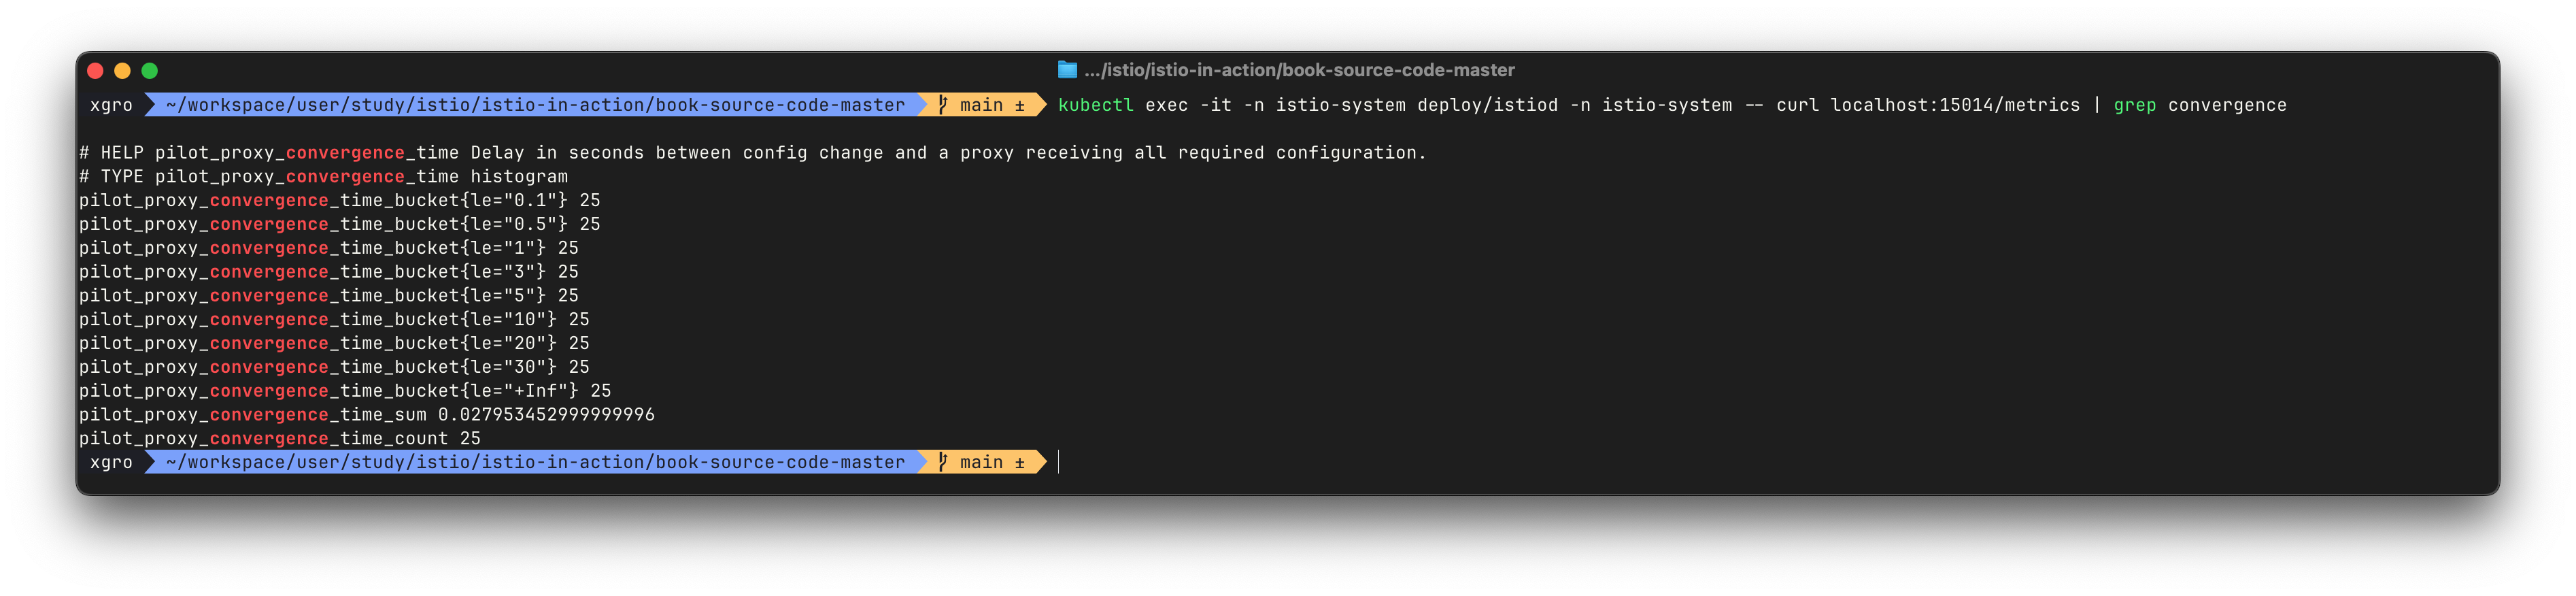
💡 설정 수렴 시간(프록시 동기화 지연 시간) 확인
kubectl exec -it deploy/istiod -n istio-system -- curl localhost:15014/metrics | grep convergencepilot_proxy_convergence_time_bucket{le="0.1"}: 0.1초 내에 수렴한 설정 수pilot_proxy_convergence_time_count: 총 설정 이벤트 수
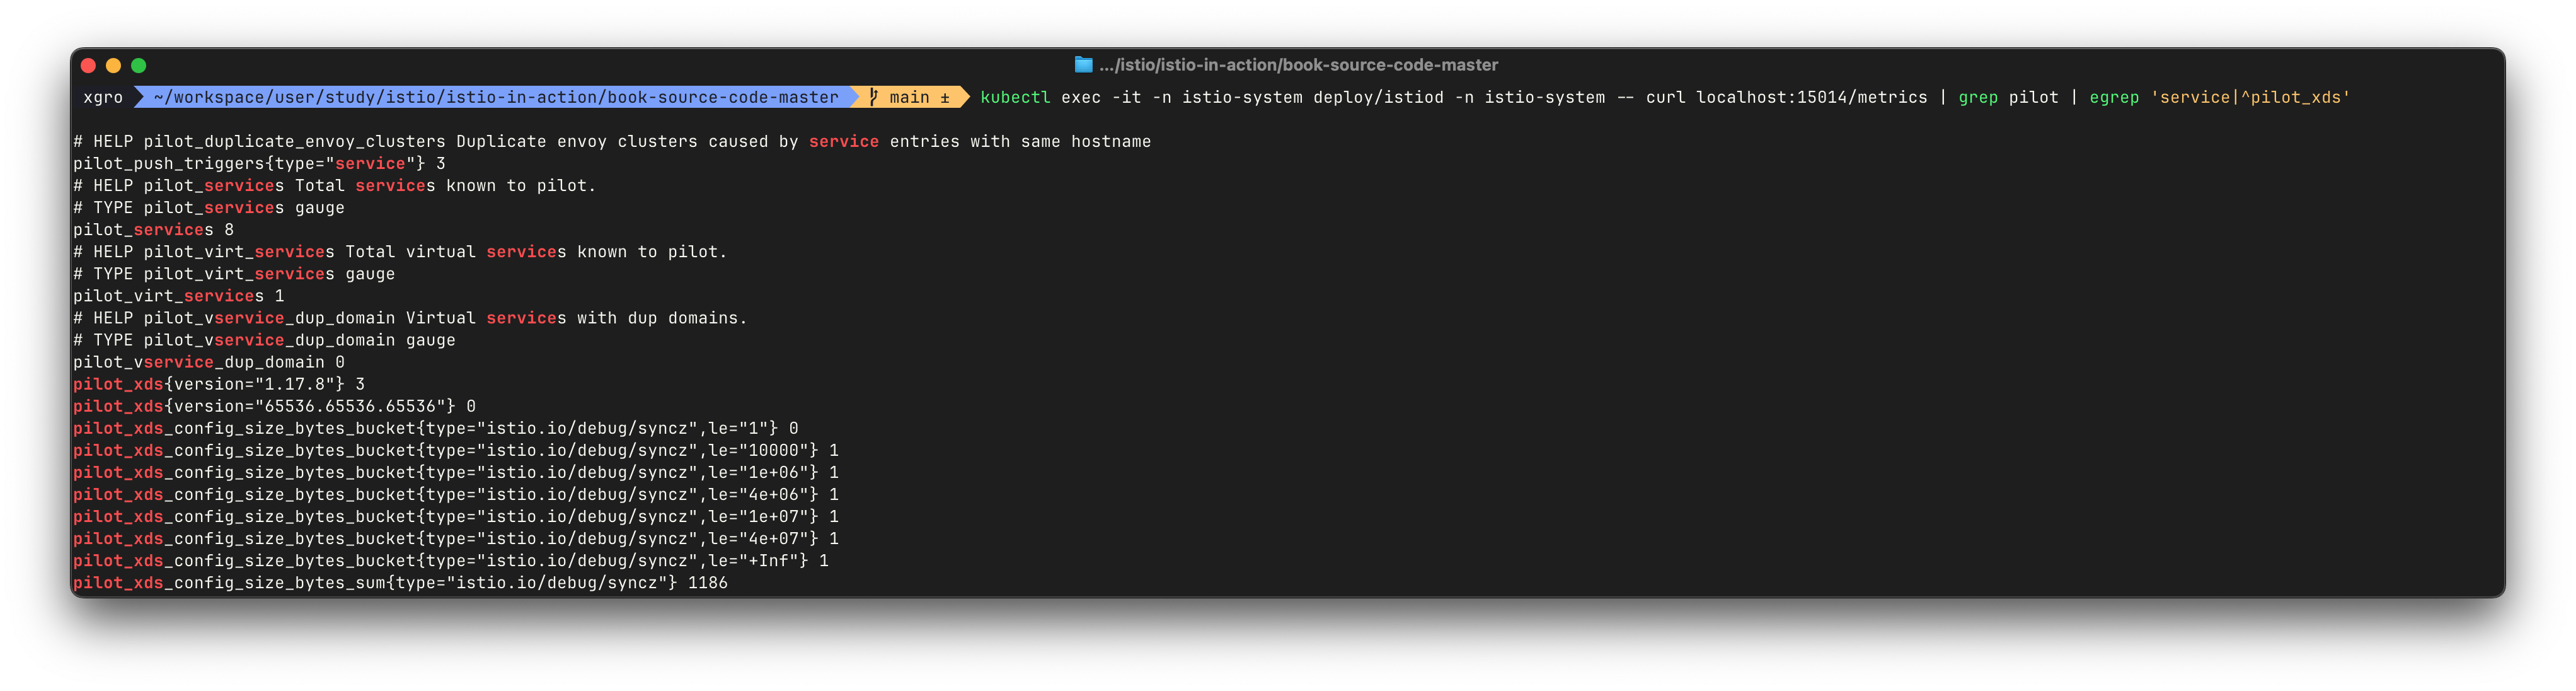
💡 등록된 서비스/가상 서비스/프록시 개수 확인
kubectl exec -it deploy/istiod -n istio-system -- curl localhost:15014/metrics | grep pilot | egrep 'service|^pilot_xds'pilot_services: 등록된 서비스 개수pilot_virt_services: VirtualService 리소스 개수pilot_xds{version="1.17.8"}: 연결된 프록시 개수
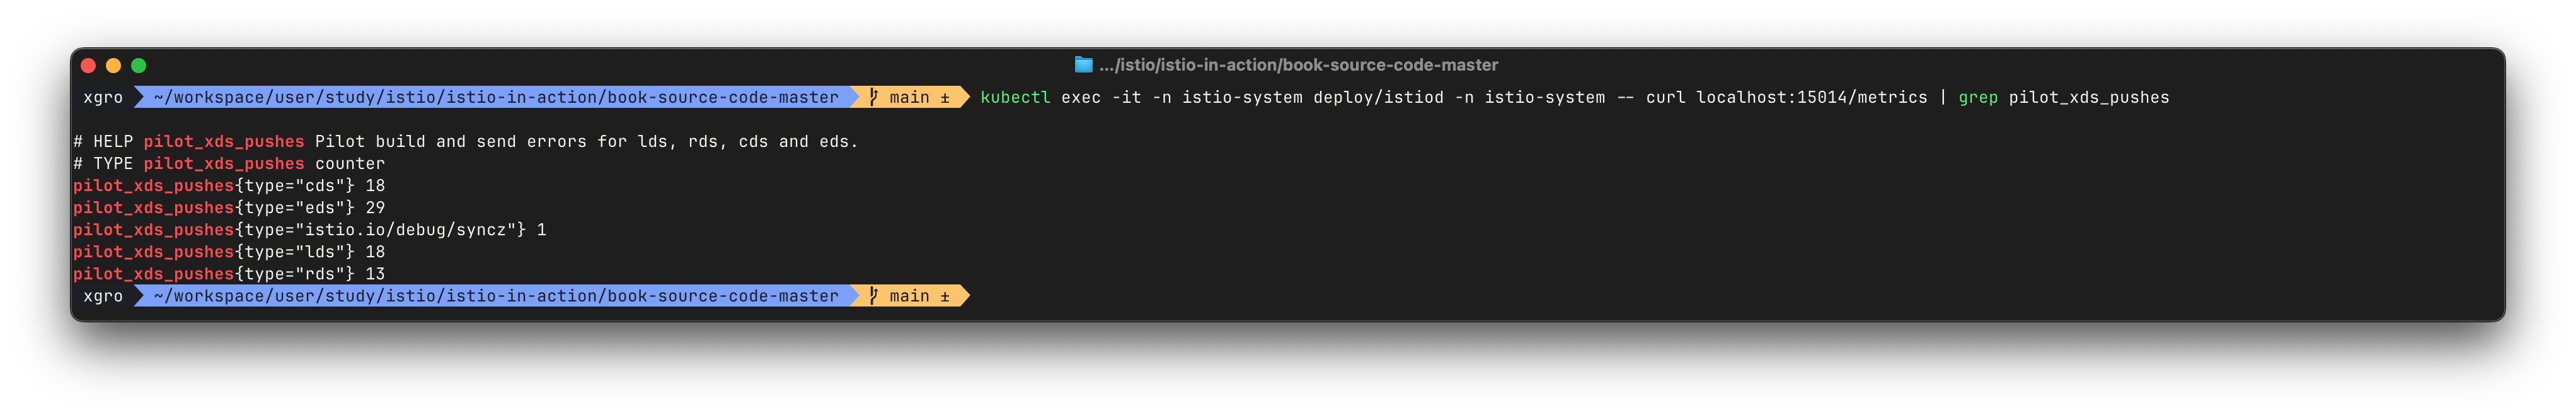
💡 xDS API 업데이트 횟수
kubectl exec -it deploy/istiod -n istio-system -- curl localhost:15014/metrics | grep pilot_xds_pushespilot_xds_pushes{type="cds"}: CDS 클러스터 설정 업데이트 수pilot_xds_pushes{type="eds"}: EDS 엔드포인트 설정 업데이트 수pilot_xds_pushes{type="lds"}: LDS 리스너 설정 업데이트 수pilot_xds_pushes{type="rds"}: RDS 라우트 설정 업데이트 수
이러한 메트릭은 서비스 메시의 동작 상태를 정량적으로 파악할 수 있는 강력한 수단입니다. 그러나 이러한 정보를 효율적으로 수집하고 분석하기 위해서는 메트릭 수집 시스템과 시계열 데이터베이스(TSDB)가 필요하며, 이를 통해 사용자는 구성 요소에 직접 접근하지 않고도 메트릭을 분석할 수 있게 됩니다.
👉 Step 03. Prometheus로 Istio 메트릭 수집하기
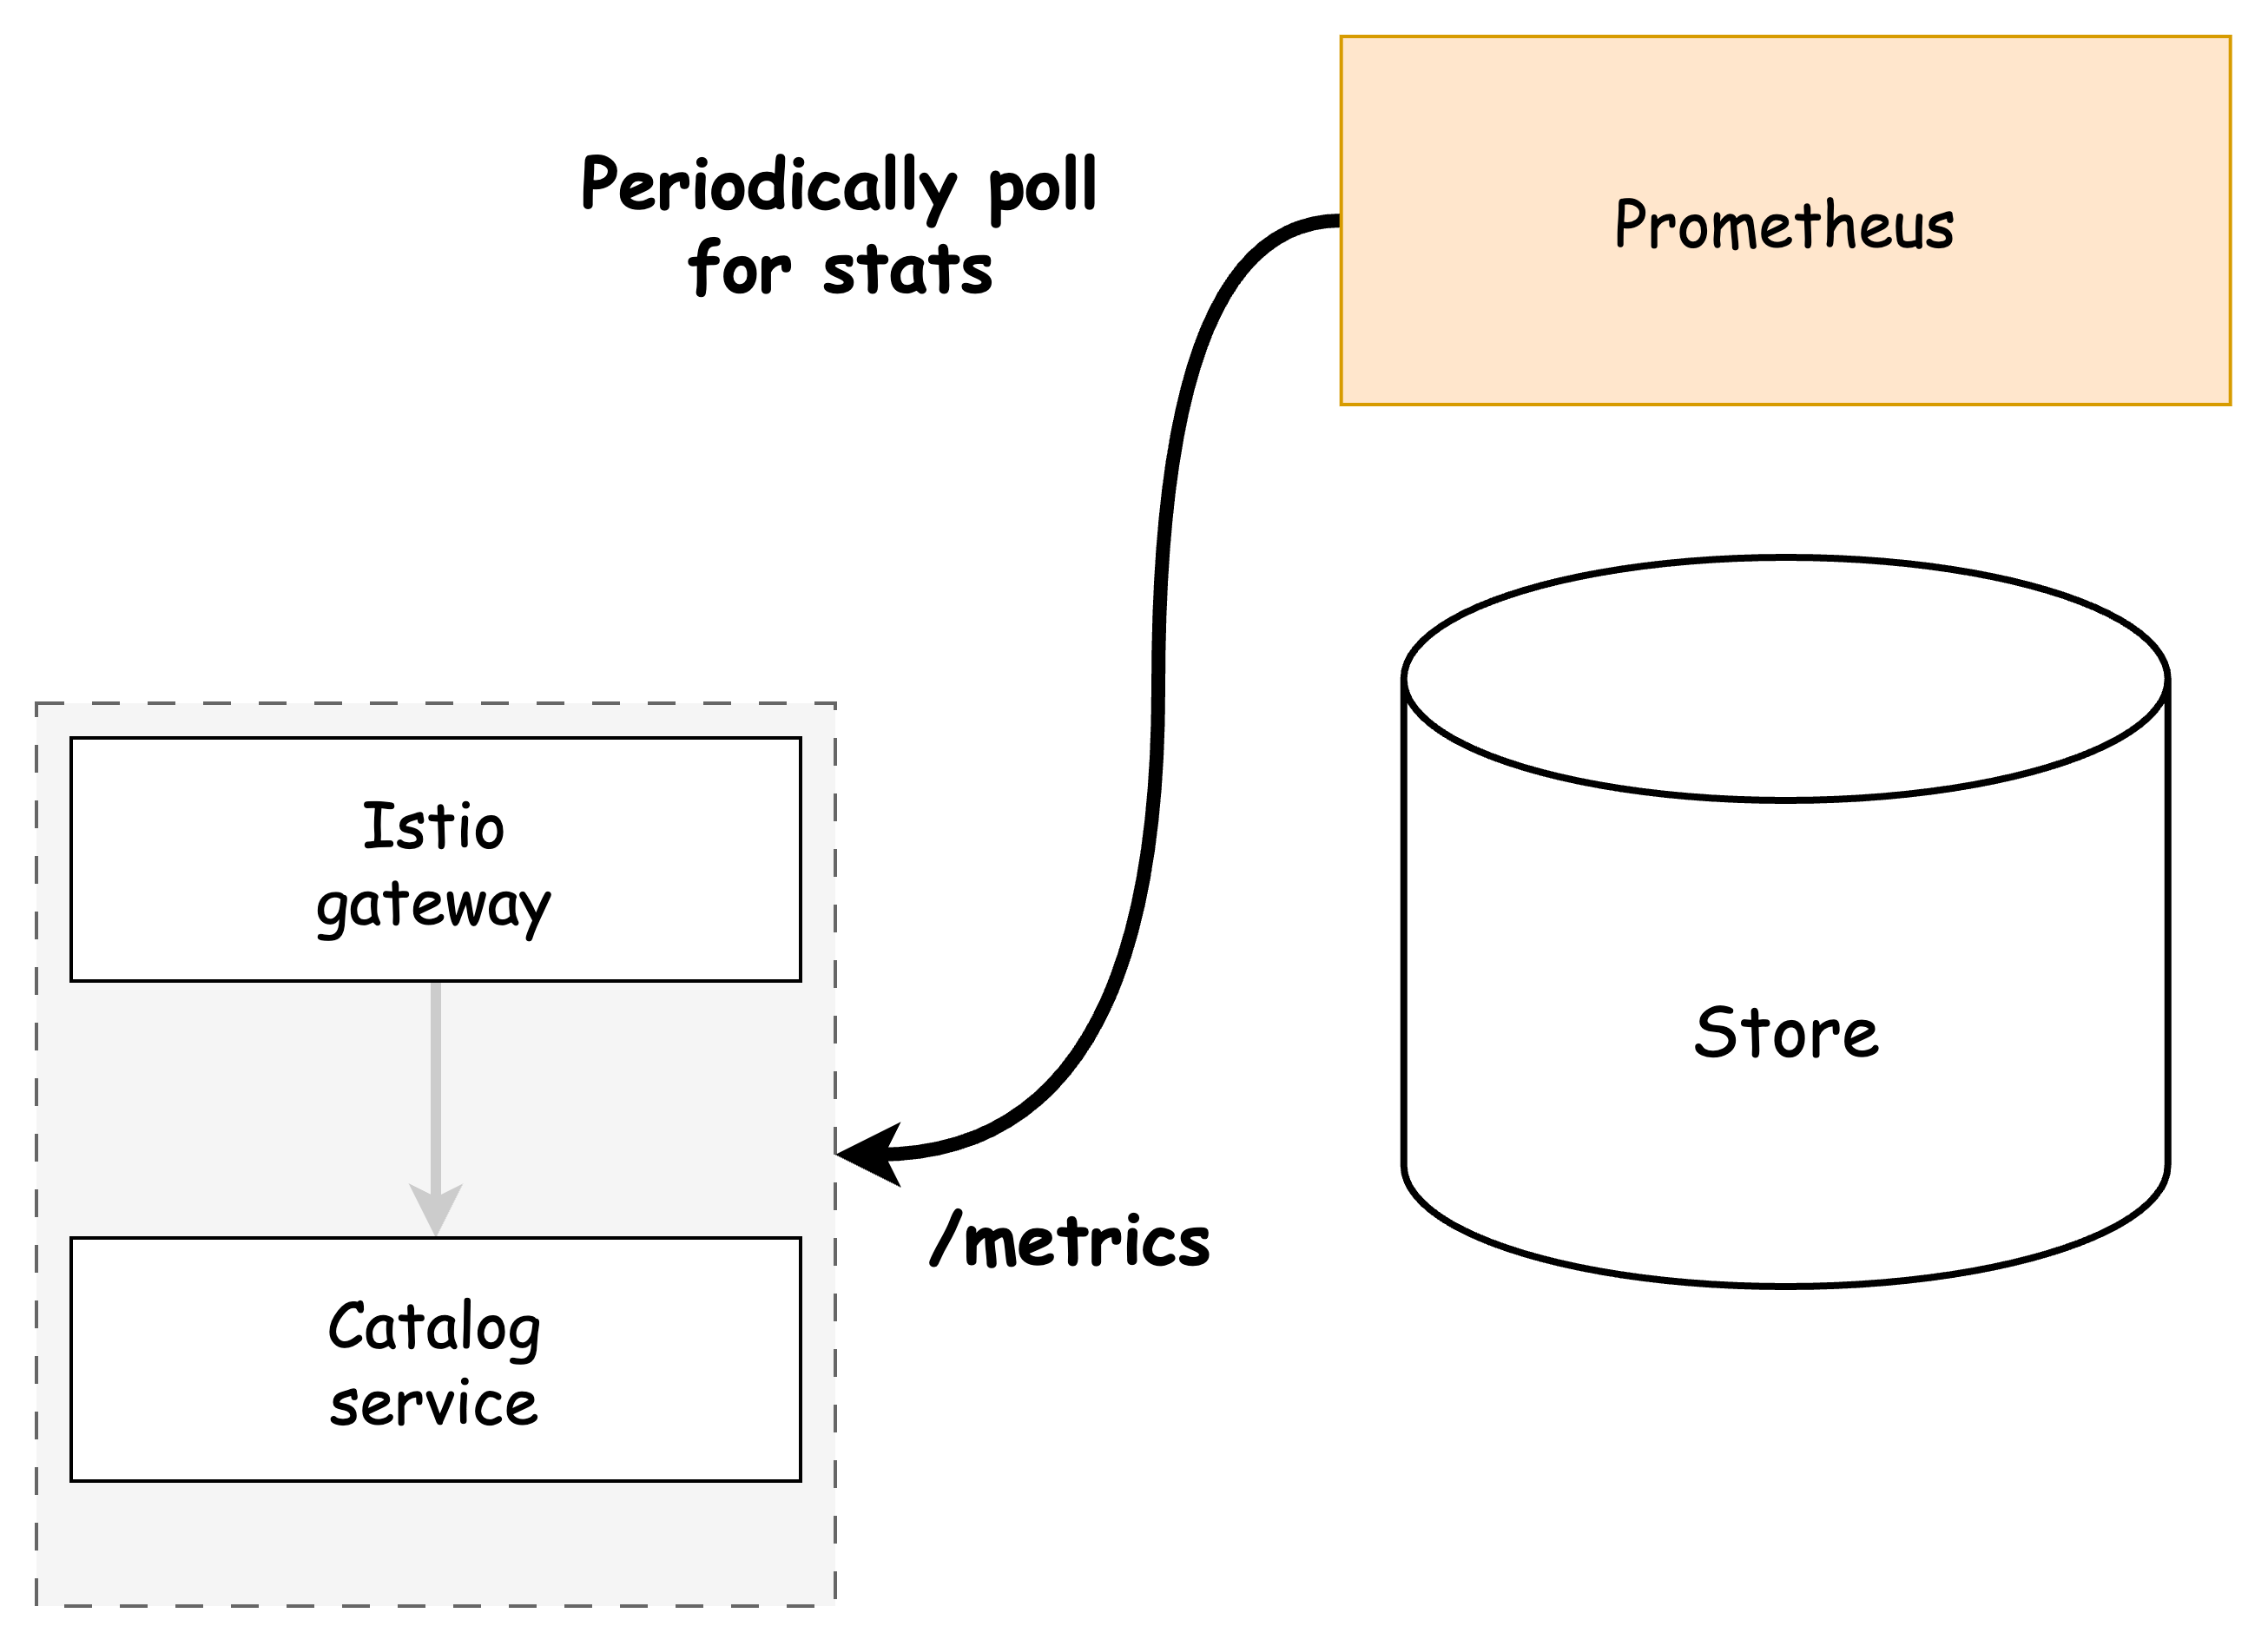
Prometheus는 SoundCloud에서 시작된 오픈소스 메트릭 수집 및 경고 시스템입니다. Kubernetes에서의 사용을 염두에 두고 설계되어 있으며, 푸시 방식이 아닌 풀(Pull) 방식으로 메트릭을 수집한다는 특징이 있습니다.
이 방식은 메트릭 제공자가 특정 형식의 HTTP 엔드포인트를 제공하면, Prometheus가 주기적으로 해당 엔드포인트를 직접 호출하여 데이터를 수집하게 됩니다. 이를 통해 에이전트 설치 없이도 간단하게 메트릭 수집을 구성할 수 있으며, 다수의 Prometheus 인스턴스를 두어 고가용성 수집 구조도 쉽게 만들 수 있습니다.
메트릭 엔드포인트 종류와 차이
Istio에서 프록시로 주입된 Envoy는 다음과 같은 두 가지 메트릭 엔드포인트를 제공합니다:
| 포트 | 경로 | 설명 |
|---|---|---|
| 15090 | /stats/prometheus | Envoy의 HTTP, TLS, 요청/응답 등 핵심 메트릭을 Prometheus 형식으로 제공 |
| 15020 | /metrics | Pilot-agent가 Envoy의 메트릭을 집계해 제공 (애플리케이션 메트릭 포함 가능) |
/stats: 디버깅 및 모니터링용 전체 통계/stats/prometheus: Prometheus가 긁어가기 위한 포맷/metrics: pilot-agent 레벨에서 집계된 정보
🔍 실습: webapp 파드의 메트릭 엔드포인트 확인
# webapp 파드의 리슨 중인 포트 확인
kubectl exec -it deploy/webapp -c istio-proxy -n istioinaction -- netstat -tnl
출력된 포트 중 15090, 15020이 Prometheus에서 수집할 수 있는 주요 메트릭 엔드포인트입니다.
# Envoy가 수집한 메트릭 출력
kubectl exec -it deploy/webapp -c istio-proxy -n istioinaction -- curl localhost:15090/stats/prometheus

# pilot-agent가 집계한 전체 메트릭 확인
kubectl exec -it deploy/webapp -c istio-proxy -n istioinaction -- curl localhost:15020/metrics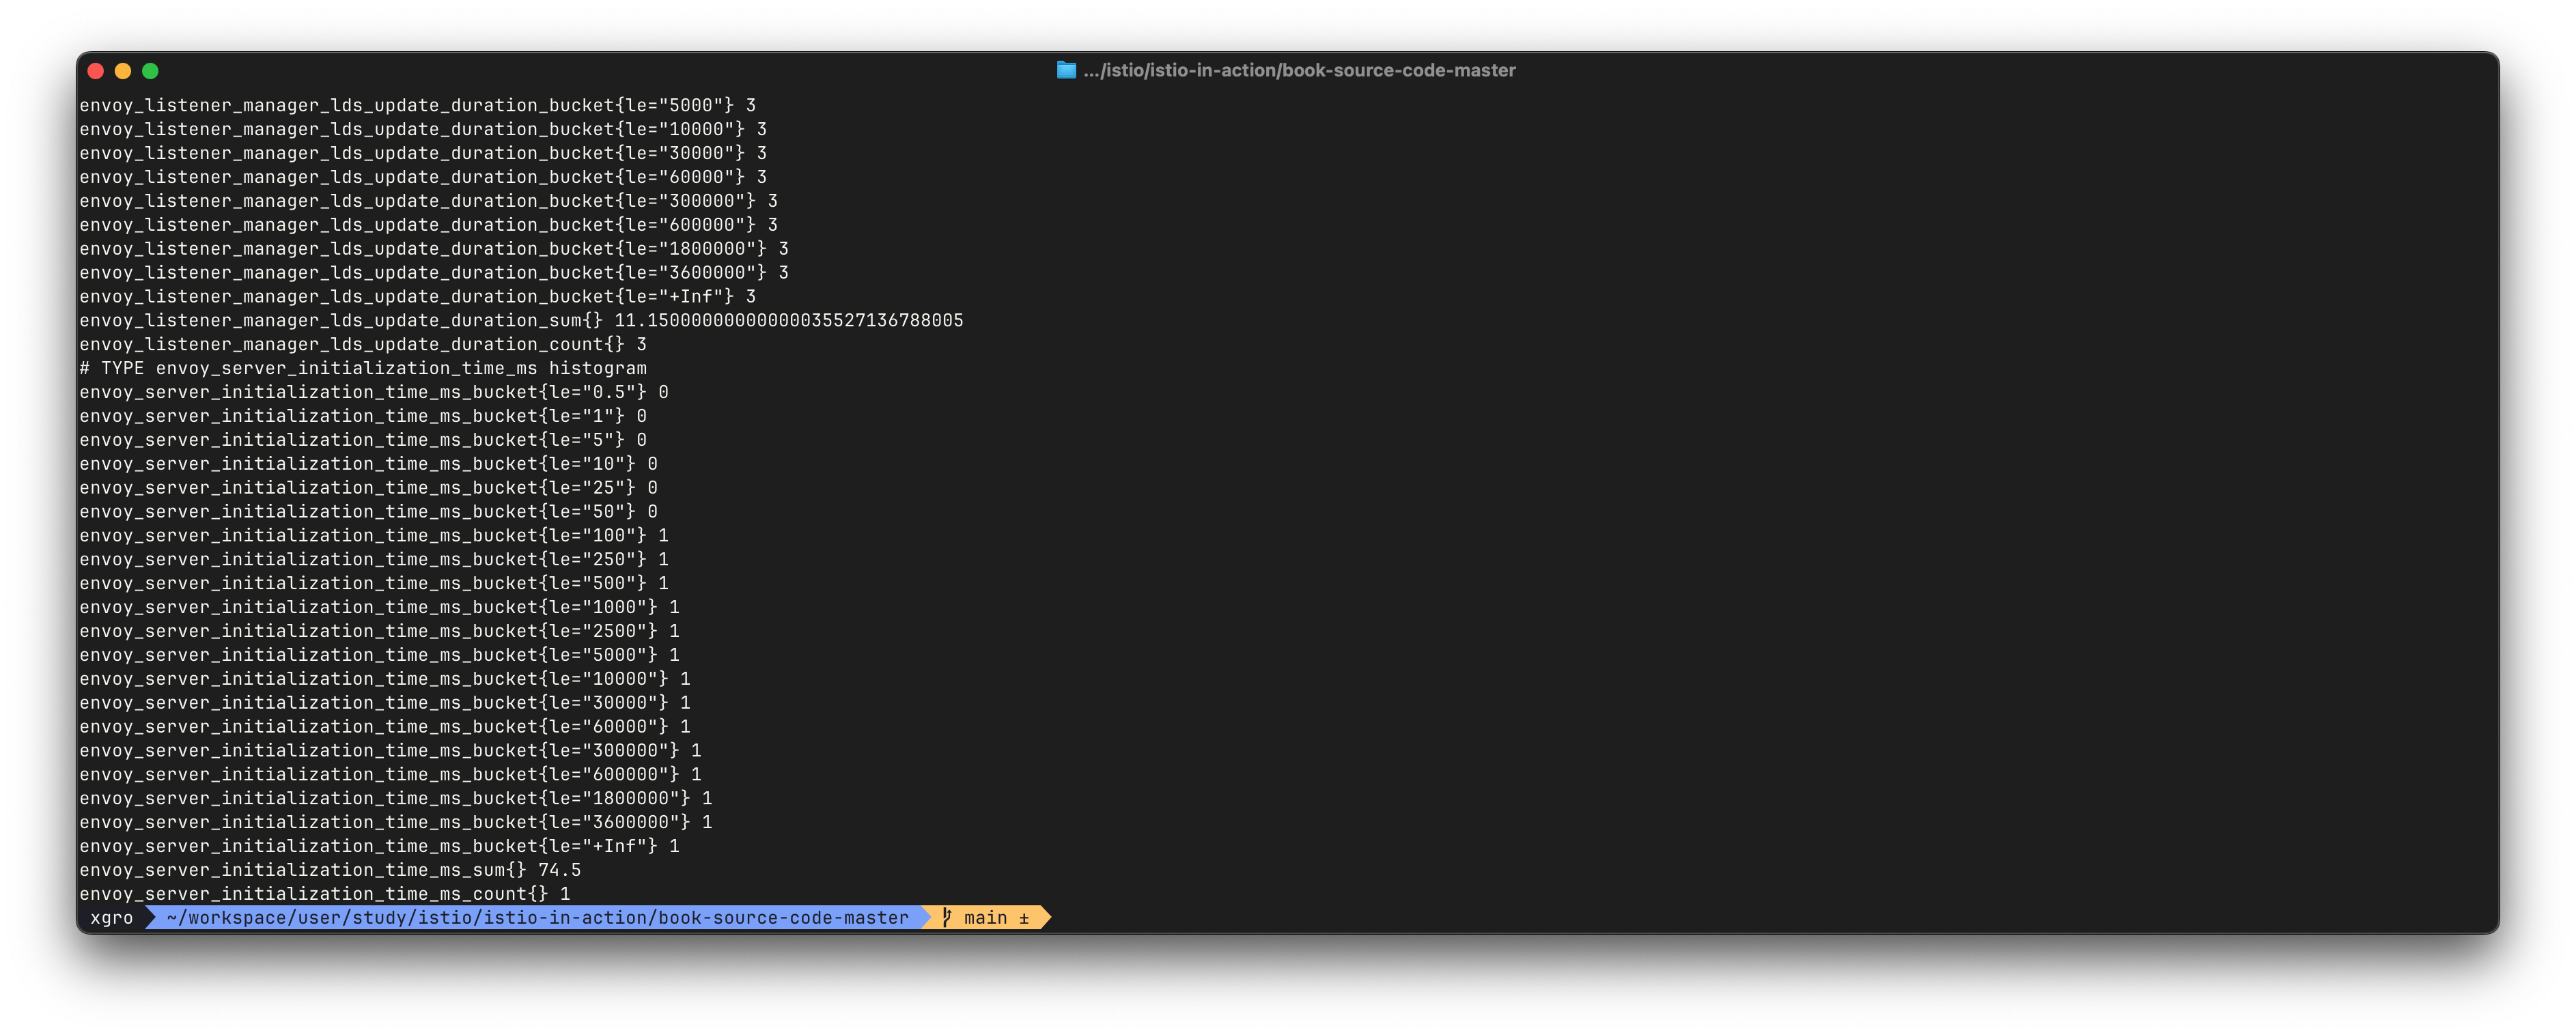
Prometheus의 주요 개념 요약
| 항목 | 설명 |
|---|---|
| 데이터 모델 | 시계열(Time Series) 기반, label(key-value) 구조 |
| 수집 방식 | Pull over HTTP |
| 수집 대상 발견 | Static config, Kubernetes Service Discovery |
| 데이터 저장소 | 자체 시계열 DB(TSDB), 분산 스토리지 불필요 |
| 시각화 도구 | Grafana 연동 및 자체 Expression Browser |
| 경고 시스템 | Alertmanager 연동 가능 |
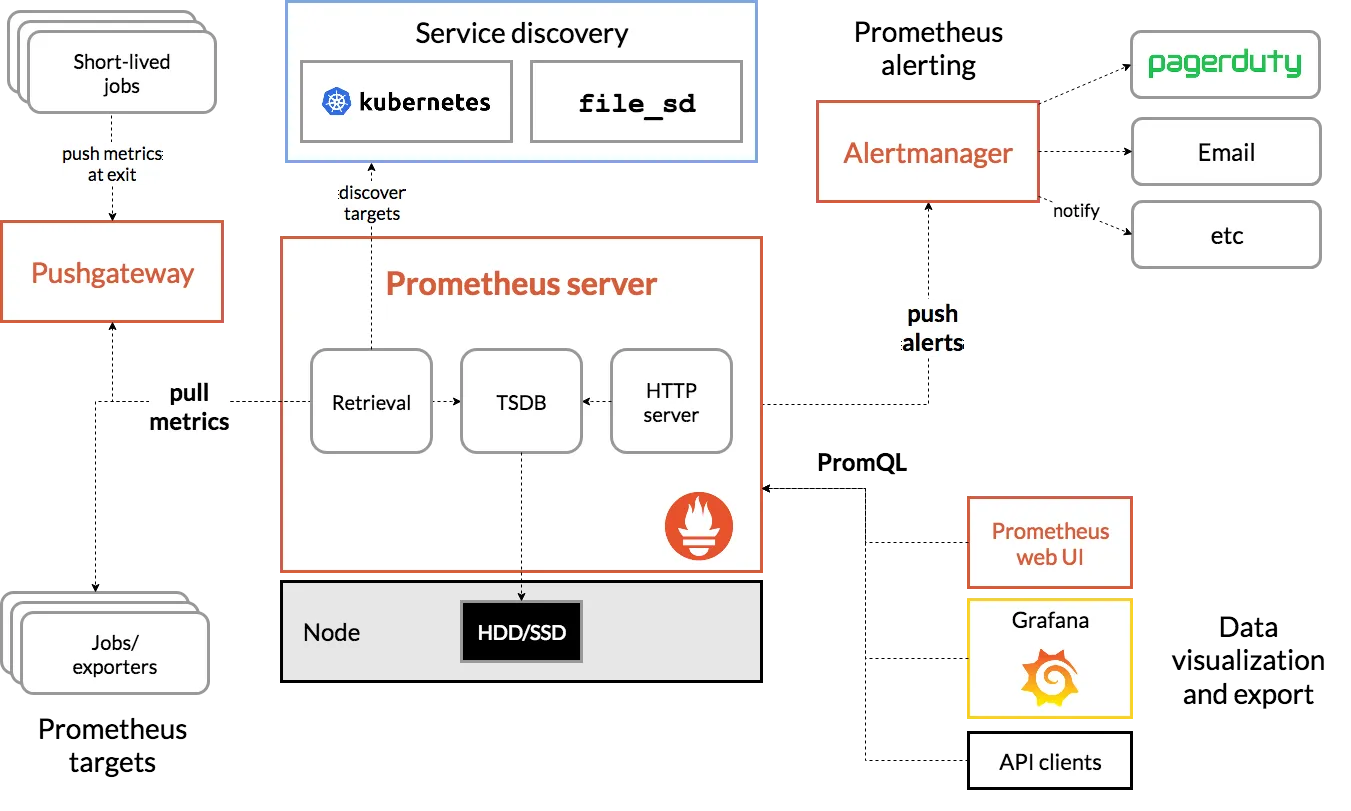
📘 참고: Prometheus Overview
📘 Pushgateway, Exporter, ServiceMonitor 등 다양한 수집 확장 도구 제공
메트릭의 정의
Prometheus에서 말하는 메트릭은 시간에 따라 수치적으로 변화하는 데이터를 기록한 것(Time Series)입니다. 예를 들어 웹서버의 경우 요청 처리 시간, 데이터베이스의 경우 활성 커넥션 수 등이 메트릭이 될 수 있습니다.
예시:
istio_requests_total: Envoy가 처리한 총 요청 수istio_request_duration_milliseconds: 요청 지연 시간 분포pilot_xds_pushes: 컨트롤 플레인에서 프록시로 전파된 설정 수
이 단계에서는 Prometheus가 어떤 방식으로 Istio의 메트릭을 수집하는지 이해하는 데 중점을 두었습니다.
다음 단계에서는 실제 Prometheus Operator 및 ServiceMonitor 설정을 통해 메트릭 수집을 구성하는 방법을 다룹니다.
✅ Setting up Prometheus and Grafana
Istio 메트릭을 수집하고 시각화하려면, Prometheus와 Grafana를 함께 설치하는 것이 일반적입니다.
이를 보다 쉽게 구성할 수 있도록 Prometheus Operator 기반의 통합 스택인 kube-prometheus-stack을 사용합니다.
이 스택은 다음을 포함한 모니터링 구성요소들을 한 번에 설치합니다:
- Prometheus Operator
- Prometheus 서버
- Grafana 대시보드
- Alertmanager
- Node Exporter
- Kube API용 어댑터 등
📦 Helm Chart:
prometheus-community/kube-prometheus-stack
#
helm repo add prometheus-community https://prometheus-community.github.io/helm-charts
helm repo update

#
cat ch7/prom-values.yaml
open ch7/prom-values.yaml

cat << EOF > prom-values-2.yaml
prometheusOperator:
  tls:
    enabled: false
  admissionWebhooks:
    patch:
      enabled: false

prometheus:
  service:
    type: NodePort
    nodePort: 30001

grafana:
  service:
    type: NodePort
    nodePort: 30002
EOF

# helm 설치
kubectl create ns prometheus
helm install prom prometheus-community/kube-prometheus-stack --version 13.13.1 \
-n prometheus -f ch7/prom-values.yaml -f prom-values-2.yaml

# 확인
helm list -n prometheus
kubectl get-all -n prometheus # krew plugin
kubectl get sts,deploy,pod,svc,ep,cm,secret -n prometheus
kubectl get crd | grep monitoring
kubectl get prometheus,servicemonitors -n prometheus

# Prometheus 접속 : Service Discovery, Target 확인
open http://127.0.0.1:30001

#
kubectl get servicemonitors -n prometheus
NAME                                                 AGE
prom-kube-prometheus-stack-grafana                   12m
prom-kube-prometheus-stack-kube-controller-manager   12m
prom-kube-prometheus-stack-operator                  12m
prom-kube-prometheus-stack-prometheus                12m


# (참고) 프로메테우스 버전 확인
kubectl exec -it sts/prometheus-prom-kube-prometheus-stack-prometheus -n prometheus -c prometheus -- prometheus --version
prometheus, version 2.24.0 (branch: HEAD, revision: 02e92236a8bad3503ff5eec3e04ac205a3b8e4fe)
...

# Grafana 접속 : admin / prom-operator
open http://127.0.0.1:30002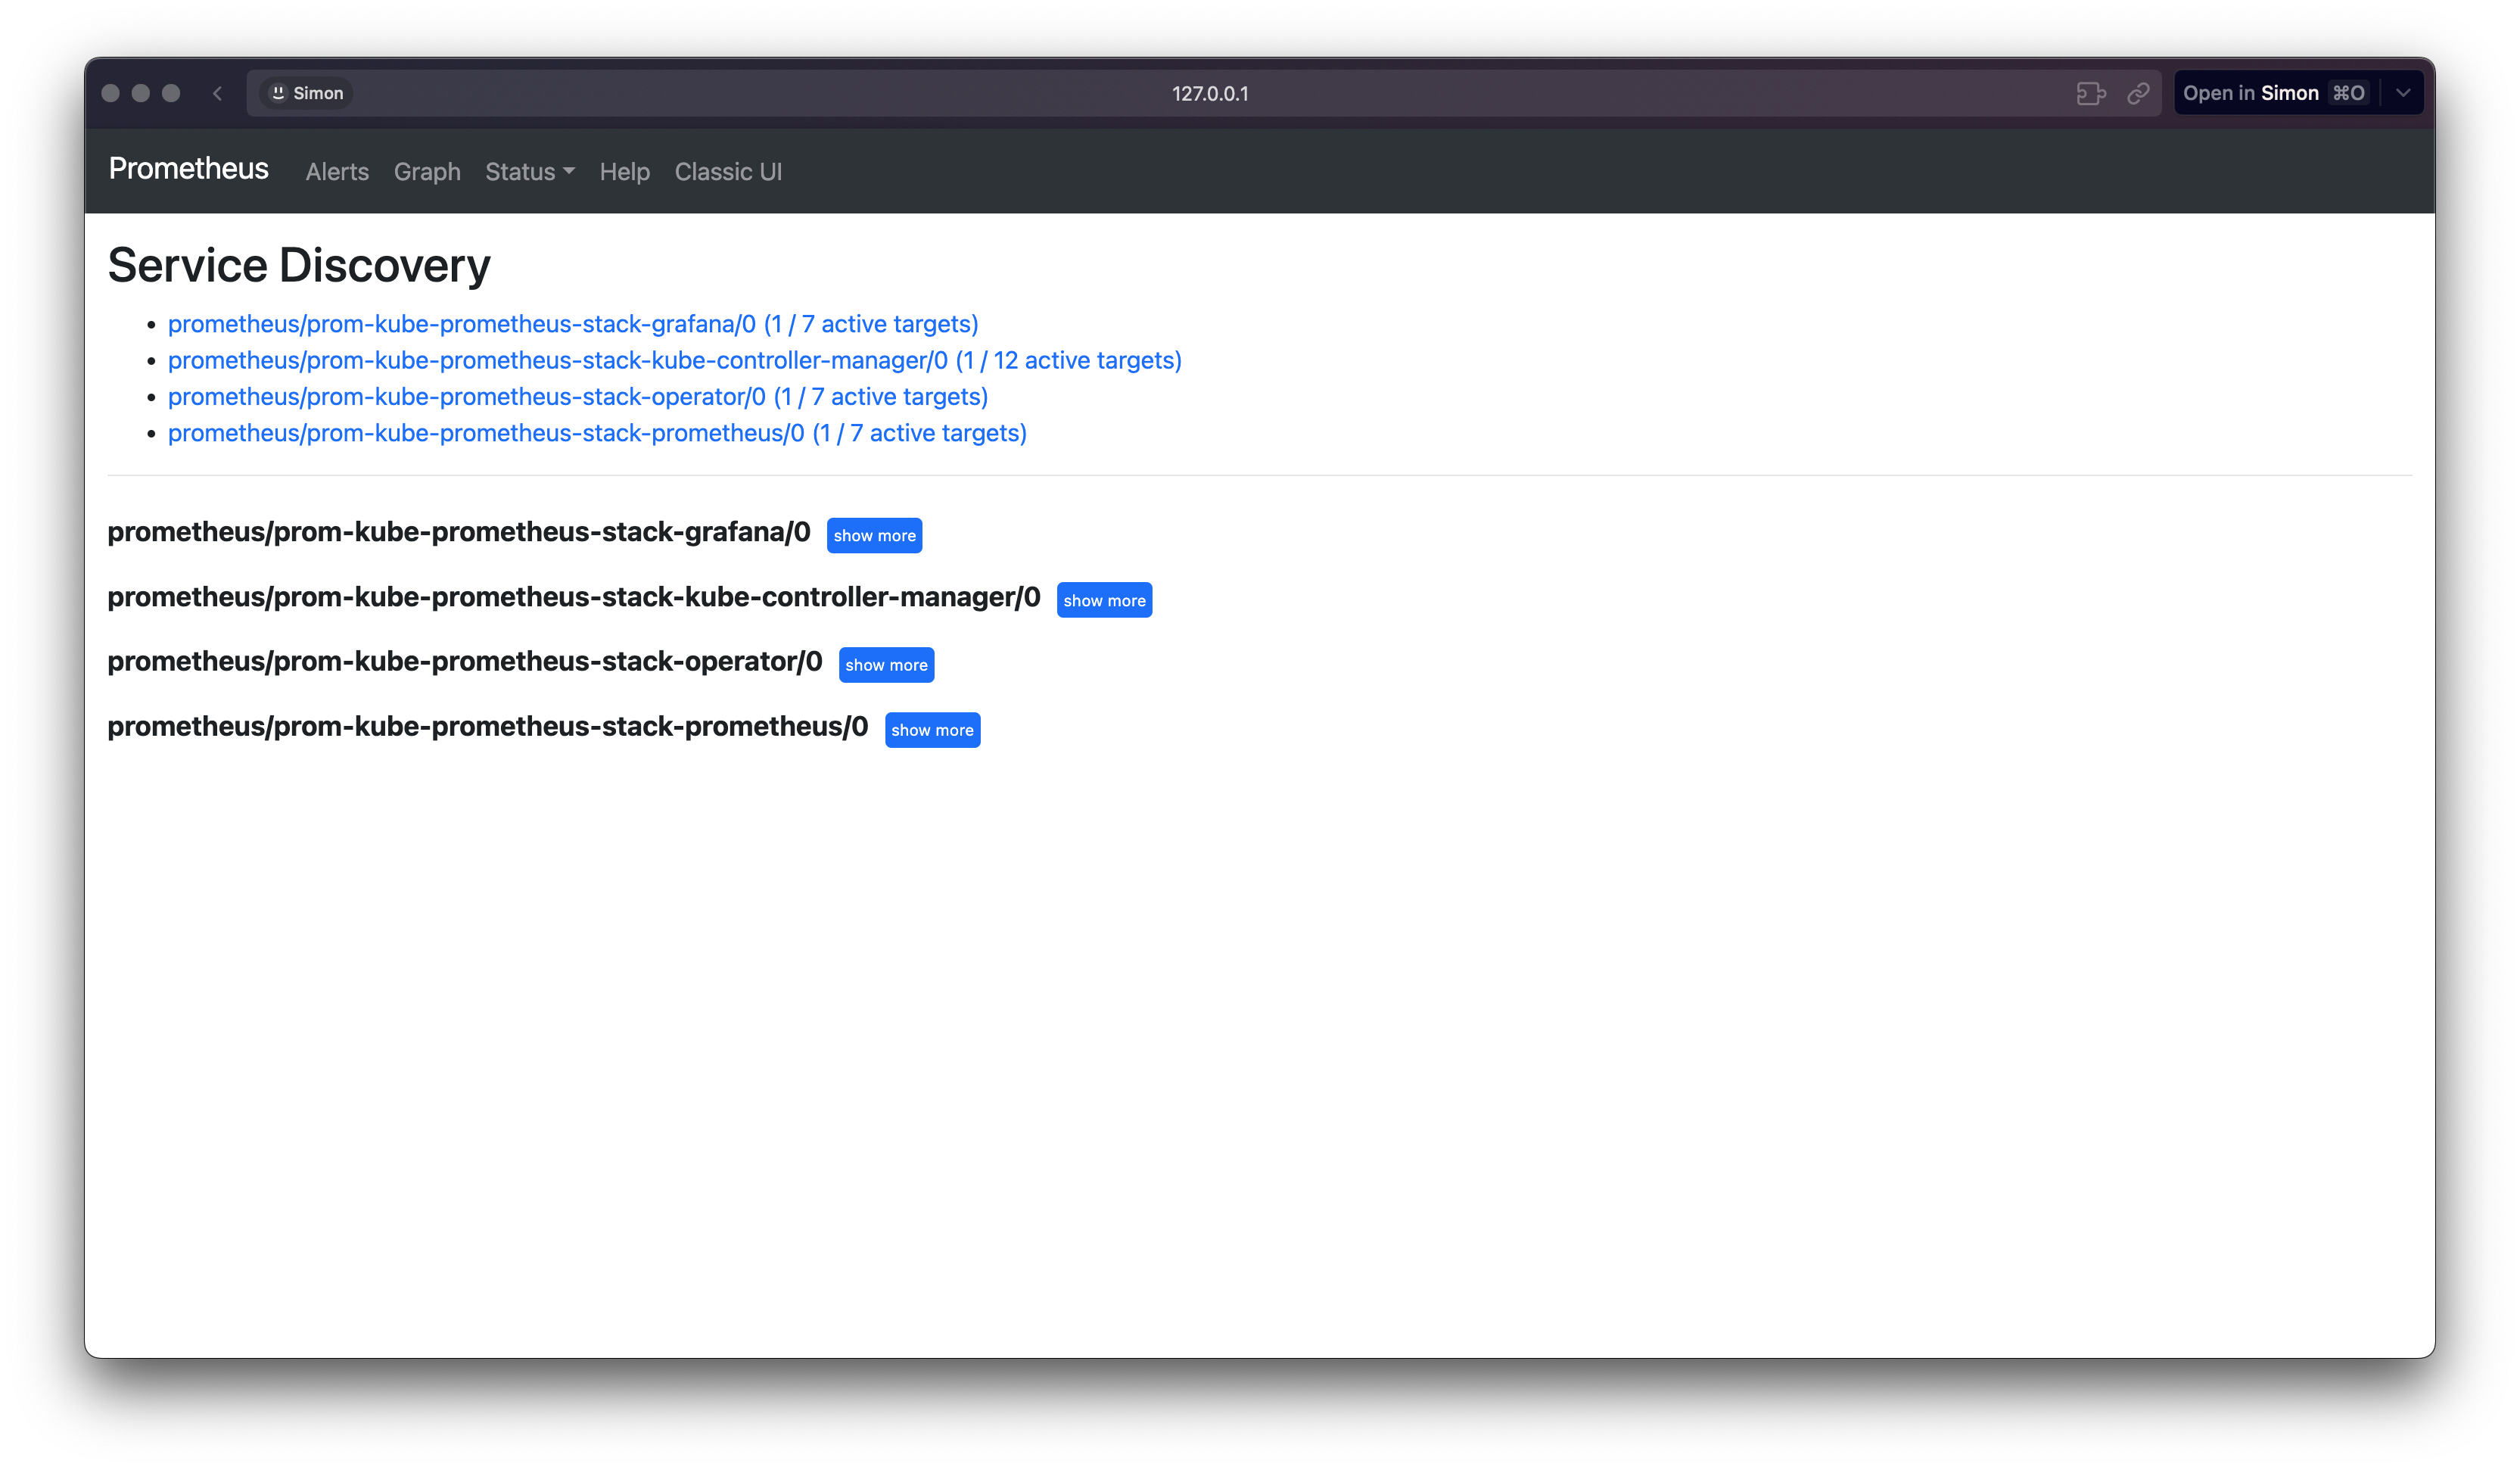
(참고)kube-controller-manager 메트릭 수집 설정
# https://stackoverflow.com/questions/65901186/kube-prometheus-stack-issue-scraping-metrics
docker exec -it myk8s-control-plane curl -s https://172.18.0.2:10257/metrics -k
kubectl edit svc -n kube-system prom-kube-prometheus-stack-kube-controller-manager # 10252 -> 10257로 포트 변경
...
  ports:
  - name: http-metrics
    port: 10257
    protocol: TCP
    targetPort: 10257
...
kubectl edit servicemonitors -n prometheus prom-kube-prometheus-stack-kube-controller-manager
...
spec:
  endpoints:
  - bearerTokenFile: /var/run/secrets/kubernetes.io/serviceaccount/token
    port: http-metrics
    scheme: https
    tlsConfig:
      caFile: /var/run/secrets/kubernetes.io/serviceaccount/ca.crt
      insecureSkipVerify: true
  jobLabel: jobLabel
  namespaceSelector:
    matchNames:
    - kube-system
  selector:
    matchLabels:
      app: kube-prometheus-stack-kube-controller-manager
      release: prom
kube-prometheus-stack을 통해 Prometheus, Grafana, Alertmanager까지 한 번에 설치하고, NodePort로 빠르게 접속할 수 있습니다.
하지만 이 단계에서는 아직 Istio 관련 메트릭 수집 설정은 완료되지 않았습니다.
이스티오의 데이터 플레인과 컨트롤 플레인 메트릭을 긁어가도록 프로메테우스를 설정하는 방법을 살펴보겠습니다.
✅ Prometheus Operator로 Istio 메트릭 수집 설정
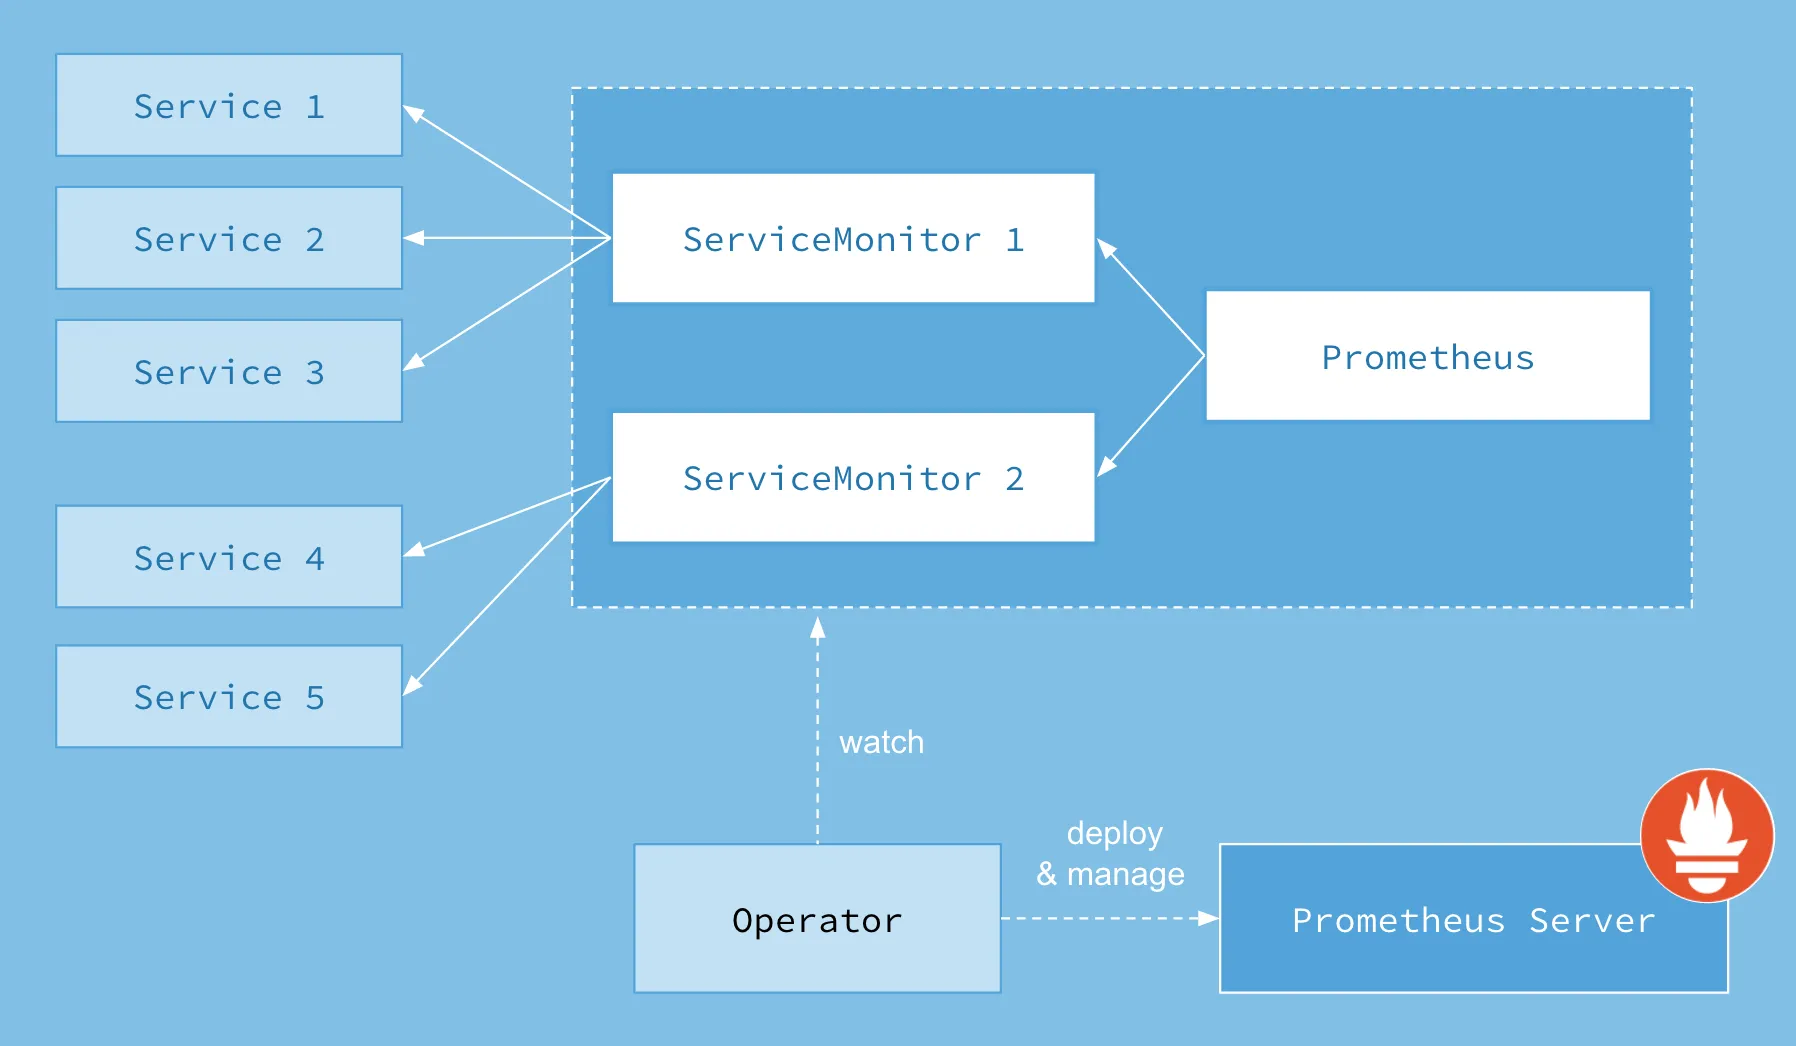
Istio의 데이터 플레인과 컨트롤 플레인에서 메트릭을 수집하려면, Prometheus Operator가 제공하는 두 가지 커스텀 리소스인 ServiceMonitor와 PodMonitor를 사용합니다. 이 리소스들은 Prometheus가 Kubernetes 기반 워크로드를 자동으로 발견하고 메트릭을 수집할 수 있도록 도와줍니다.
📌 참고 문서
Istio 컨트롤 플레인 메트릭 수집 (ServiceMonitor)
컨트롤 플레인 구성 요소인 istiod는 15014 포트에서 메트릭을 노출합니다. Prometheus가 이를 수집할 수 있도록 ServiceMonitor를 설정합니다.
# cat ch7/service-monitor-cp.yaml
apiVersion: monitoring.coreos.com/v1
kind: ServiceMonitor
metadata:
  name: istio-component-monitor
  namespace: prometheus
  labels:
    monitoring: istio-components
    release: prom
spec:
  jobLabel: istio
  targetLabels: [app]
  selector:
    matchExpressions:
    - {key: istio, operator: In, values: [pilot]}
  namespaceSelector:
    any: true
  endpoints:
  - port: http-monitoring  # 15014
    interval: 15s
istiod 서비스에 istio=pilot 라벨이 붙어 있는지 확인하고, 포트가 15014로 설정되어 있어야 합니다.
kubectl describe svc istiod -n istio-system
kubectl get pod -n istio-system -l istio=pilot
kubectl apply -f ch7/service-monitor-cp.yaml -n prometheus
kubectl get servicemonitor -n prometheus
이후 Prometheus 웹 UI의 Service Discovery → Targets 탭에서 수집 대상에 istio-component-monitor가 표시되는 것을 확인할 수 있습니다.
Istio 데이터 플레인 메트릭 수집 (PodMonitor)
Istio 프록시(Envoy)는 각 파드에 주입되어 있으며, 메트릭은 주로 15020, 15090 포트에서 제공됩니다. PodMonitor를 이용하면 istio-proxy 컨테이너를 가진 모든 파드의 메트릭을 자동 수집할 수 있습니다.
우선, 해당 파드에 다음과 같은 애노테이션이 존재하는지 확인합니다.
kubectl describe pod -n istioinaction예시:
Annotations:
  prometheus.io/path: /stats/prometheus
  prometheus.io/port: 15020
  prometheus.io/scrape: true
이후 PodMonitor 리소스를 설정합니다.
cat ch7/pod-monitor-dp.yaml
apiVersion: monitoring.coreos.com/v1
kind: PodMonitor
metadata:
  name: envoy-stats-monitor
  namespace: prometheus
  labels:
    monitoring: istio-proxies
    release: prom
spec:
  selector:
    matchExpressions:
    - {key: istio-prometheus-ignore, operator: DoesNotExist}
  namespaceSelector:
    any: true
  jobLabel: envoy-stats
  podMetricsEndpoints:
  - path: /stats/prometheus
    interval: 15s
    relabelings:
    - action: keep
      sourceLabels: [__meta_kubernetes_pod_container_name]
      regex: "istio-proxy"
    - action: keep
      sourceLabels: [__meta_kubernetes_pod_annotationpresent_prometheus_io_scrape]
    - sourceLabels: [
    __address__, __meta_kubernetes_pod_annotation_prometheus_io_port]
      action: replace
      regex: ([^:]+)(?::\d+)?;(\d+)
      replacement: $1:$2
      targetLabel: __address__
    - action: labeldrop
      regex: "__meta_kubernetes_pod_label_(.+)"
    - sourceLabels: [__meta_kubernetes_namespace]
      action: replace
      targetLabel: namespace
    - sourceLabels: [__meta_kubernetes_pod_name]
      action: replace
      targetLabel: pod_name
적용 후 확인:
kubectl apply -f ch7/pod-monitor-dp.yaml -n prometheus
kubectl get podmonitor -n prometheus
메트릭 수집이 정상적으로 작동하는지 확인하려면 반복적으로 요청을 발생시켜봅니다.
for in in {1..10}; do curl -s http://webapp.istioinaction.io:30000/ ; sleep 0.5; done
for in in {1..10}; do curl -s http://webapp.istioinaction.io:30000/api/catalog ; sleep 0.5; done

while true; do curl -s http://webapp.istioinaction.io:30000/api/catalog ; date "+%Y-%m-%d %H:%M:%S" ; sleep 1; echo; done
다음 명령어로 직접 메트릭을 확인할 수도 있습니다:
WEBAPP=$(kubectl get pod -n istioinaction -l app=webapp -o jsonpath='{.items[0].status.podIP}')
kubectl exec -it netshoot -- curl -s $WEBAPP:15020/stats/prometheus
kubectl exec -it netshoot -- curl -s $WEBAPP:15090/stats/prometheus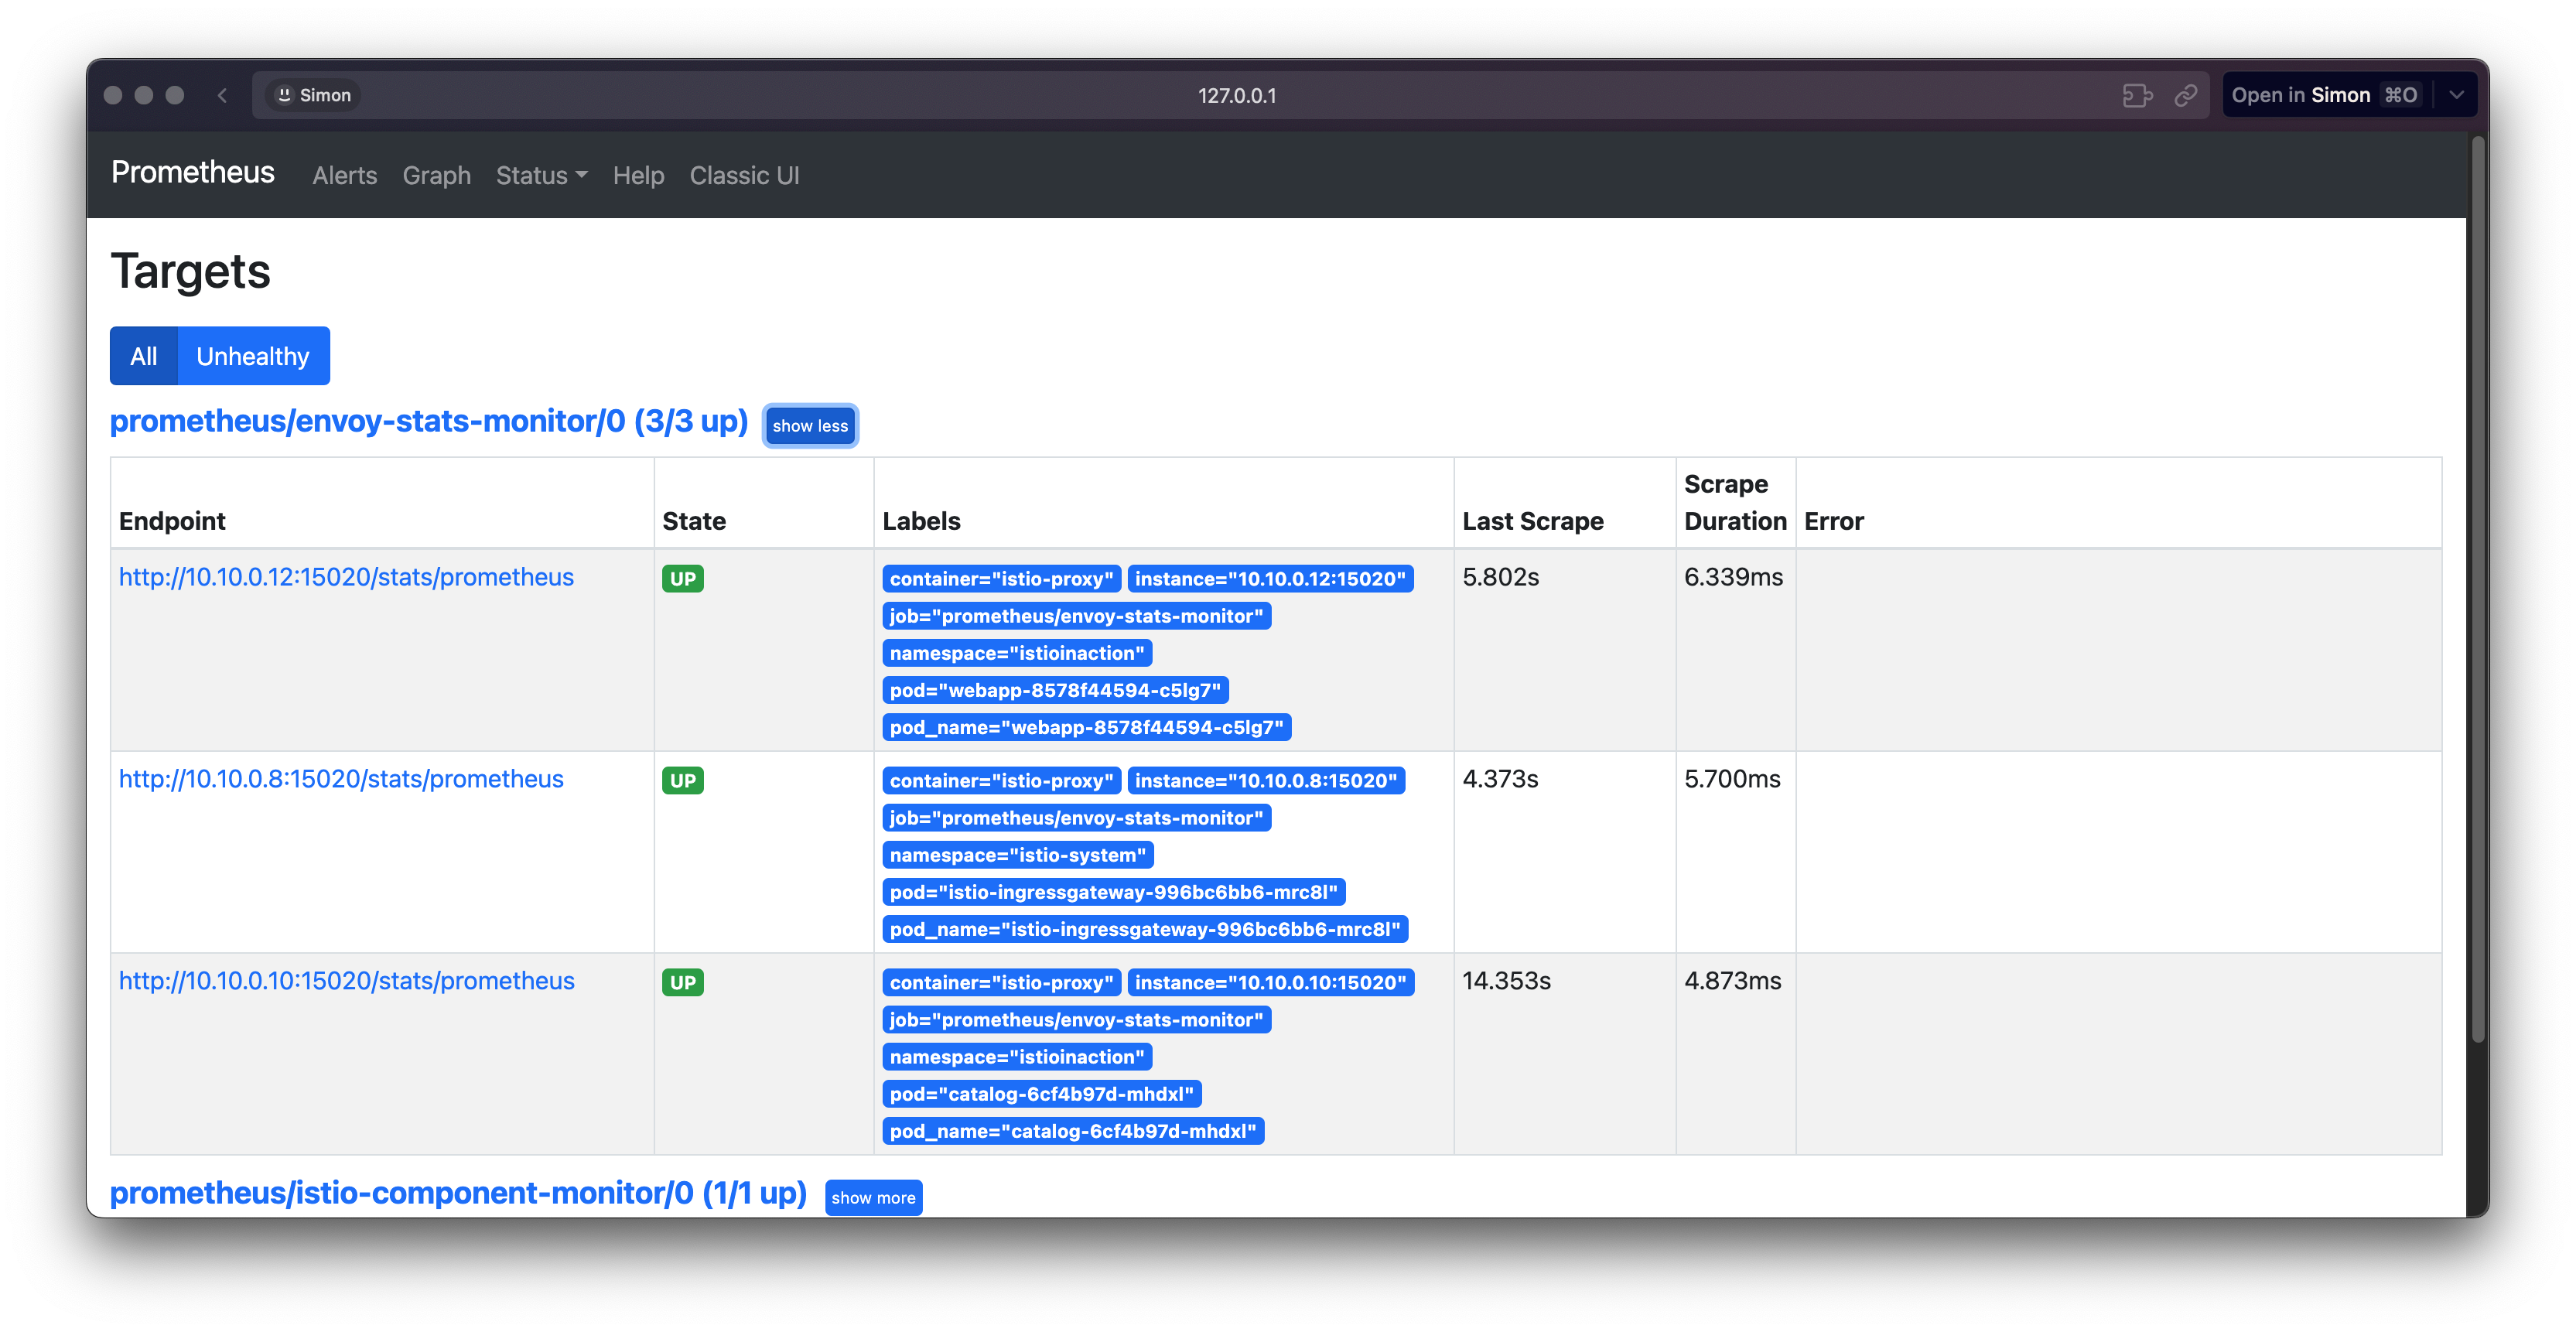
이 설정을 통해 Prometheus는 Istio의 컨트롤 플레인과 데이터 플레인에서 메트릭을 안정적으로 수집할 수 있으며, 이를 기반으로 다양한 모니터링 대시보드와 경고 정책을 구성할 수 있습니다.
👉 Step 04. Istio 기본 메트릭 커스터마이징하기
Istio는 서비스 간 통신을 관찰할 수 있도록 Envoy 사이드카를 통해 기본적인 메트릭을 제공합니다. 이 메트릭들은 기본적으로 다음과 같은 항목으로 구성됩니다.
| 메트릭 이름 | 설명 |
|---|---|
istio_requests_total | 요청 횟수 (Counter) |
istio_request_duration_milliseconds | 요청 처리 시간 분포 (Distribution) |
istio_request_bytes | 요청 본문 크기 (Distribution) |
istio_response_bytes | 응답 본문 크기 (Distribution) |
istio_request_messages_total | gRPC 클라이언트 메시지 수 (Counter) |
istio_response_messages_total | gRPC 서버 메시지 수 (Counter) |
이 메트릭은 크게 다음 세 가지 개념으로 구분됩니다:
- 메트릭 (Metric): 요청 수, 지연 시간 등의 측정값
- 디멘션 (Dimension): 메트릭을 구분하는 속성 (예: 요청 방향, 응답 코드)
- 속성 (Attribute): 디멘션 값을 구성하는 실제 데이터
예를 들어, 요청 방향(Inbound/Outbound)은 디멘션 중 하나이며, 실제 메트릭 수치 계산 시 해당 값에 따라 별도로 구분됩니다.
디멘션 조합에 따른 메트릭 분리
Envoy 프록시는 디멘션 조합별로 메트릭을 별도로 생성합니다. 아래는 istio_requests_total의 예시입니다.
istio_requests_total{
  response_code="200",
  reporter="destination",
  source_workload="istio-ingressgateway",
  destination_workload="webapp",
  destination_service="webapp.istioinaction.svc.cluster.local",
  request_protocol="http",
  connection_security_policy="mutual_tls"
} 6
이와 같은 구성이 응답 코드가 다를 경우, 다음과 같이 별개의 항목으로 분리됩니다.
istio_requests_total{ response_code="200", ... } 5
istio_requests_total{ response_code="500", ... } 3
디멘션 값을 구성하는 속성 예시
디멘션 값은 Envoy가 내부적으로 수집하는 다양한 속성(attribute)에서 가져옵니다.
요청 속성 예시
속성 설명 request.path전체 URL 경로 request.url_path경로에서 쿼리 제외 request.host요청 호스트 request.schemehttp / https 등 request.headers전체 요청 헤더 request.useragentUser-Agent request.id요청 ID ( x-request-id)request.protocol요청 프로토콜
이 외에도 응답(response.*), 연결(connection.*), 업스트림(upstream.*) 등 다양한 범주의 속성이 존재합니다.
Istio 전용 Peer Metadata 속성
Istio는 proxy 간 메타데이터를 교환하며, 이를 통해 더욱 상세한 디멘션 구성이 가능합니다.
| 속성 | 설명 |
|---|---|
name | 파드 이름 |
namespace | 네임스페이스 |
labels | 라벨 |
owner | 소유자 |
workload_name | 워크로드 이름 |
istio_version | 프록시 버전 |
cluster_id | 클러스터 ID |
mesh_id | 메시 ID |
사용 예시:
downstream_peer.istio_version: 호출자의 프록시 버전upstream_peer.cluster_id: 대상 서비스의 클러스터 식별자
메트릭은 디멘션 조합에 따라 분리되어 저장됩니다.
디멘션 값은 Envoy 또는 Istio에서 제공하는 다양한 속성에서 파생됩니다.
적절한 디멘션 구성을 통해 원하는 수준의 관측 데이터를 수집할 수 있지만, 너무 많은 디멘션은 시계열 데이터 수를 폭발적으로 증가시킬 수 있습니다.
✅ Configuring existing metrics
기본 메트릭 설정 확인
Istio는 설치 시 기본적으로 EnvoyFilter 리소스를 통해 메트릭 수집을 위한 stats 필터를 구성합니다.
이는 Wasm 기반의 플러그인이며, 다음과 같이 각 버전에 대해 설치되어 있습니다:
kubectl get envoyfilter -n istio-system특정 EnvoyFilter 리소스를 확인하면, 다음과 같은 구조로 설정되어 있는 것을 볼 수 있습니다:
spec:
  configPatches:
  - applyTo: HTTP_FILTER
    match:
      context: SIDECAR_OUTBOUND
      ...
    patch:
      operation: INSERT_BEFORE
      value:
        name: istio.stats
        typed_config:
          '@type': type.googleapis.com/udpa.type.v1.TypedStruct
          type_url: type.googleapis.com/envoy.extensions.filters.http.wasm.v3.Wasm
          ...
이 필터는 istio.stats라는 이름의 Wasm 플러그인을 통해 메트릭 수집을 수행합니다. 기본적으로 NULL VM에서 실행되며, 명시적으로 wasmEnabled: true 설정을 하지 않는 이상 Wasm VM을 사용하지 않습니다.
기존 메트릭에 디멘션 추가하기
기존의 requests_total 메트릭에 다음과 같은 디멘션을 추가할 수 있습니다:
upstream_proxy_version: 업스트림 프록시 버전source_mesh_id: 요청을 보낸 메시 ID
또한, 불필요한 디멘션인 request_protocol을 제거할 수 있습니다.
apiVersion: install.istio.io/v1alpha1
kind: IstioOperator
spec:
  profile: demo
  values:
    telemetry:
      v2:
        prometheus:
          configOverride:
            inboundSidecar:
              metrics:
              - name: requests_total
                dimensions:
                  upstream_proxy_version: upstream_peer.istio_version
                  source_mesh_id: node.metadata['MESH_ID']
                tags_to_remove:
                - request_protocol
            outboundSidecar:
              metrics:
              - name: requests_total
                dimensions:
                  upstream_proxy_version: upstream_peer.istio_version
                  source_mesh_id: node.metadata['MESH_ID']
                tags_to_remove:
                - request_protocol
            gateway:
              metrics:
              - name: requests_total
                dimensions:
                  upstream_proxy_version: upstream_peer.istio_version
                  source_mesh_id: node.metadata['MESH_ID']
                tags_to_remove:
                - request_protocol
설정 적용:
istioctl install -f istio-operator-new-dimensions.yaml -y적용된 설정은 다음 명령어로 확인 가능합니다:
kubectl get istiooperator -n istio-system installed-state -o yaml | grep -A9 "prometheus:"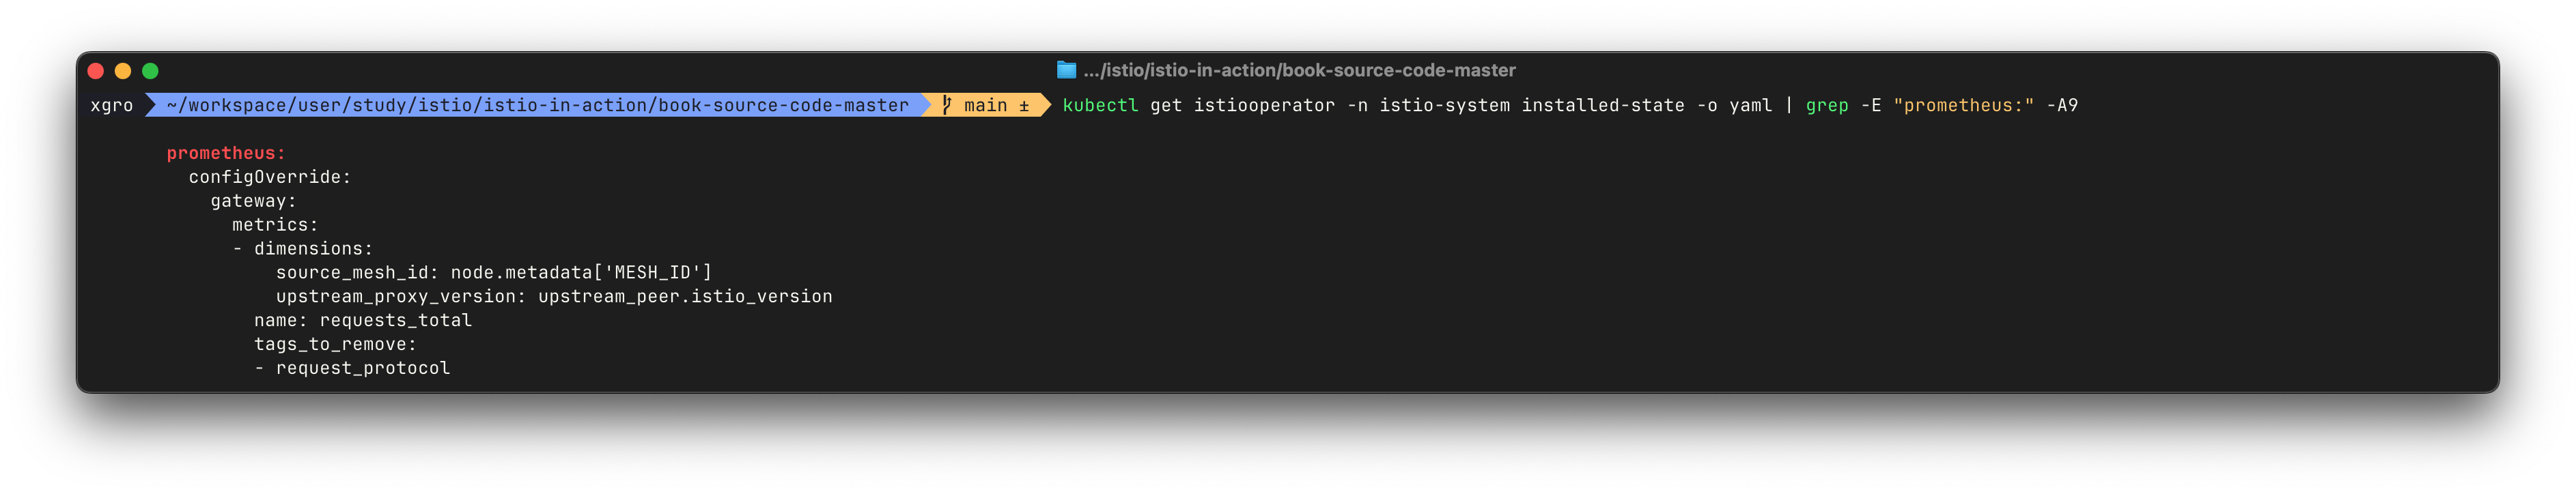
그리고 각 EnvoyFilter 리소스에도 적용 여부를 확인합니다:
kubectl get envoyfilter stats-filter-1.17 -n istio-system -o yaml | grep MESH_ID추가 디멘션 적용을 위한 애노테이션 설정 (1.17 이하)
1.17 이하 버전에서는 새 디멘션을 활성화하기 위해 다음과 같은 애노테이션이 필요합니다:
annotations:
  proxy.istio.io/config: |-
    extraStatTags:
    - "upstream_proxy_version"
    - "source_mesh_id"
1.17 버전 이후에는 extraStatTags가 필요 없습니다. 관련 변경 사항은 아래 링크에서 확인할 수 있습니다:
커스텀 Telemetry 리소스를 통한 디멘션 추가
다음과 같이 Telemetry 리소스를 활용하여 source_mesh_id 및 upstream_proxy_version 디멘션을 추가하고, request_protocol 디멘션은 제거할 수 있습니다:
apiVersion: telemetry.istio.io/v1alpha1
kind: Telemetry
metadata:
  name: add-dimension-tags
  namespace: istioinaction
spec:
  metrics:
  - providers:
      - name: prometheus
    overrides:
      - match:
          metric: REQUEST_COUNT
          mode: CLIENT_AND_SERVER
        disabled: false
        tagOverrides:
          upstream_proxy_version:
            operation: UPSERT
            value: upstream_peer.istio_version
          source_mesh_id:
            operation: UPSERT
            value: node.metadata['MESH_ID']
          request_protocol:
            operation: REMOVE
적용:
kubectl apply -n istioinaction -f ch7/metrics/v2/add-dimensions-telemetry.yaml결과 확인
적용 후, istio_requests_total 메트릭을 다음과 같이 확인할 수 있습니다:
kubectl -n istioinaction exec -it deploy/webapp -c istio-proxy -- \
curl localhost:15000/stats/prometheus | grep istio_requests_total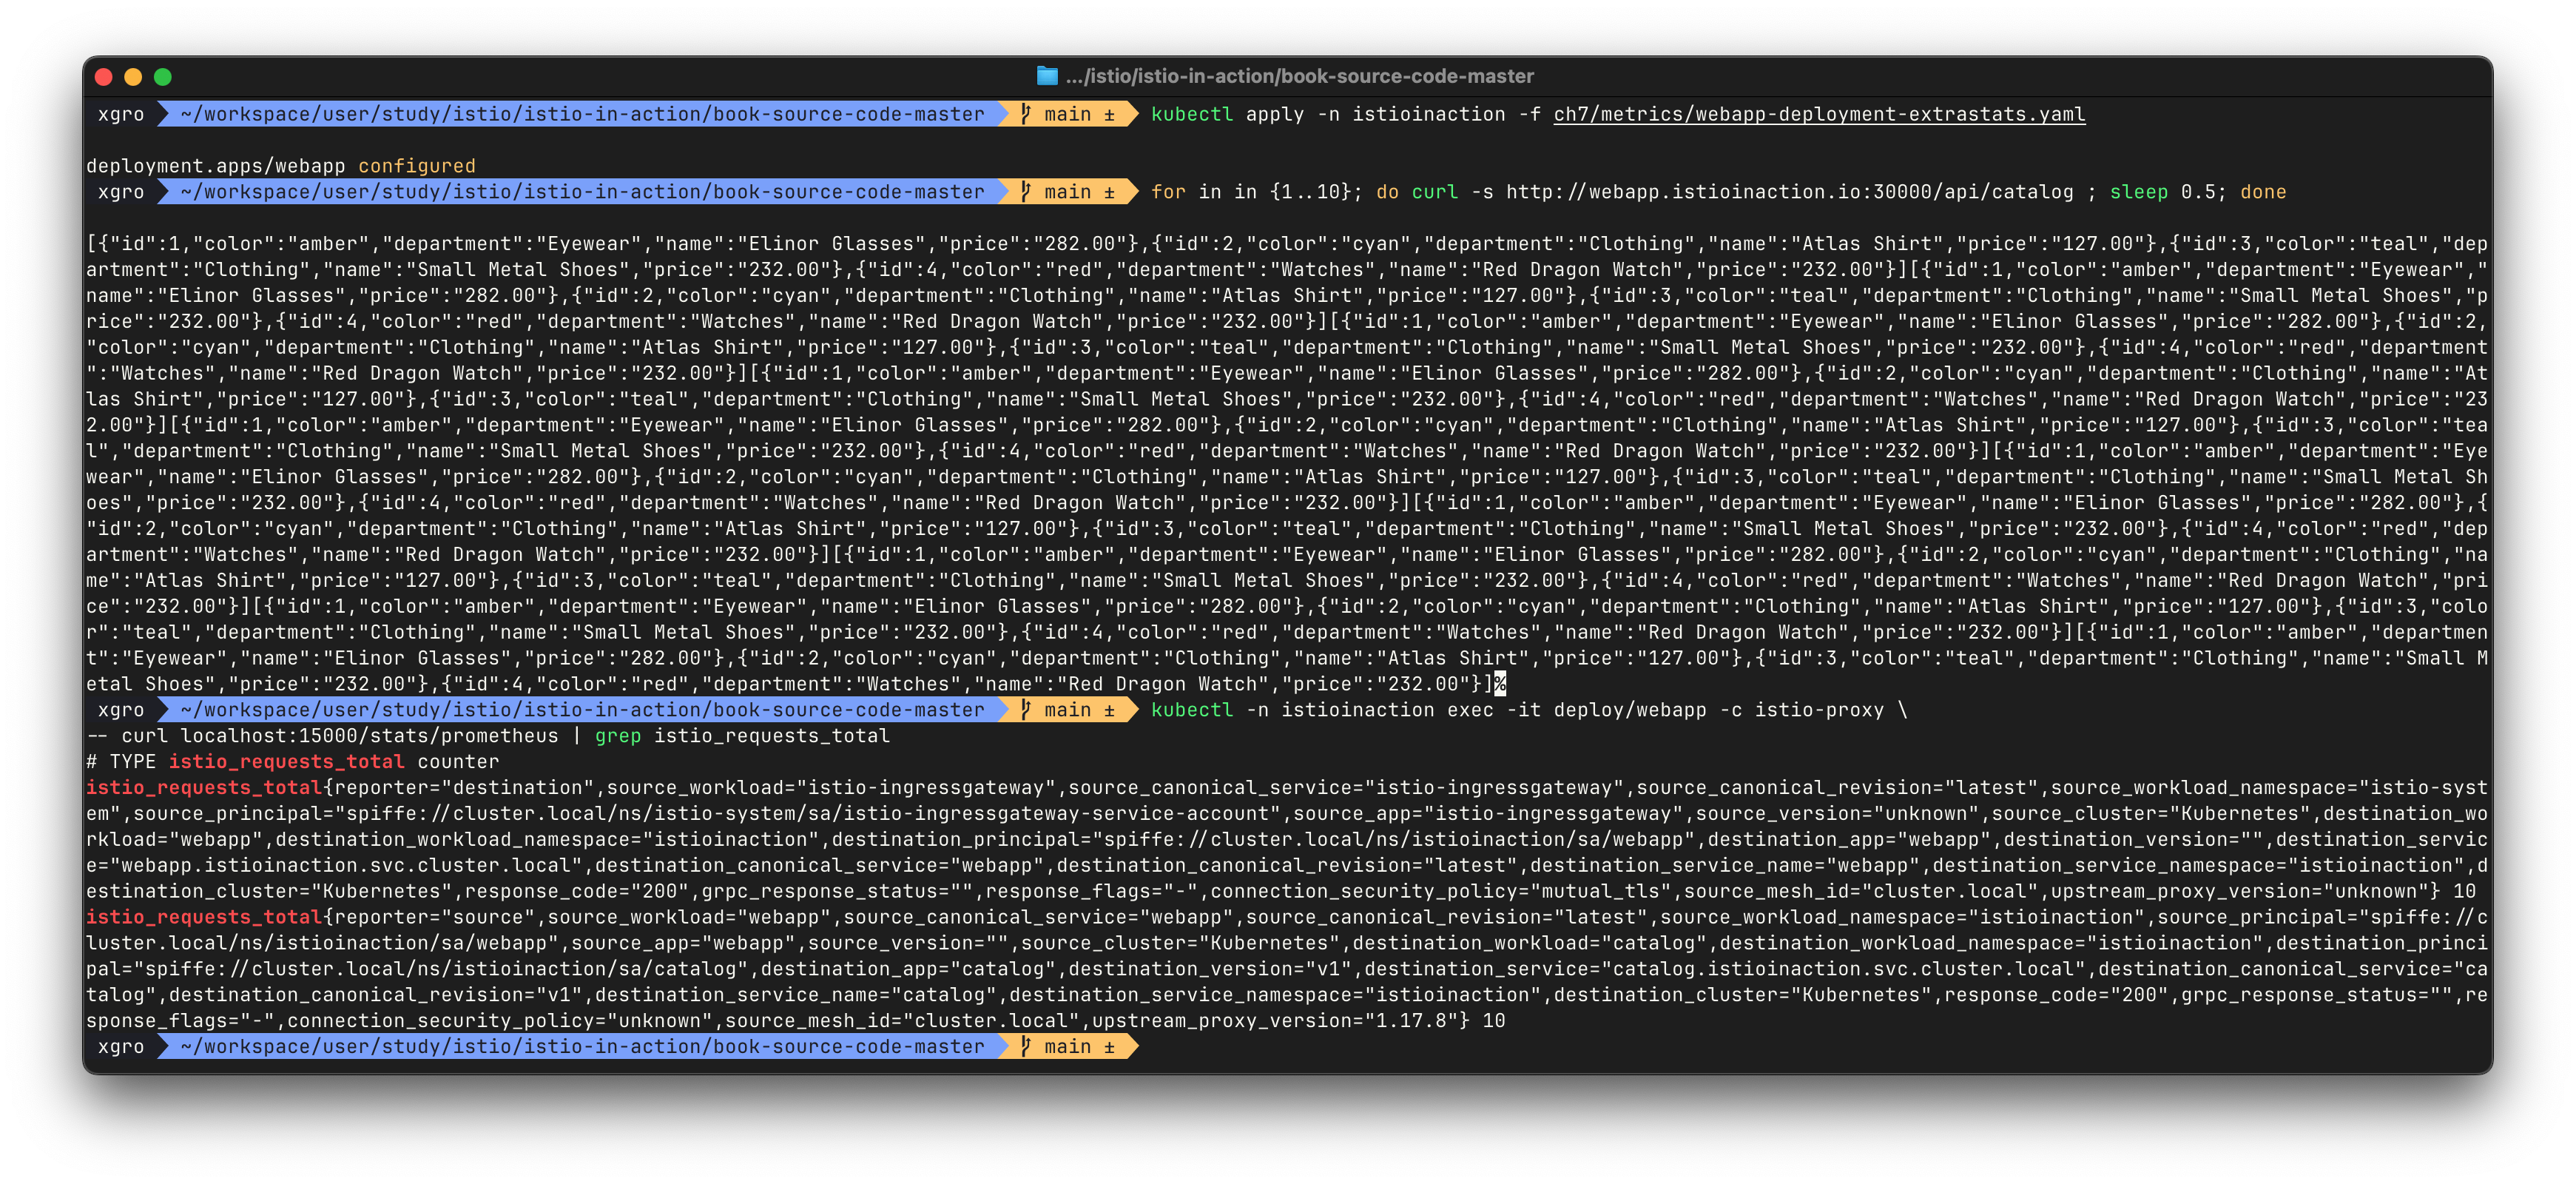
출력 결과에는 다음과 같이 새로운 디멘션이 포함됩니다:
... source_mesh_id="cluster.local", upstream_proxy_version="1.17.8" ...웹 UI에서도 확인 가능:
http://127.0.0.1:30001/graph?g0.expr=istio_requests_total&g0.tab=1
✅ 새로운 메트릭 만들기
EnvoyFilter를 통한 메트릭 정의
기존의 표준 메트릭 디멘션을 커스터마이징하는 대신, 새로운 메트릭을 추가하려면 IstioOperator 설정에서 configOverride를 활용하여 직접 정의할 수 있습니다.
이 실습에서는 GET 요청의 횟수를 집계하는 새로운 메트릭 istio_get_calls를 생성합니다.
설정 파일 정의
# istio-operator-new-metric.yaml
apiVersion: install.istio.io/v1alpha1
kind: IstioOperator
spec:
  profile: demo
  values:
    telemetry:
      v2:
        prometheus:
          configOverride:
            inboundSidecar:
              definitions:
              - name: get_calls
                type: COUNTER
                value: "(request.method.startsWith('GET') ? 1 : 0)"
            outboundSidecar:
              definitions:
              - name: get_calls
                type: COUNTER
                value: "(request.method.startsWith('GET') ? 1 : 0)"
            gateway:
              definitions:
              - name: get_calls
                type: COUNTER
                value: "(request.method.startsWith('GET') ? 1 : 0)"
이 설정을 적용해서 istio_get_calls 라는 새 메트릭을 만들어 봅니다.
# 설정 적용
docker exec -it myk8s-control-plane bash
----------------------------------------
cat << EOF > istio-operator-new-metric.yaml
apiVersion: install.istio.io/v1alpha1
kind: IstioOperator
spec:
  profile: demo
  values:
    telemetry:
      v2:
        prometheus:
          configOverride:
            inboundSidecar:
              definitions:
              - name: get_calls
                type: COUNTER
                value: "(request.method.startsWith('GET') ? 1 : 0)"
            outboundSidecar:
              definitions:
              - name: get_calls
                type: COUNTER
                value: "(request.method.startsWith('GET') ? 1 : 0)"
            gateway:
              definitions:
              - name: get_calls
                type: COUNTER
                value: "(request.method.startsWith('GET') ? 1 : 0)"
EOF

istioctl verify-install -f istio-operator-new-metric.yaml # 리소스별로 적용결과를 출력
istioctl install -f istio-operator-new-metric.yaml -y

exit
----------------------------------------

# 확인
kubectl get istiooperator -n istio-system installed-state -o yaml  | grep -A2 get_calls$
              - name: get_calls
                type: COUNTER
                value: '(request.method.startsWith(''GET'') ? 1 : 0)''
...

kubectl get envoyfilter -n istio-system stats-filter-1.13 -o yaml | grep get_calls
...
{"definitions":[{"name":"get_calls","type":"COUNTER","value":"(request.method.startsWith('GET') ? 1 : 0)"}]}
...
프록시가 새로 정의된 메트릭을 수집하도록 하기 위해 proxyStatsMatcher 애노테이션을 파드 템플릿에 추가합니다.
# webapp 디플로이먼트의 파드 사양에 애너테이션을 추가한다
cat ch7/metrics/webapp-deployment-new-metric.yaml
...
  template:
    metadata:
      annotations:
        proxy.istio.io/config: |-
          proxyStatsMatcher:
            inclusionPrefixes:
            - "istio_get_calls"
      labels:
        app: webapp
...

#
kubectl -n istioinaction apply -f ch7/metrics/webapp-deployment-new-metric.yaml
트래픽을 유도한 후, 프록시 내부에서 새 메트릭이 생성되었는지 확인합니다.
# metric 확인을 위해서 호출테스트
for in in {1..10}; do curl -s http://webapp.istioinaction.io:30000/api/catalog ; sleep 0.5; done
while true; do curl -s http://webapp.istioinaction.io:30000/api/catalog ; date "+%Y-%m-%d %H:%M:%S" ; sleep 1; echo; done

# 메트릭 확인
kubectl -n istioinaction exec -it deploy/webapp -c istio-proxy -- curl localhost:15000/stats/prometheus | grep istio_get_calls
# TYPE istio_get_calls counter
istio_get_calls{} 20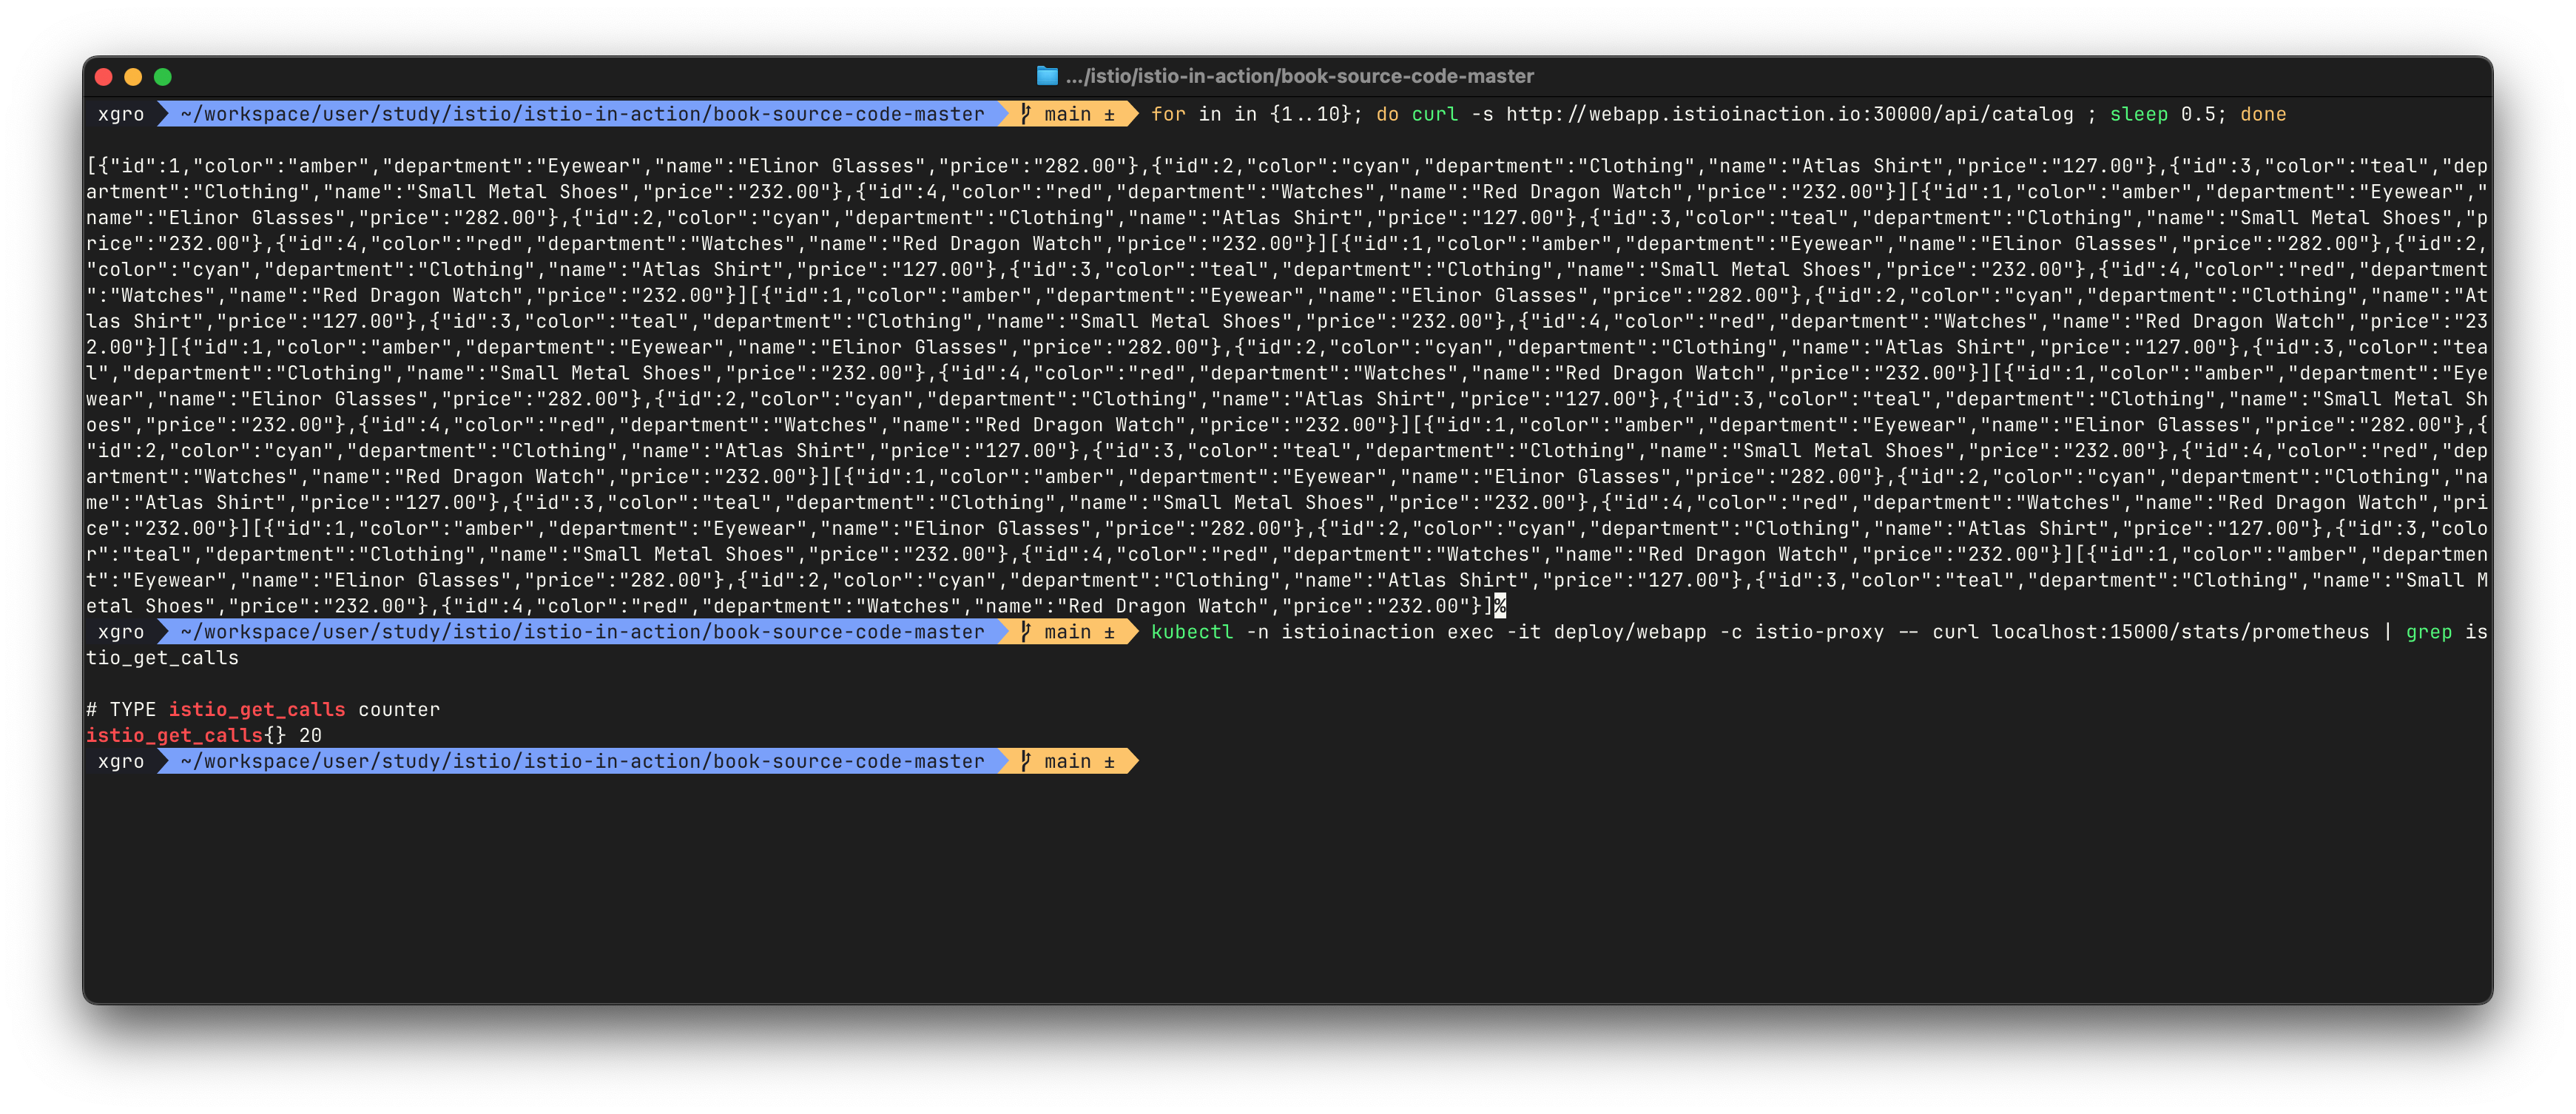
이 메트릭에는 디멘션을 따로 지정하지 않았지만, 앞 절과 같은 방식으로 원하는 디멘션을 추가할 수 있습니다.
✅ 새 속성으로 호출 그룹화하기(Grouping calls with new attributes)
attribute-gen 필터로 사용자 정의 속성 만들기
EnvoyFilter를 활용해 새로운 속성(istio_operationId)을 정의하여 /items 경로로 향하는 다양한 HTTP 메서드 호출을 구분합니다.
이때 사용하는 attribute-gen 필터는 stats 필터보다 먼저 동작하며, stats 필터가 사용할 수 있는 사용자 정의 속성을 생성합니다.
cat ch7/metrics/attribute-gen.yaml
apiVersion: networking.istio.io/v1alpha3
kind: EnvoyFilter
metadata:
  name: attribute-gen-example
  namespace: istioinaction
spec:
  configPatches:
  ## Sidecar Outbound
  - applyTo: HTTP_FILTER
    match:
      context: SIDECAR_OUTBOUND
      listener:
        filterChain:
          filter:
            name: envoy.filters.network.http_connection_manager
            subFilter:
              name: istio.stats
      proxy:
        proxyVersion: ^1\.13.*
    patch:
      operation: INSERT_BEFORE
      value:
        name: istio.attributegen
        typed_config:
          '@type': type.googleapis.com/udpa.type.v1.TypedStruct
          type_url: type.googleapis.com/envoy.extensions.filters.http.wasm.v3.Wasm
          value:
            config:
              configuration:
                '@type': type.googleapis.com/google.protobuf.StringValue
                value: |
                  {
                    "attributes": [
                      {
                        "output_attribute": "istio_operationId", # 속성 이름
                        "match": [
                         {
                           "value": "getitems", # 속성 값
                           "condition": "request.url_path == '/items' && request.method == 'GET'"
                         },
                         {
                           "value": "createitem",
                           "condition": "request.url_path == '/items' && request.method == 'POST'"
                         },
                         {
                           "value": "deleteitem",
                           "condition": "request.url_path == '/items' && request.method == 'DELETE'"
                         }
                       ]
                      }
                    ]
                  }
              vm_config:
                code:
                  local:
                    inline_string: envoy.wasm.attributegen
                runtime: envoy.wasm.runtime.null
아래 attribute-gen.yaml 을 적용하기 전에 proxyVersion: ^1\.16.* 을 설치된 istio 버전에 맞게 1.16 혹은 1.17 로 수정합니다.
#
docker exec -it myk8s-control-plane istioctl version
client version: 1.17.8
control plane version: 1.17.8
data plane version: 1.17.8 (4 proxies)

#
vi ch7/metrics/attribute-gen.yaml # 혹은 open ch7/metrics/attribute-gen.yaml 후 수정
...
      proxy:
        proxyVersion: ^1\.17.* # 수정
...

# 버전을 수정 후 envoyfilter 를 배포합니다. envoyfilter를 배포한 네임스페이스의 istio-proxy들에 적용 됩니다
kubectl apply -f ch7/metrics/attribute-gen.yaml -n istioinaction

# 확인
kubectl get envoyfilter -n istioinaction -o yaml | kubectl neat
kubectl get envoyfilter -n istioinaction
NAME                    AGE
attribute-gen-example   12s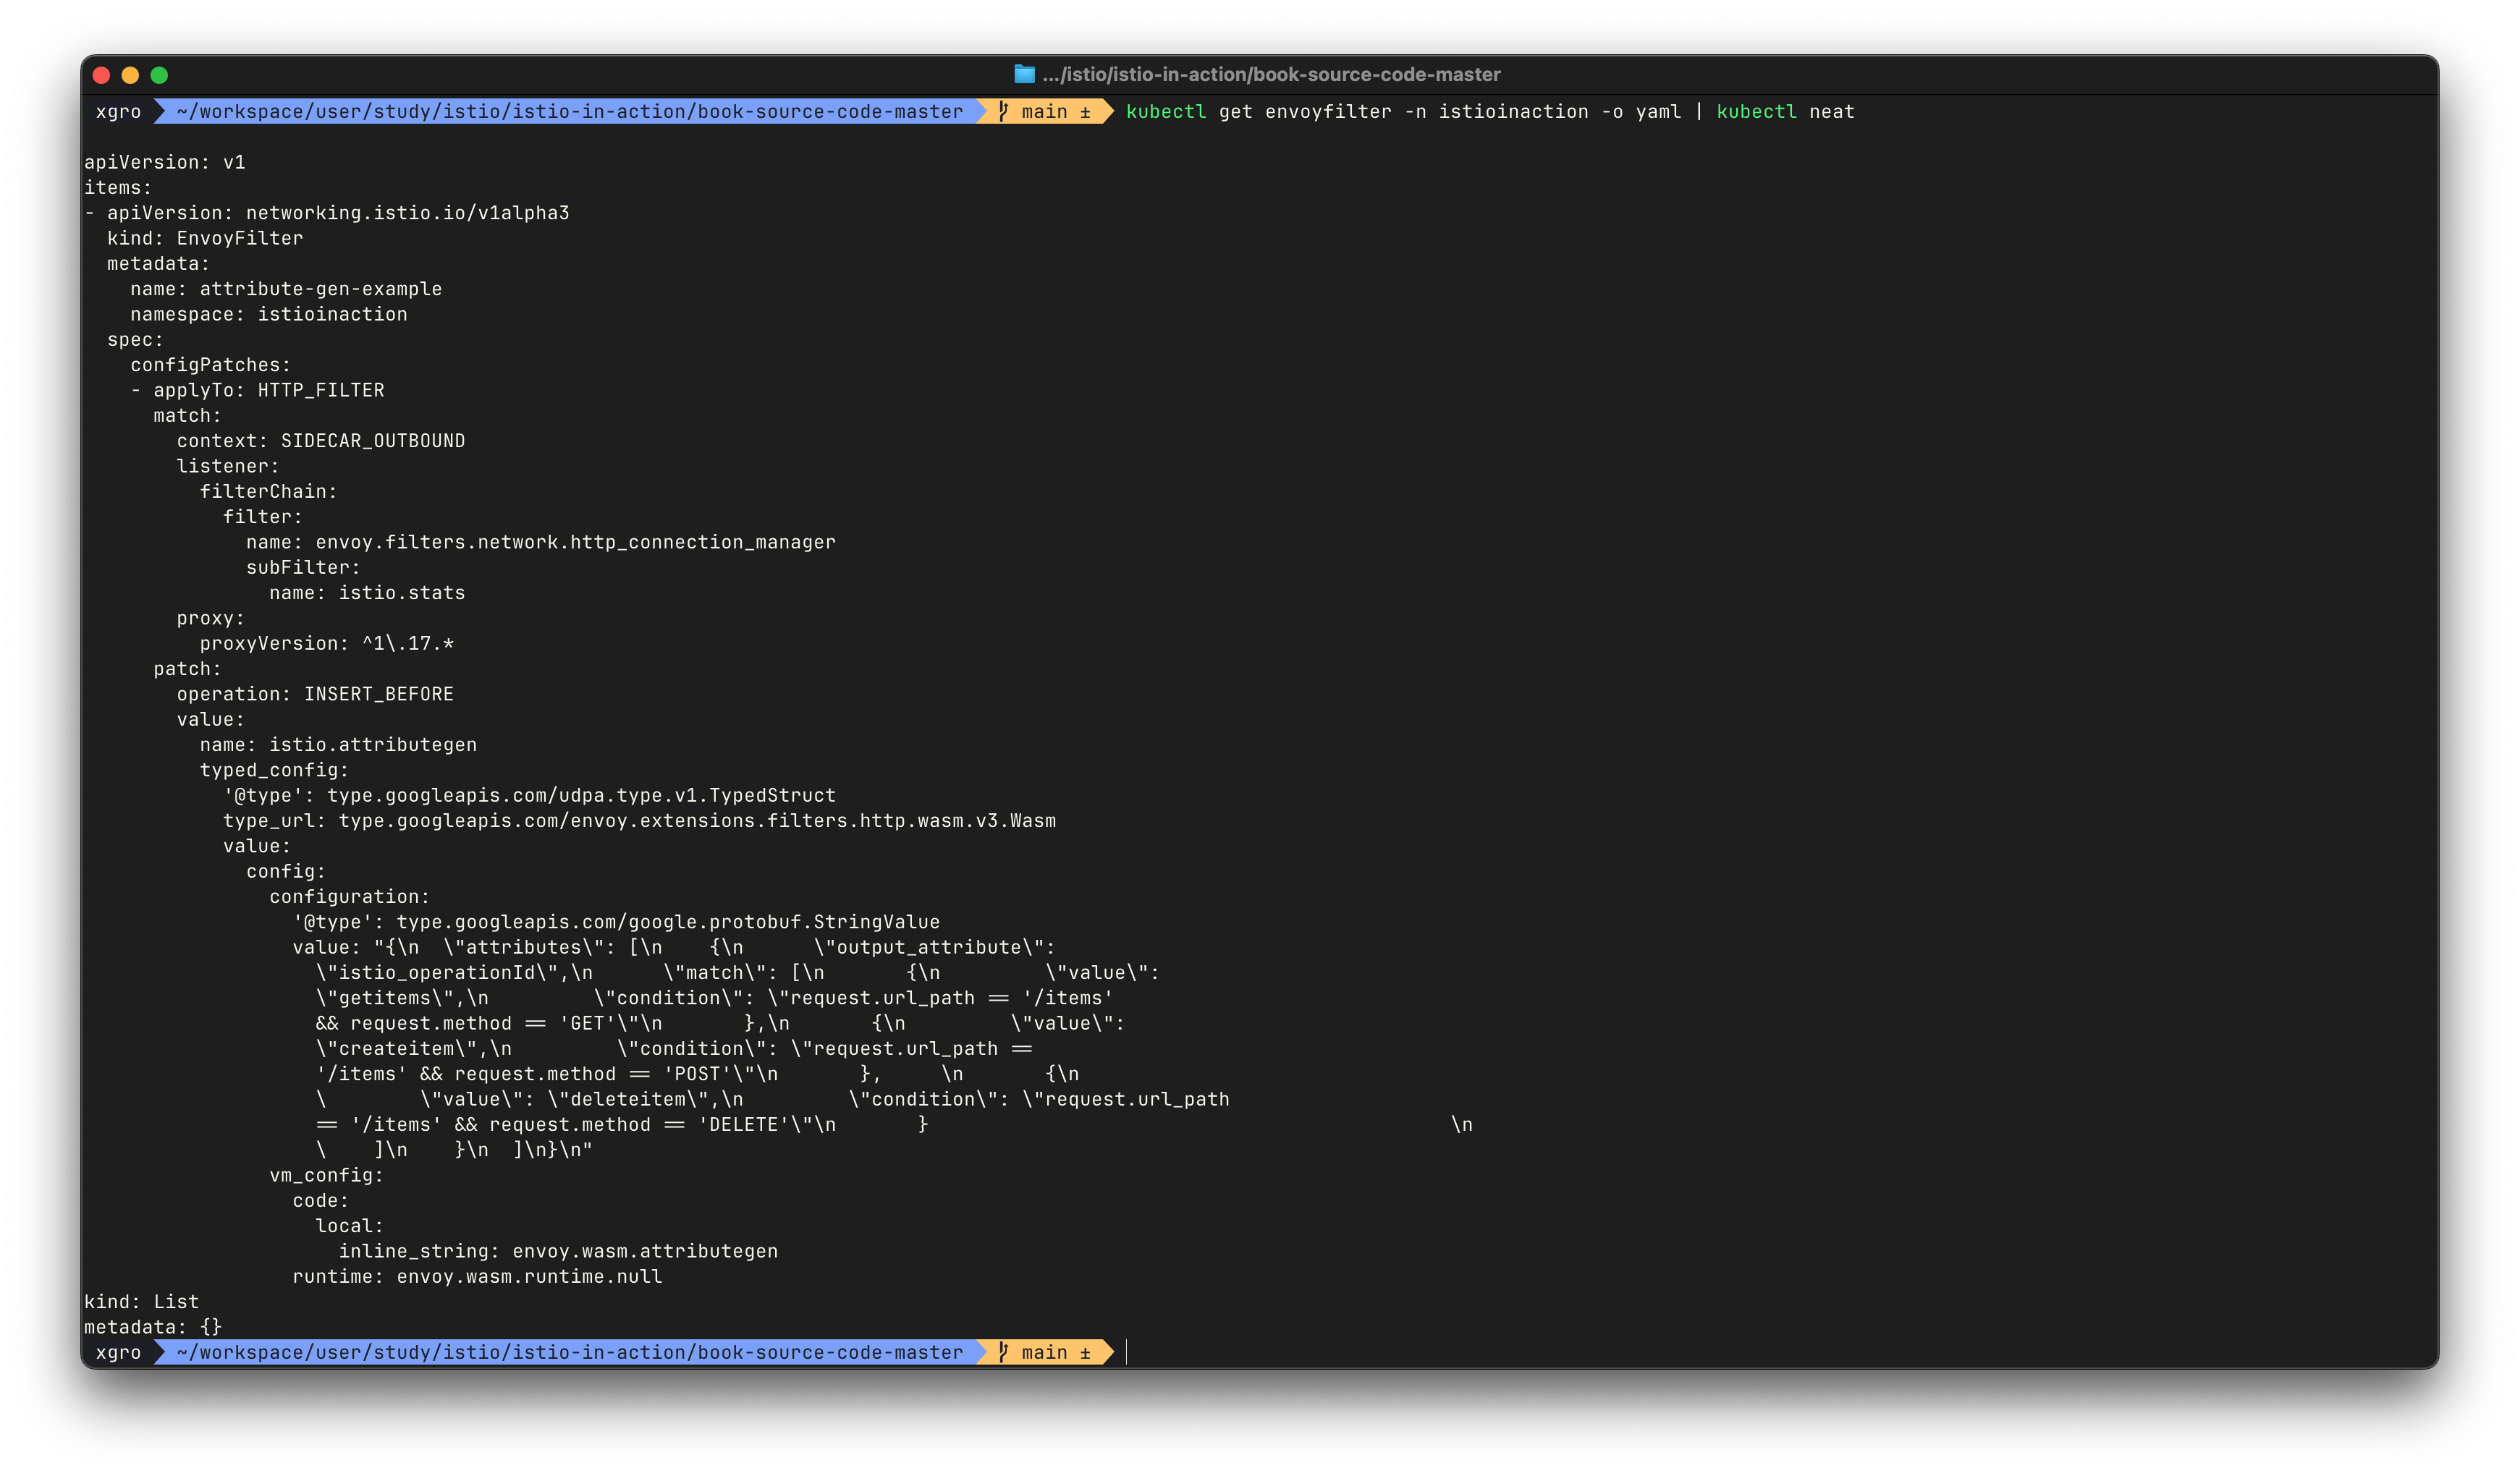
다음으로, 생성된 istio_operationId 속성을 새로운 디멘션으로 stats 필터에 추가합니다. 이를 통해 requests_total 메트릭에 upstream_operation 디멘션이 추가됩니다.
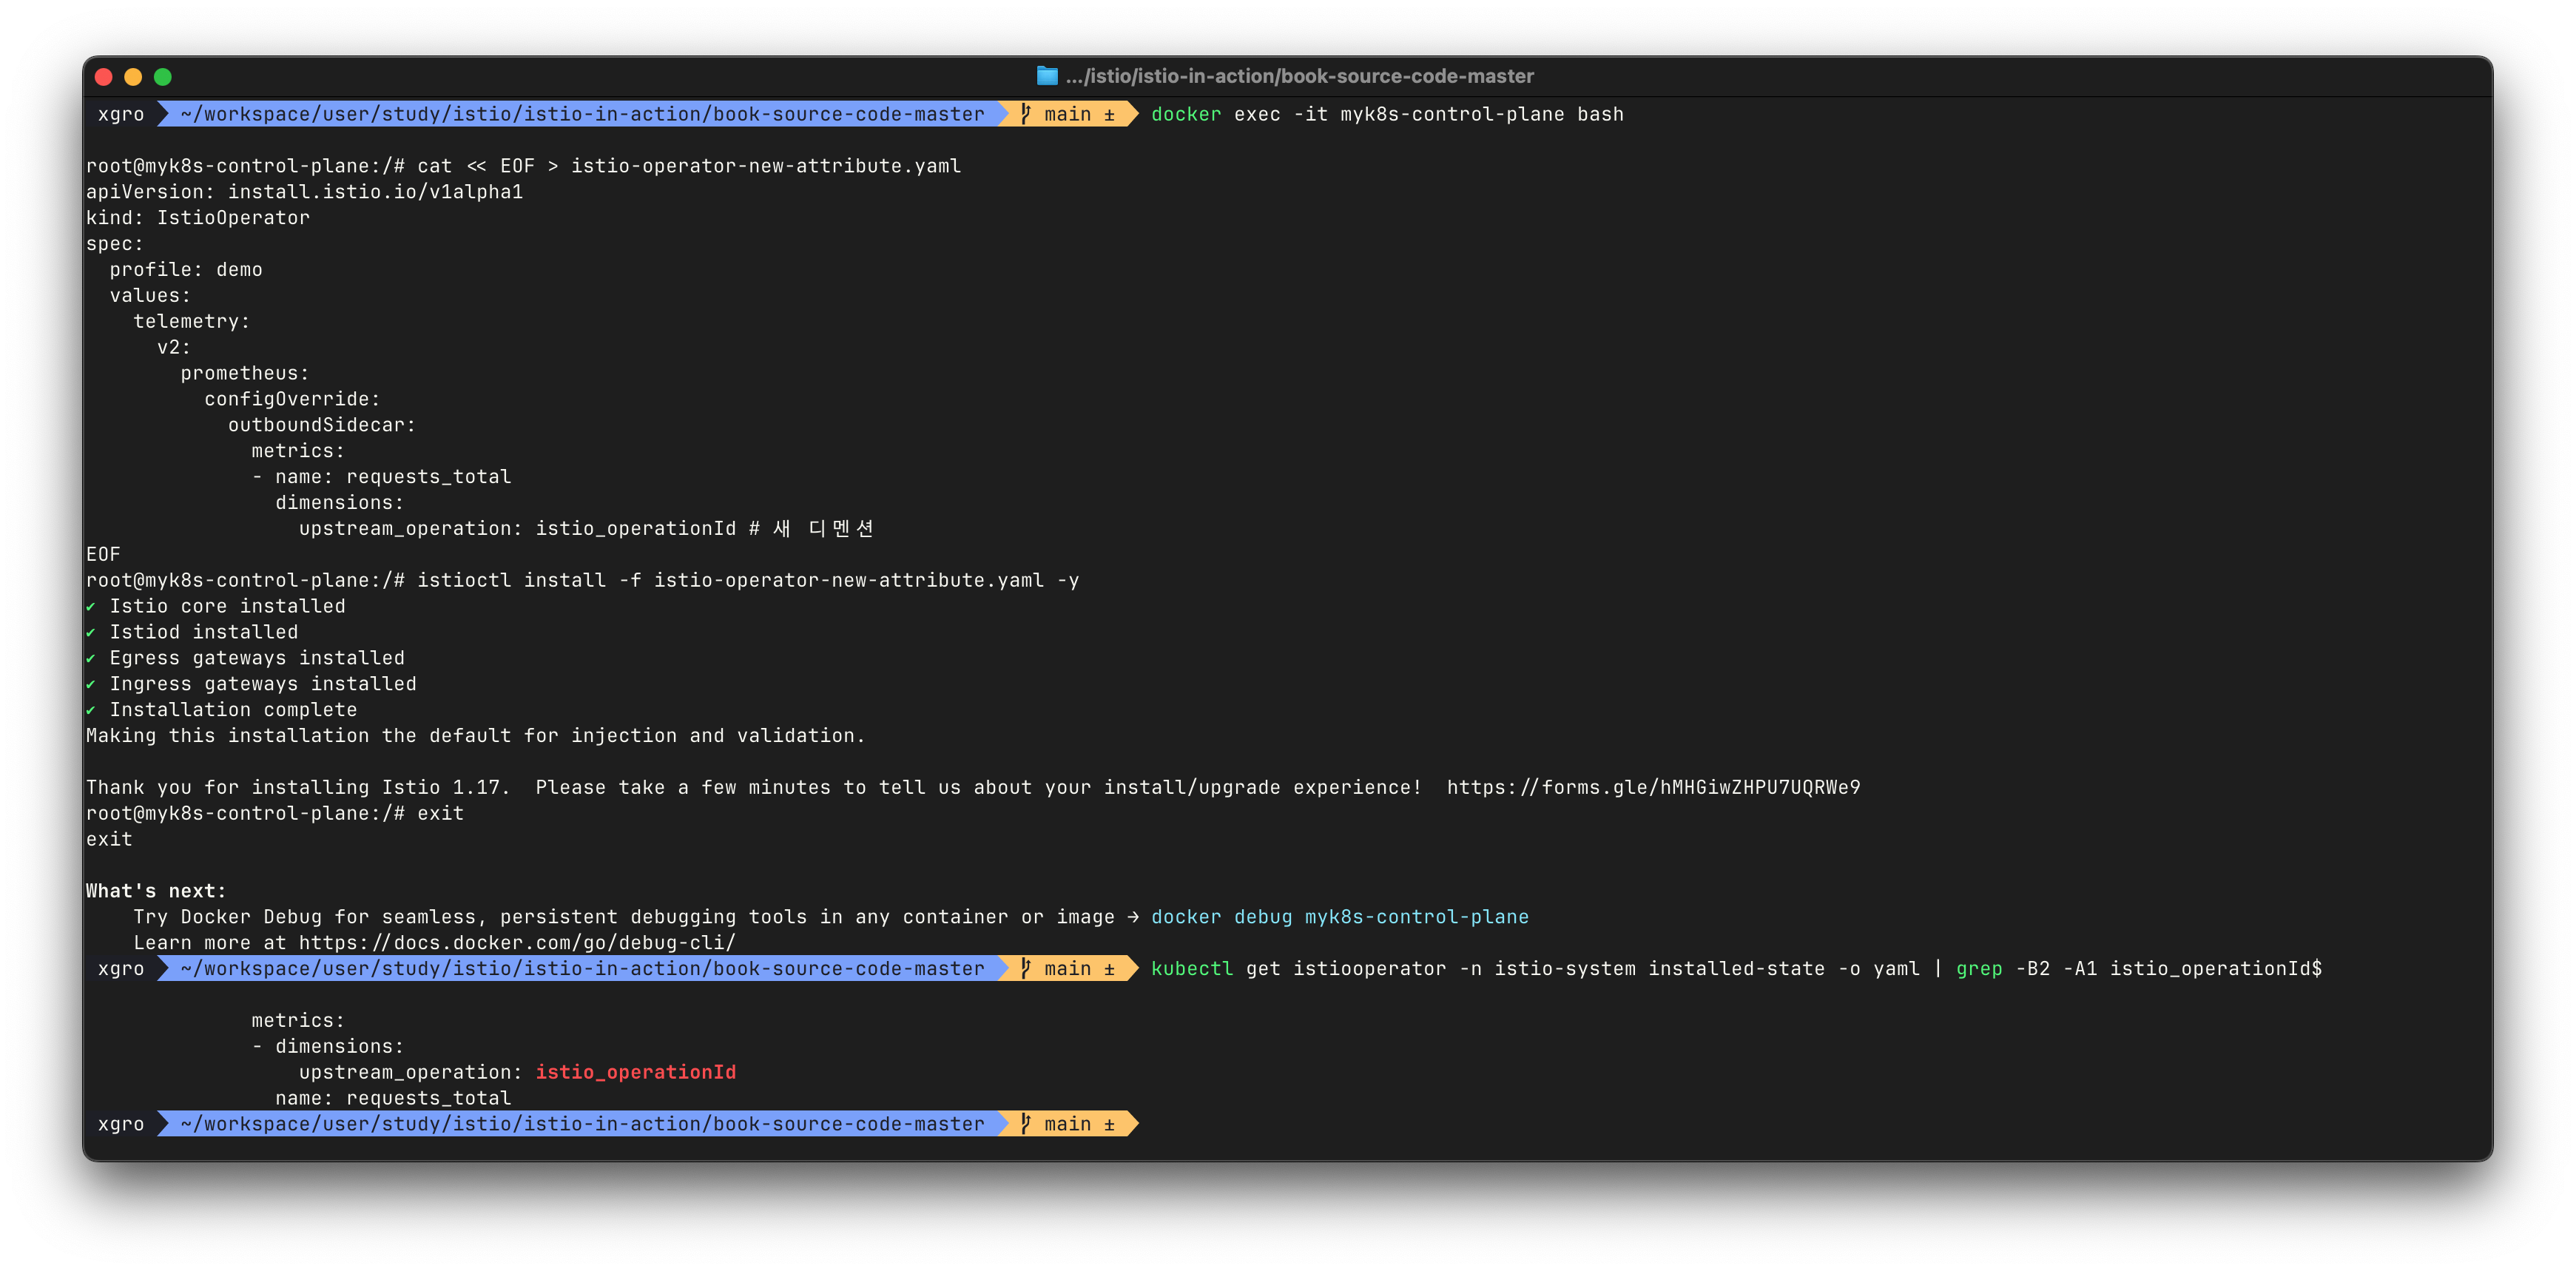
# 설정 적용
docker exec -it myk8s-control-plane bash
----------------------------------------
cat << EOF > istio-operator-new-attribute.yaml
apiVersion: install.istio.io/v1alpha1
kind: IstioOperator
spec:
  profile: demo
  values:
    telemetry:
      v2:
        prometheus:
          configOverride:
            outboundSidecar:
              metrics:
              - name: requests_total
                dimensions:
                  upstream_operation: istio_operationId # 새 디멘션
EOF
istioctl verify-install -f istio-operator-new-attribute.yaml # 리소스별로 적용결과를 출력
istioctl install -f istio-operator-new-attribute.yaml -y

exit
----------------------------------------

# 확인 : outboundSidecar 에만 적용됨
kubectl get istiooperator -n istio-system installed-state -o yaml | grep -B2 -A1 istio_operationId$
              metrics:
              - dimensions:
                  upstream_operation: istio_operationId
                name: requests_total

#
kubectl get envoyfilter -n istio-system stats-filter-1.17 -o yaml | kubectl neat
...
spec:
  configPatches:
  - applyTo: HTTP_FILTER
    match:
      context: SIDECAR_OUTBOUND
      listener:
        filterChain:
          filter:
            name: envoy.filters.network.http_connection_manager
            subFilter:
              name: envoy.filters.http.router
      proxy:
        proxyVersion: ^1\.17.*
    patch:
      operation: INSERT_BEFORE
      value:
        name: istio.stats
        typed_config:
          '@type': type.googleapis.com/udpa.type.v1.TypedStruct
          type_url: type.googleapis.com/stats.PluginConfig
          value:
            metrics:
            - dimensions:
                upstream_operation: istio_operationId
              name: requests_total
...

kubectl get envoyfilter -n istio-system stats-filter-1.16 -o yaml | grep istio_operationId -B15 -A5
kubectl get envoyfilter -n istio-system stats-filter-1.15 -o yaml | grep istio_operationId -B15 -A5
kubectl get envoyfilter -n istio-system stats-filter-1.14 -o yaml | grep istio_operationId -B15 -A5
kubectl get envoyfilter -n istio-system stats-filter-1.13 -o yaml | grep istio_operationId -B15 -A5
...
호출하고 이를 확인합니다.
# metric 확인을 위해서 호출테스트
for in in {1..10}; do curl -s http://webapp.istioinaction.io:30000/api/catalog ; sleep 0.5; done
while true; do curl -s http://webapp.istioinaction.io:30000/api/catalog ; date "+%Y-%m-%d %H:%M:%S" ; sleep 1; echo; done

# 메트릭 확인 : dimension (upstream_operation) 추가 확인!
kubectl -n istioinaction exec -it deploy/webapp -c istio-proxy -- curl localhost:15000/stats/prometheus | grep istio_requests_total
istio_requests_total{reporter="destination",source_workload="istio-ingressgateway",source_canonical_service="istio-ingressgateway",source_canonical_revision="latest",source_workload_namespace="istio-system",source_principal="spiffe://cluster.local/ns/istio-system/sa/istio-ingressgateway-service-account",source_app="istio-ingressgateway",source_version="unknown",source_cluster="Kubernetes",destination_workload="webapp",destination_workload_namespace="istioinaction",destination_principal="spiffe://cluster.local/ns/istioinaction/sa/webapp",destination_app="webapp",destination_version="",destination_service="webapp.istioinaction.svc.cluster.local",destination_canonical_service="webapp",destination_canonical_revision="latest",destination_service_name="webapp",destination_service_namespace="istioinaction",destination_cluster="Kubernetes",request_protocol="http",response_code="200",grpc_response_status="",response_flags="-",connection_security_policy="mutual_tls"} 10
istio_requests_total{reporter="source",source_workload="webapp",source_canonical_service="webapp",source_canonical_revision="latest",source_workload_namespace="istioinaction",source_principal="spiffe://cluster.local/ns/istioinaction/sa/webapp",source_app="webapp",source_version="",source_cluster="Kubernetes",destination_workload="catalog",destination_workload_namespace="istioinaction",destination_principal="spiffe://cluster.local/ns/istioinaction/sa/catalog",destination_app="catalog",destination_version="v1",destination_service="catalog.istioinaction.svc.cluster.local",destination_canonical_service="catalog",destination_canonical_revision="v1",destination_service_name="catalog",destination_service_namespace="istioinac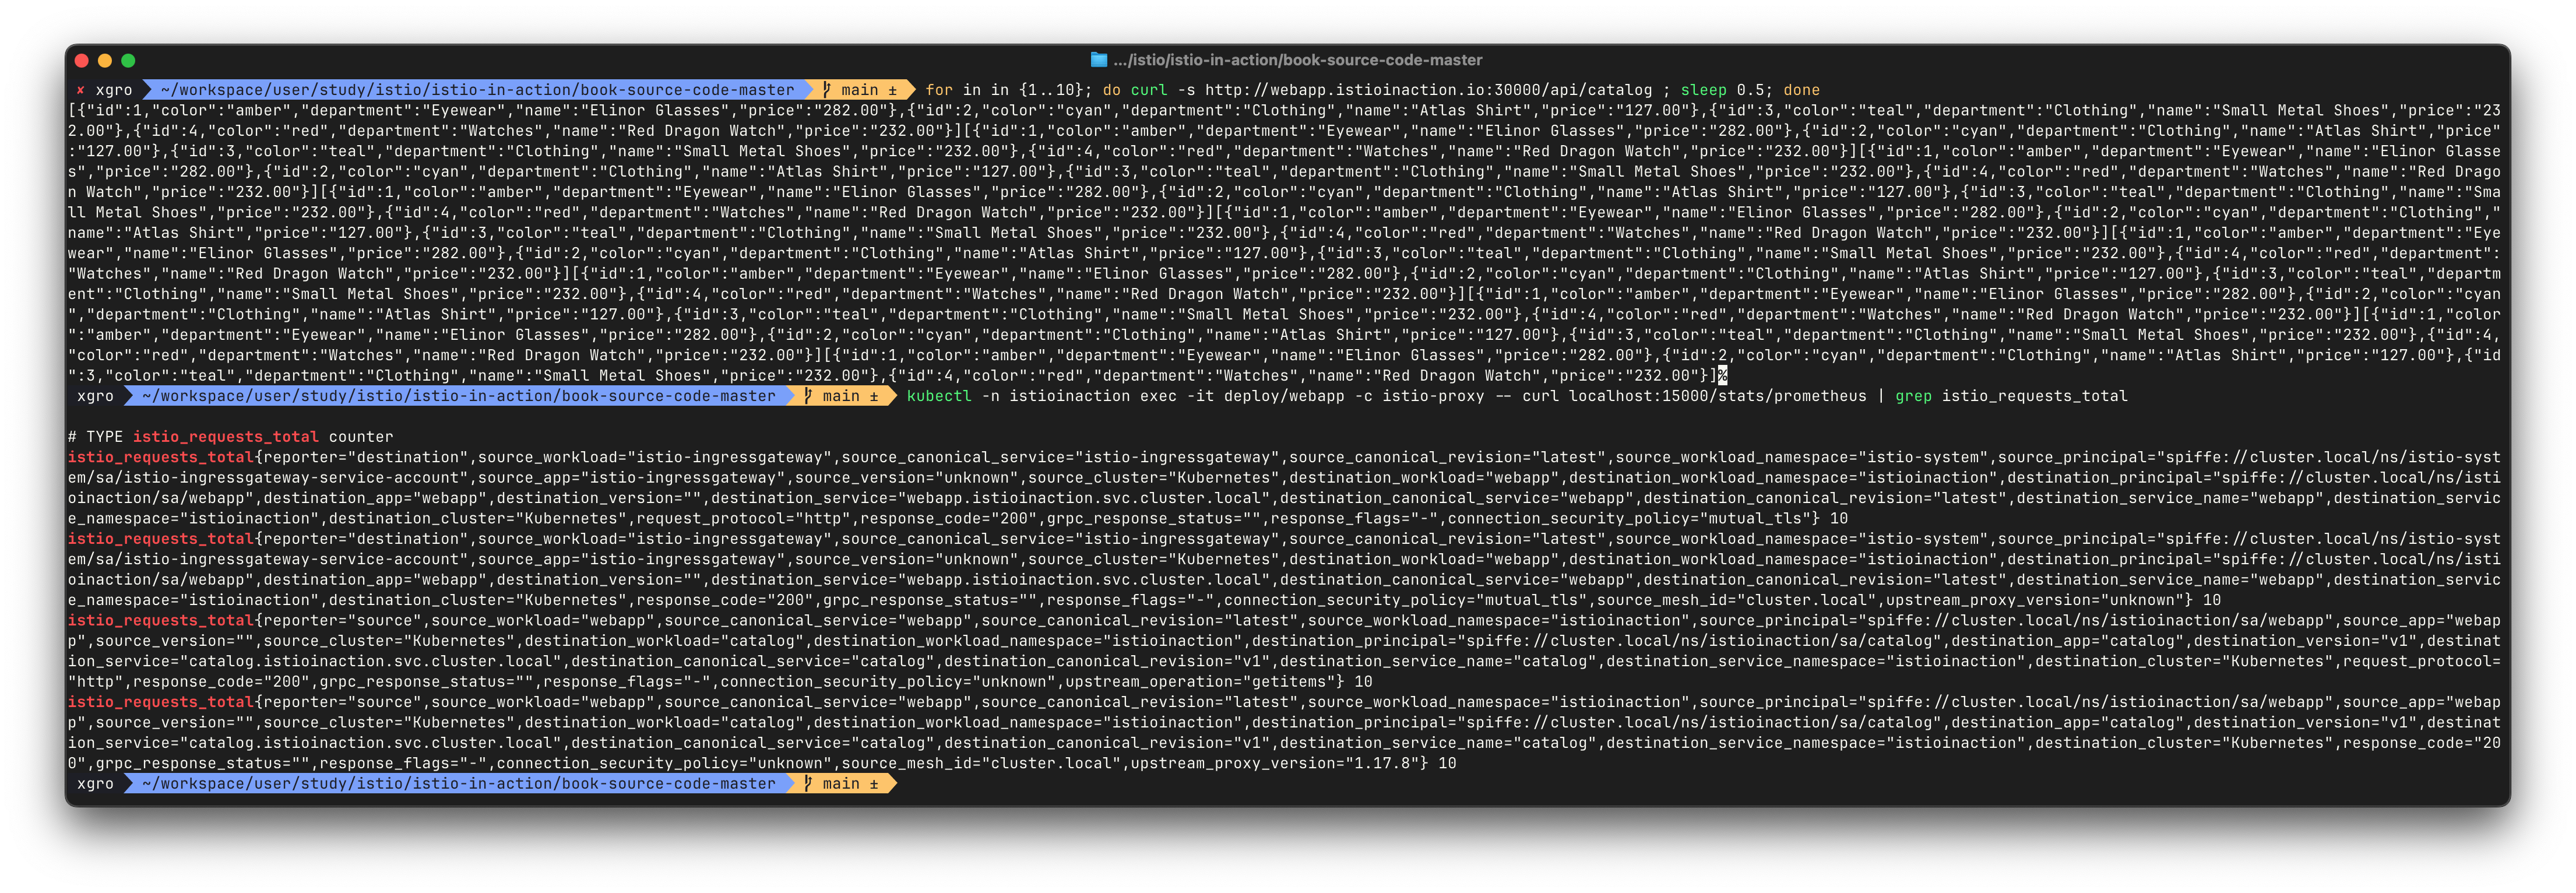
이처럼 attribute-gen 플러그인을 통해 사용자 정의 속성을 만들어 메트릭을 세분화하면, 단순한 호출 수 이상의 정보를 파악할 수 있습니다.
서비스 간 통신의 복잡성이 증가하는 마이크로서비스 아키텍처 환경에서, 명확한 관찰 가능성(observability)은 필수입니다.
Istio는 코드 수정 없이도 성공률, 실패율, 재시도 횟수, 지연 시간과 같은 지표를 자동으로 수집할 수 있게 해주며,
이러한 황금 신호(golden signals)는 시스템의 상태를 감지하고 대응하기 위한 핵심 지표로 작용합니다.
→ 지연 시간(Latency), 처리량(Throughput), 오류(Errors), 포화도(Saturation)
참고: Google SRE Book - Monitoring Distributed Systems
📌 Conclusion
이번 장에서는 Istio가 제공하는 관측성(Observability)의 핵심 구성 요소인 메트릭 시스템에 대해 심도 있게 다뤘습니다.
Istio는 사이드카 프록시를 통해 서비스 간 네트워크 트래픽을 투명하게 가로채고, 그 과정에서 수집되는 다양한 지표들을 통해 마이크로서비스 환경의 가시성을 극대화합니다.
프록시에서 기본적으로 수집되는 메트릭(예: istio_requests_total)은 성공률, 오류율, 지연 시간과 같은 핵심 신호를 파악하는 데 유용하며, 추가적으로 디멘션을 확장하거나 새로운 메트릭을 정의함으로써 도메인 특화 관찰이 가능해집니다.
이 과정에서 다음과 같은 기술들이 조화롭게 사용되었습니다:
- Prometheus Operator를 통한 ServiceMonitor / PodMonitor 구성으로 Istio 워크로드 및 컨트롤 플레인의 메트릭 스크래핑
IstioOperator리소스를 활용한 기존 메트릭 커스터마이징 및 디멘션 추가 (dimensions,tags_to_remove)- WASM 기반 stats 필터를 통해 메트릭 생성을 정밀하게 제어
proxy.istio.io/config애노테이션을 통한 프록시 측 설정 적용- attribute-gen 필터를 통한 동적 속성 정의 및 메트릭에 디멘션으로 활용
이러한 설정을 통해 다음과 같은 목표를 달성할 수 있었습니다:
- 업스트림 프록시 버전, mesh ID 등 도메인 특화된 디멘션 추가
- 특정 API 호출(
GET /items)을 정의한 속성(operationId) 기준으로 그룹화 - 사용자 정의 메트릭(
istio_get_calls)을 정의하고 Prometheus에서 직접 쿼리
이는 단순한 시스템 모니터링을 넘어, 서비스 호출의 의미 기반 추적으로 이어지는 확장된 관찰 체계를 구성하는 기반이 됩니다.
특히 중요했던 점은, 이러한 모든 메트릭 수집 로직이 어플리케이션 코드 변경 없이 Istio 설정만으로 가능했다는 점입니다.
이는 운영자와 개발자 간 책임을 분리하면서도, 관찰 가능한 시스템을 구축하는 데 있어 강력한 무기가 됩니다.
결론적으로, 이번 장의 학습을 통해 다음과 같은 인사이트를 얻었습니다:
- Istio는 마이크로서비스 환경의 황금 신호(Golden Signals)를 자동 수집하고 확장 가능하게 구성할 수 있는 이상적인 플랫폼이다.
- Prometheus와 연계한 정밀 메트릭 수집 전략은 문제 진단과 용량 계획, SLA 준수 여부 판단에 있어 결정적이다.
- WASM 기반 필터 시스템은 속성(Attribute) → 디멘션(Dimension) → 메트릭(Metric)으로 이어지는 구조적 확장성을 제공한다.
- 궁극적으로 이는 서비스 호출의 흐름과 의미를 관측하는 방향으로의 진화를 의미하며, 복잡한 분산 시스템에서 필수적인 조건이라 할 수 있다.
다음 장에서는 이렇게 수집한 메트릭을 Grafana, Kiali 등 시각화 도구를 통해 효과적으로 표현하는 방법을 살펴보겠습니다.