lmplot
sns.set_style('darkgrid')
sns.lmplot(x='total_bill', y='tip', data=tips, height=7)
plt.show()
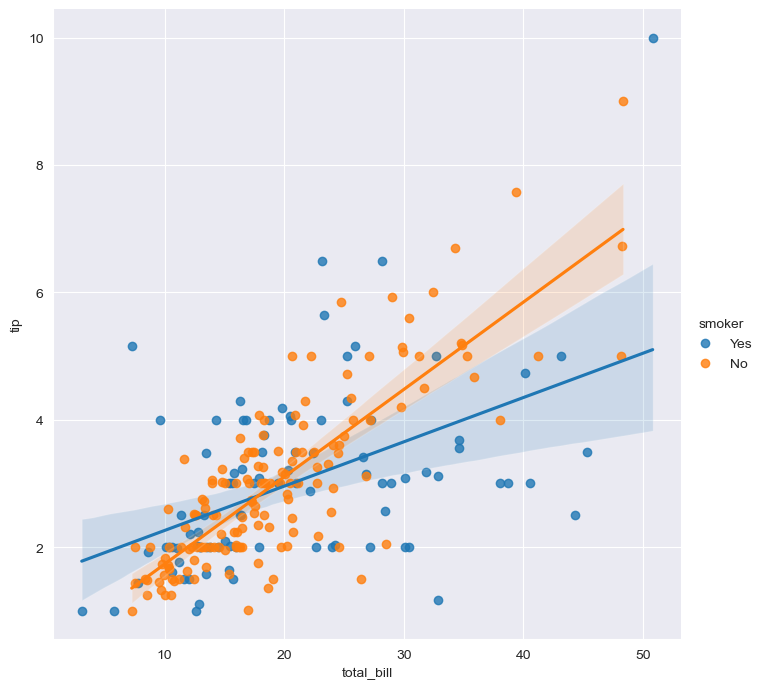
sns.set_style('darkgrid')
sns.lmplot(x='total_bill', y='tip', data=tips, height=7, hue='smoker')
seaborn 예제3: flights data
flights = sns.load_dataset('flights')
flights = flights.pivot(index='month', columns='year', values='passengers')
heatmap
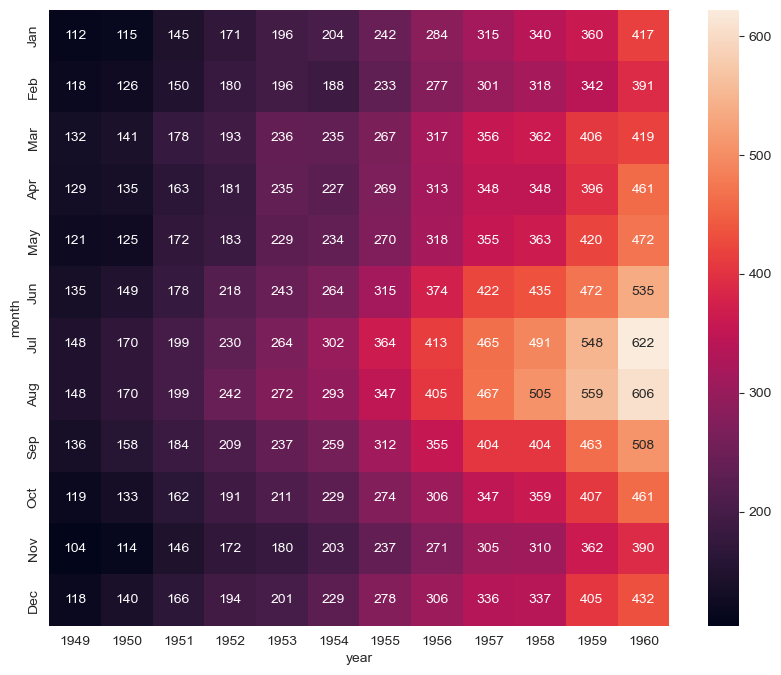
# heatmap

plt.figure(figsize=(10, 8))
sns.heatmap(data=flights, annot=True, fmt='d')  # annot=True 데이터 값 표시, fmt='d' 정수형 표현
plt.show()
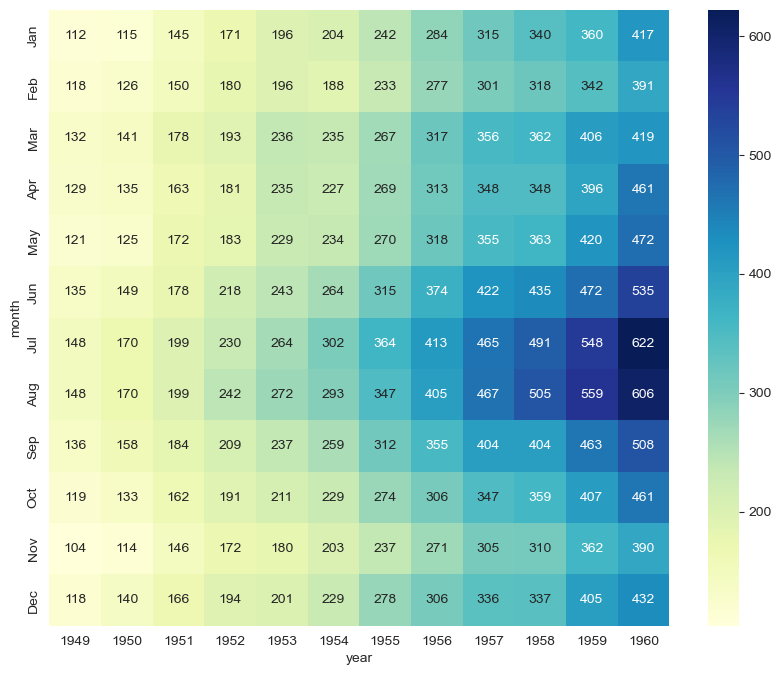
plt.figure(figsize=(10, 8))
sns.heatmap(flights, annot=True, fmt='d', cmap='YlGnBu')
plt.show()
seaborn 예제4: iris data
iris = sns.load_dataset('iris')
pairplot
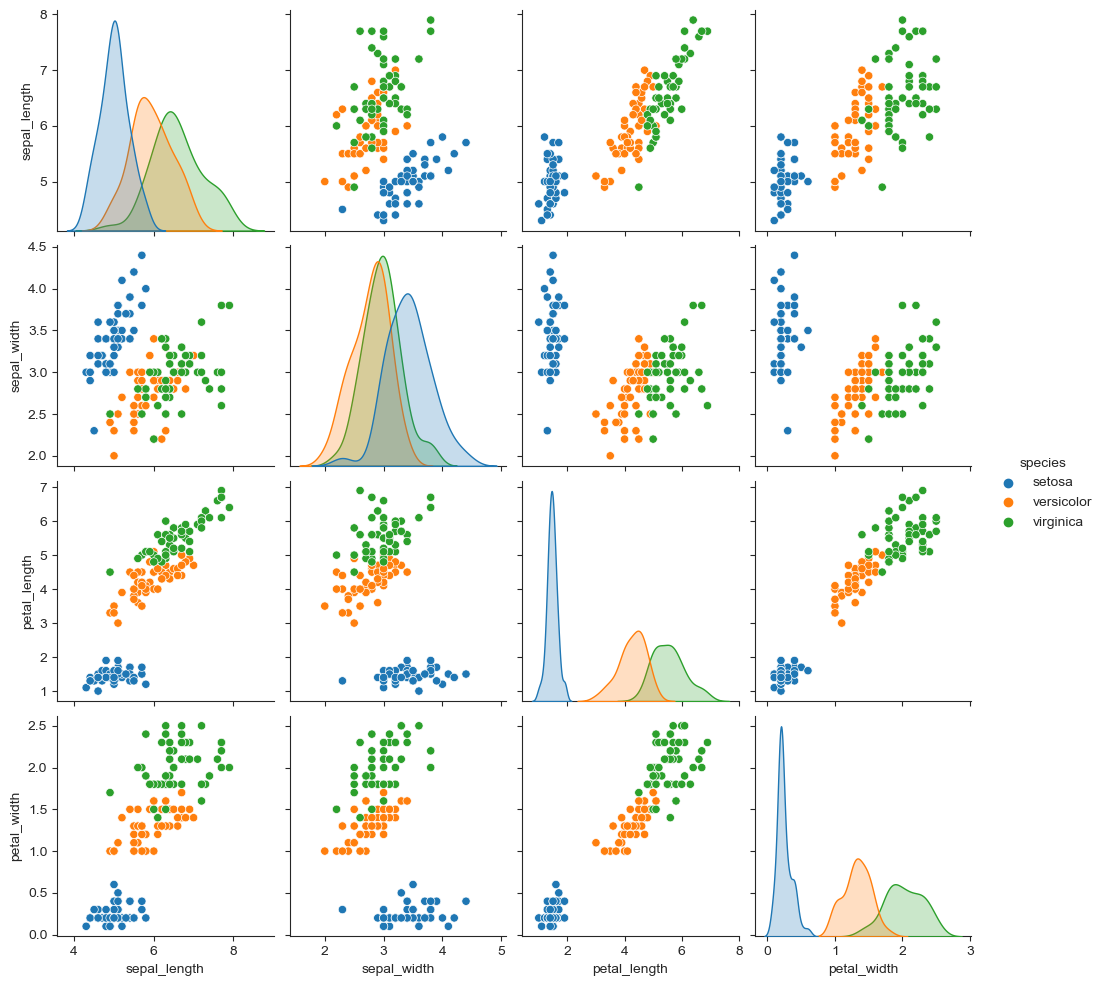
# pairplot

sns.set_style('ticks')
sns.pairplot(iris, hue='species')
sns.pairplot(iris,
x_vars=['sepal_width', 'sepal_length'],
y_vars=['petal_width', 'petal_length'])
plt.show()
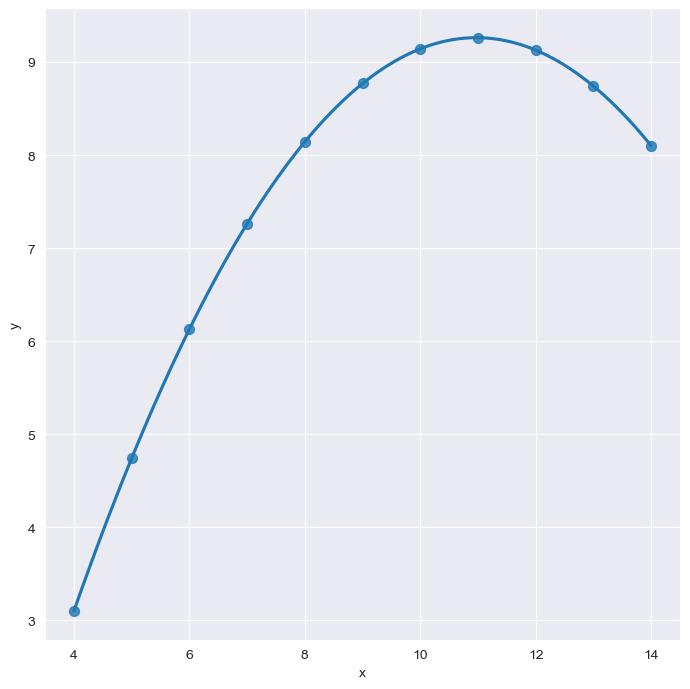
seaborn 예제5: anscombe data
anscombe = sns.load_dataset('anscombe')
sns.set_style('darkgrid')
sns.lmplot(x='x',
           y='y',
           data=anscombe.query("dataset == 'II'"),
           order=2,
           ci=None,
           height=7,
           scatter_kws={'s': 50})
plt.show()
sns.set_style('darkgrid')
sns.lmplot(x='x',
           y='y',
           data=anscombe.query("dataset == 'III'"),
           robust=True,
           ci=None,
           height=7,
           scatter_kws={'s': 50})
plt.show()
📌 서울시 범죄현황 데이터 시각화
import matplotlib.pyplot as plt
import seaborn as sns
from matplotlib import rc

plt.rcParams['axes.unicode_minus'] = False
get_ipython().run_line_magic('matplotlib', 'inline')
rc('font', family='Arial Unicode MS')
def drawGraph():
sns.pairplot(
data=crime_anal_norm,
x_vars=['인구수', 'CCTV'],
y_vars=['살인', '강도'],
kind='reg',
height=4)
plt.show()
drawGraph()