🔎 seaborn을 이용해 특정 페이지의 태그를 스크래핑 한 후 빈도 수를 막대 그래프(Bar Plot)으로 시각화해 보자
- 왜 빈도 수를 스크래핑 하여 시각화하는가?
- 해당 사이트는 다양한 질문들이 올라오는 사이트이다.
- 어떤 주제의 질문이 많이 올라오는지를 알기 위해
빈도 수를 측정해 한눈에 보기 쉬운그래프로 시각화한다.
1. 스크래핑 할 웹 페이지 요소 분석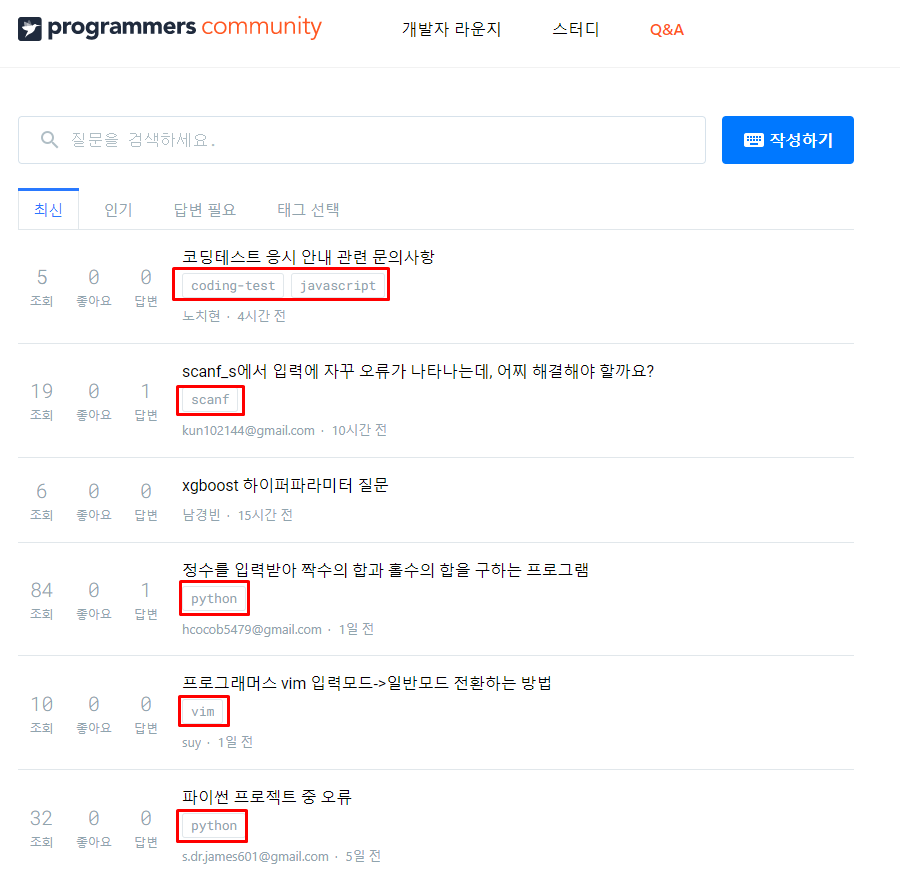
- 우리는 이 웹 페이지에서
주제 태그를 추출해야 한다. - 그리고
주제들이 각각 몇 번이나 세어 그래프로 시각화해 주어야 한다. - 그러기 위해서 저 태그 부분을 우 클릭 후
검사를 눌러 위치를 확인해 준다.

- 구조를 보면
class name이question-tags인ul태그 내부에li태그 안에 우리가 추출하여야 할태그명이 존재한다는 것을 알 수 있다. - 그렇다면
class name이question-tags인ul태그를 모두 찾은 후li태그 요소흫 모두 찾고 그 안에 있는 값의context를 구하면 된다.
2. 찾아야 할 요소 스크래핑
스크래핑을 하기 위한 라이브러리를 호출해 준다.- 해당 페이지는
정적인 페이지이기 때문에requests라이브러리를 사용해 응답을 받고Beautiful Soup라이브러리를 사용해HTML파싱을 해 준다. - 또한 해당 페이지는
페이지네이션이 존재하는 페이지라 10 페이지까지만get함수를 통해 태그를 받도록 한다.
user_agent = {"User-Agent": "Mozilla/5.0 (Macintosh; Intel Mac OS X 10_15_4) AppleWebKit/537.36 (KHTML, like Gecko) Chrome/83.0.4103.97 Safari/537.36"}

from bs4 import BeautifulSoup
import requests

for i in range(1, 11):
    res = requests.get("https://qna.programmers.co.kr/?page={}".format(i), user_agent)  #페이지네이션 적용
    soup = BeautifulSoup(res.text, "html.parser")

    ul_tags = soup.find_all("ul", "question-tags")
    for ul in ul_tags:
        li_tags = ul.find_all("li")
        for li in li_tags:
print(li.text.strip()) #빈칸이 많다. strip()으로 처리.- 이때 다음과 같은
output을 볼 수 있다. (10 페이지까지의 태그가 모두 나오므로 더 많은 데이터들이 있지만 결과 값이 이렇다는 것만 알아두자.)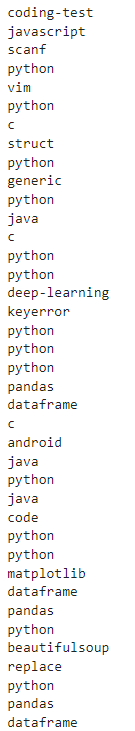
3. 시각화를 위한 추출한 요소 가공
- 질문의 빈도를 체크하기 위해서는 저 태그들이 각각 몇 번씩 리스트에 들어가는지 알 수 있어야 한다.
- 저 리스트를 먼저
counter형식의dictionary로 만들어 주어야 한다.key값은태그 내용,value값은언급된 횟수가 된다. - 그 이후 그래프에 표출할 상위 10 개를 추출해 주기 위해
collections라이브러리의Counter함수 중 하나인.most_common(표출해 줄 수)를 사용해야 한다.
import time
frequency = {} #개수를 세서 dictionary로 만들겠다.

from bs4 import BeautifulSoup
import requests
from collections import Counter

for i in range(1, 11):
    res = requests.get("https://qna.programmers.co.kr/?page={}".format(i), user_agent)  #페이지네이션 적용
    soup = BeautifulSoup(res.text, "html.parser")

    ul_tags = soup.find_all("ul", "question-tags")
    for ul in ul_tags:
        li_tags = ul.find_all("li")
        for li in li_tags:
            tag = li.text.strip() #아까와 다르게 print를 따로 해 주지 않고 dictionary에 쌓는다.
            if tag not in frequency: #tag가 존재하지 않으면 새로운 key로 만들어 주고
                frequency[tag] = 1
            else: #tag가 존재한다면 value인 count만 1회 올려 준다
                frequency[tag] += 1
    time.sleep(0.5) # 부하를 줄여 주기 위해 0.5의 임의의 시간을 둔다.

counter = Counter(frequency) #most_common 기능을 쓰기 위해 Counter로 바꿔 준다.
counter.most_common(10) #counter에서 제일 많은 수를 추출해 줌 상위 10 개
# output
[('python', 233),
('java', 44),
('c', 43),
('pandas', 21),
('c++', 21),
('javascript', 17),
('html', 13),
('dataframe', 10),
('python3', 9),
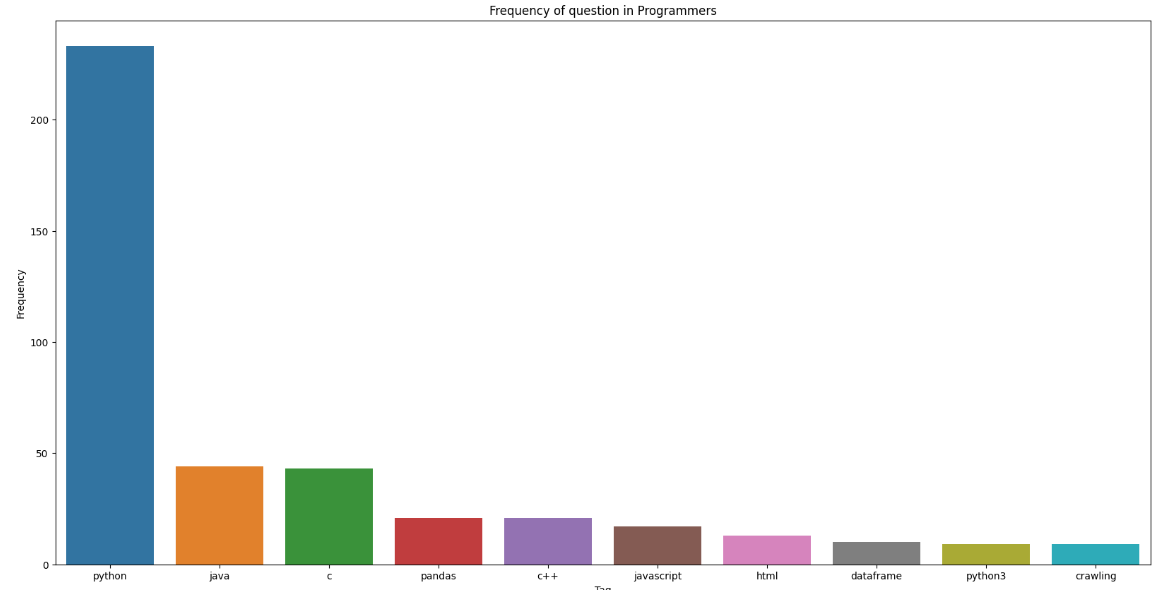
('crawling', 9)]4. 추출한 태그의 빈도 수를 상위 10개 막대 그래프로 시각화
dictionary를counter형식으로 바꾸면list안의tuple첫 번째 값이key, 두 번째 값이value가 된다는 것을output을 통해 알 수 있었다.- 이때
key는태그 이름이기 때문에 막대 그래프의x축 값이 되고value는빈도 수이기 때문에 막대 그래프의y축 값이 된다. - 이걸 통해
seaborn의.barplot(x=x 축 값, y=y 축 값)함수를 이용하여 시각화한다.
import seaborn as sns
import matplotlib.pyplot as plt

plt.figure(figsize = (20, 10))

plt.title("Frequency of question in Programmers")
plt.xlabel("Tag")
plt.ylabel("Frequency")
x = [element[0] for element in counter.most_common(10)]
y = [element[1] for element in counter.most_common(10)]

sns.barplot(x=x, y=y)
결과 값

송의 개발 LOG