🔎 seaborn을 이용해 기상청 날씨 정보 중 기온을 스크래핑 한 후 꺾은 선 그래프(Line Plot)으로 시각화해 보자
1. 스크래핑 할 웹 페이지 요소 분석 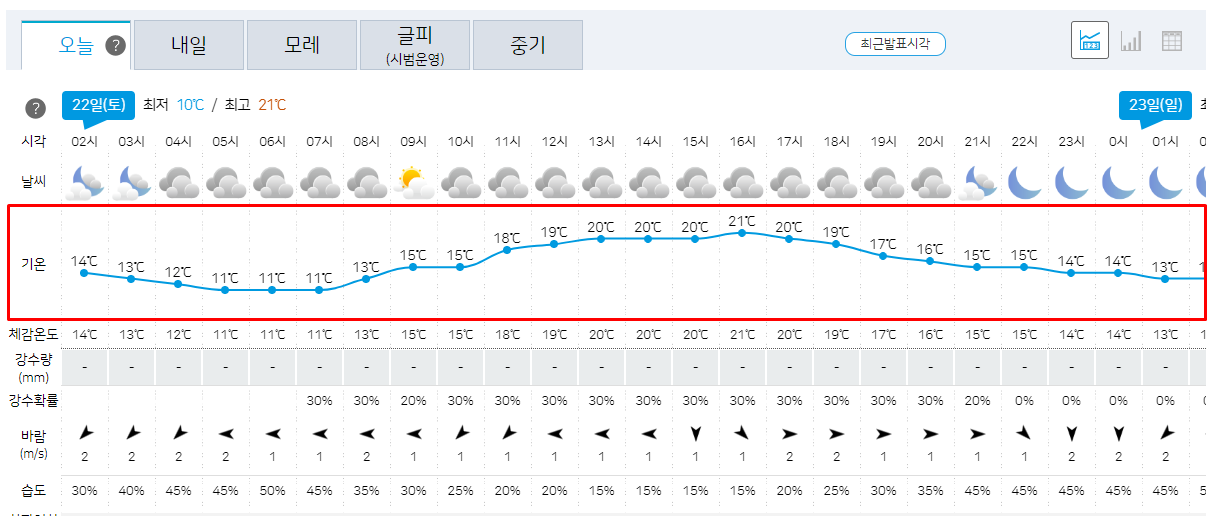
- 우리는 기상청 페이지에서
기온부분의 데이터를스크래핑할 것이기 때문에기온부분을 우 클릭 후검사버튼을 눌러 위치를 확인한다.

id가my-tchart인 저 부분이 우리가 추출해야 하는 그래프의 데이터임을 알 수 있다.- 이 분석 과정을 통해
driver객체에 응답을 담고 이 객체에서id가my-tchart인 부분을 추출해야 한다는 것을 알 수 있다.
2. 찾아야 할 요소 스크래핑
스크래핑을 하기 위한 라이브러리를 호출해야 한다. (이 내용은 3, 4에 더 자세하게 나와 있다.)- 이후 분석한 대로
driver객체를 생성한 후driver객체에 스크래핑 할 웹 페이지에 보낸 응답을 담는다. - 해당 페이지는
동적인 페이지로.implicitly_wait()를 통해 기다림을 주어야 한다. 그렇지 않으면 요소를 찾을 수 없다는 오류가 발생한다. - 응답을 받은 후
.find_element를 통해id가my-tchart인 요소를 찾아 준다.
from selenium import webdriver
from selenium.webdriver import ActionChains
from webdriver_manager.chrome import ChromeDriverManager
from selenium.webdriver.common.actions.action_builder import ActionBuilder
from selenium.webdriver import Keys, ActionChains
from selenium.webdriver.chrome.service import Service
from selenium.webdriver.common.by import By

driver = webdriver.Chrome(service=Service(ChromeDriverManager().install()))
driver.get("https://www.weather.go.kr/w/weather/forecast/short-term.do")
driver.implicitly_wait(10)
temps = driver.find_element(By.ID, "my-tchart").text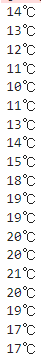
print(temps)- 이때
temps를print해 보면 다음과 같은output을 볼 수 있다.
3. 시각화를 위한 추출한 요소 가공
- 분명
하나의 문자열임에도줄 바꿈이 일어난다는 것은문자열안에개행이 있음을 알 수 있다. 또한 그래프로 표출해 주기 위해서는 단위인℃가 제외되어야 한다. - 마지막으로 그래프의 y축에 들어갈 리스트는
정수(int)타입이어야 한다.
#개행으로 split을 해 주고
#단위를 없애 주고, int로 변환시켜 각각 요소를 리스트에 담는다
temps = [ int(i) for i in temps.replace("℃", "").split("\n")]
#output
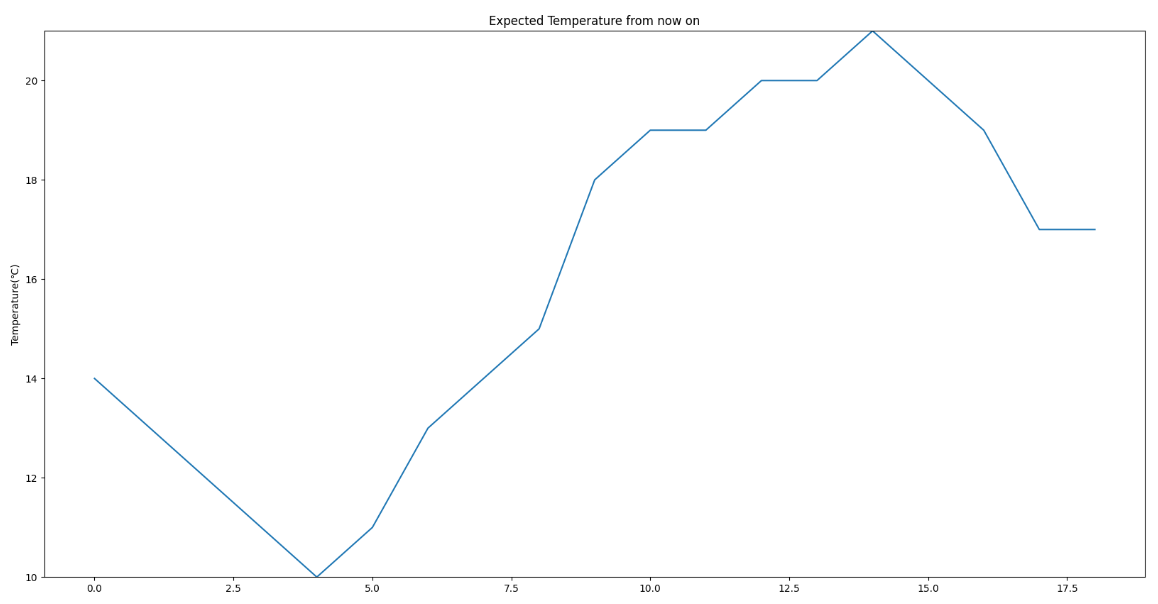
#[14, 13, 12, 11, 10, 11, 13, 14, 15, 18, 19, 19, 20, 20, 21, 20, 19, 17, 17]4. 추출한 기온 정보를 꺾은 선 그래프로 시각화
- 기온 정보를
꺾은 선 그래프로시각화하기 위해seaborn라이브러리를 호출해 준다. - 또한
꺾은 선 그래프를 더 편하게 볼 수 있도록x, y label명,title명,y축의 최솟값과 최댓값 범위,그래프 크기를 설정해 주기 위해matplotlib.pyplot라이브러리 역시 호출해 준다. .lineplot(x=x 값 리스트, y=y 값 리스트)함수를 통해꺾은 선 그래프(Line Plot)을 그려 준다.
import matplotlib.pyplot as plt
import seaborn as sns

plt.figure(figsize = (20, 10))  #그래프 캔버스의 크기는 그래프가 그려지기 전에 먼저 설정해 주어야 한다.
plt.ylim(min(temps), max(temps)) #기온의 최솟값과 최댓값을 y축의 한계점으로 둔다.
plt.title("Expected Temperature from now on")  #title 지정
plt.ylabel("Temperature(℃)")  #y축 이름 지정
sns.lineplot(x=[i for i in range(len(temps))], y=temps) #lineplot을 그려 준다.

plt.show()
결과 값

송의 개발 LOG