plt.figure(figsize=(8, 8)) # 크기
colors = sns.color_palette('YlGnBu_r', len(label)) # 색상
wedgeprops={'width': 0.7, 'edgecolor': 'w', 'linewidth': 2} # 도넛 형태로 생성
# label, ratio
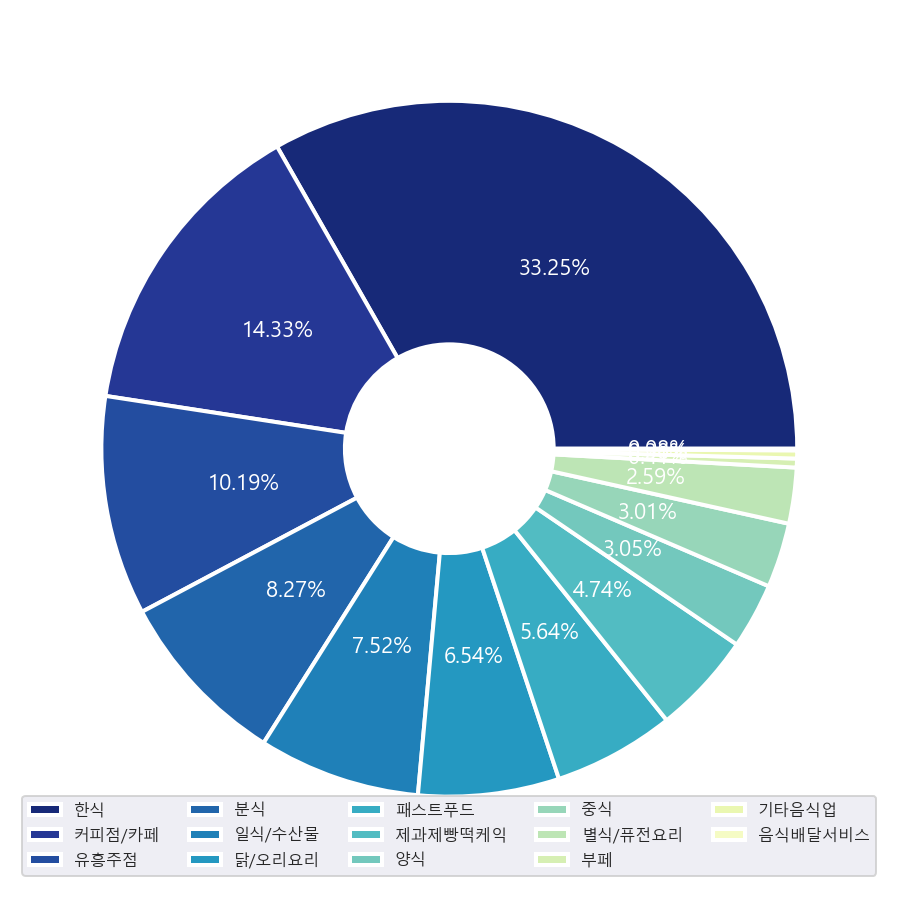
label = food["상권업종중분류명"].value_counts().to_frame('분류 수').index
ratio = food["상권업종중분류명"].value_counts().to_frame('분류 수')['분류 수'].tolist()
# pie
patches, texts, autotexts = plt.pie(ratio, labels = None, wedgeprops=wedgeprops,autopct = '%.2f%%',colors =colors,labeldistance=1.5)
for t in autotexts: # 텍스트 색상 변경
t.set_color("white")
t.set_fontsize(11)
# legend
plt.legend(label, loc="lower left", mode = "expand", ncol = 5,fontsize = 8)
plt.tight_layout()
# save
plt.savefig("piechart2.png", transparent = True) # 배경 투명
plt.show()loc: 범례 위치,mode: 범례 목록을 가로로 확장ncol: 한 row마다 가로로 나열할 범례 수
참고
