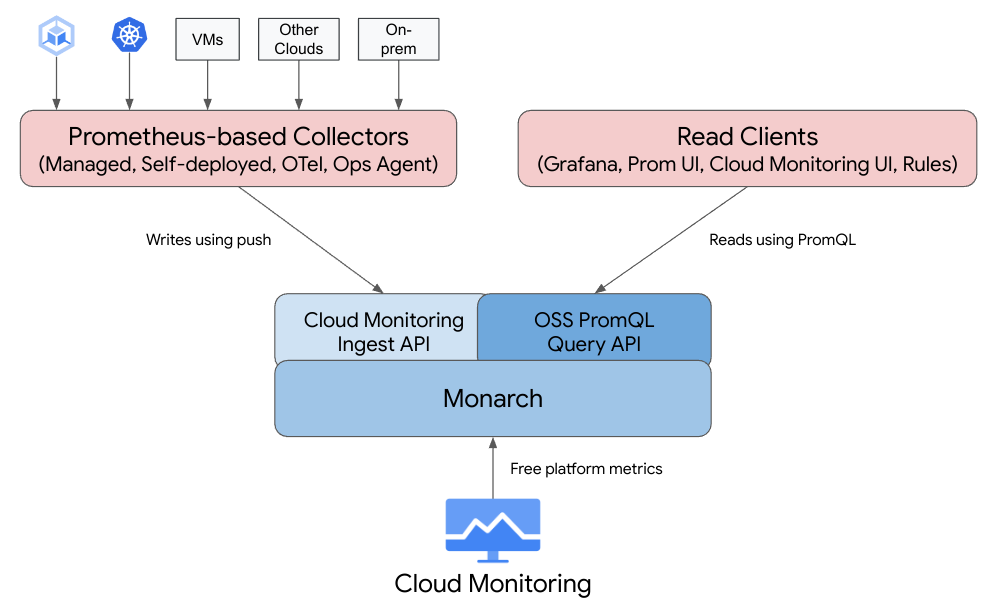
GCE 기반으로 Prometheus 메트릭을 수집하고 모니터링 하는 방법에 대해 알아봅니다.
vm에 ops agent 설정
참고
https://cloud.google.com/monitoring/agent/ops-agent/prometheus
ops agent 최신 설치
curl -sSO https://dl.google.com/cloudagents/add-google-cloud-ops-agent-repo.sh
sudo bash add-google-cloud-ops-agent-repo.sh --also-install
node exporter 설치
wget https://github.com/prometheus/node_exporter/releases/download/v*/node_exporter-*.*-amd64.tar.gz
tar xvfz node_exporter-*.*-amd64.tar.gz
cd node_exporter-*.*-amd64
./node_exporter
아래와 같은 출력이 나오면 정상 설치 된것입니다.
INFO[0000] Starting node_exporter (version=0.16.0, branch=HEAD, revision=d42bd70f4363dced6b77d8fc311ea57b63387e4f)  source="node_exporter.go:82"
INFO[0000] Build context (go=go1.9.6, user=root@a67a9bc13a69, date=20180515-15:53:28)  source="node_exporter.go:83"
INFO[0000] Enabled collectors:                           source="node_exporter.go:90"
INFO[0000]  - boottime                                   source="node_exporter.go:97"
...
INFO[0000] Listening on :9100                            source="node_exporter.go:111"
/metrics endpoint 확인
curl http://localhost:9100/metrics

You should see output like this:
# HELP go_gc_duration_seconds A summary of the GC invocation durations.
# TYPE go_gc_duration_seconds summary
go_gc_duration_seconds{quantile="0"} 3.8996e-05
go_gc_duration_seconds{quantile="0.25"} 4.5926e-05
go_gc_duration_seconds{quantile="0.5"} 5.846e-05
# etc.
Ops Agent config file 설정
sudo vi /etc/google-cloud-ops-agent/config.yaml
아래와 같이 설정해줍니다.
metrics:
  receivers:
    prometheus:
        type: prometheus
        config:
          scrape_configs:
            - job_name: 'node_exporter'
              scrape_interval: 10s
                #metrics_path: /metrics
              static_configs:
                - targets: ['localhost:9100']
  service:
    pipelines:
      prometheus_pipeline:
        receivers:
          - prometheus
cloud monitoring에서 prometheus metrics 수집 확인
gce 에 붙어있는 service account 에 Monitoring Metric Writer(roles/monitoring.metricWriter) 가 부여돼있는지 확인합니다.
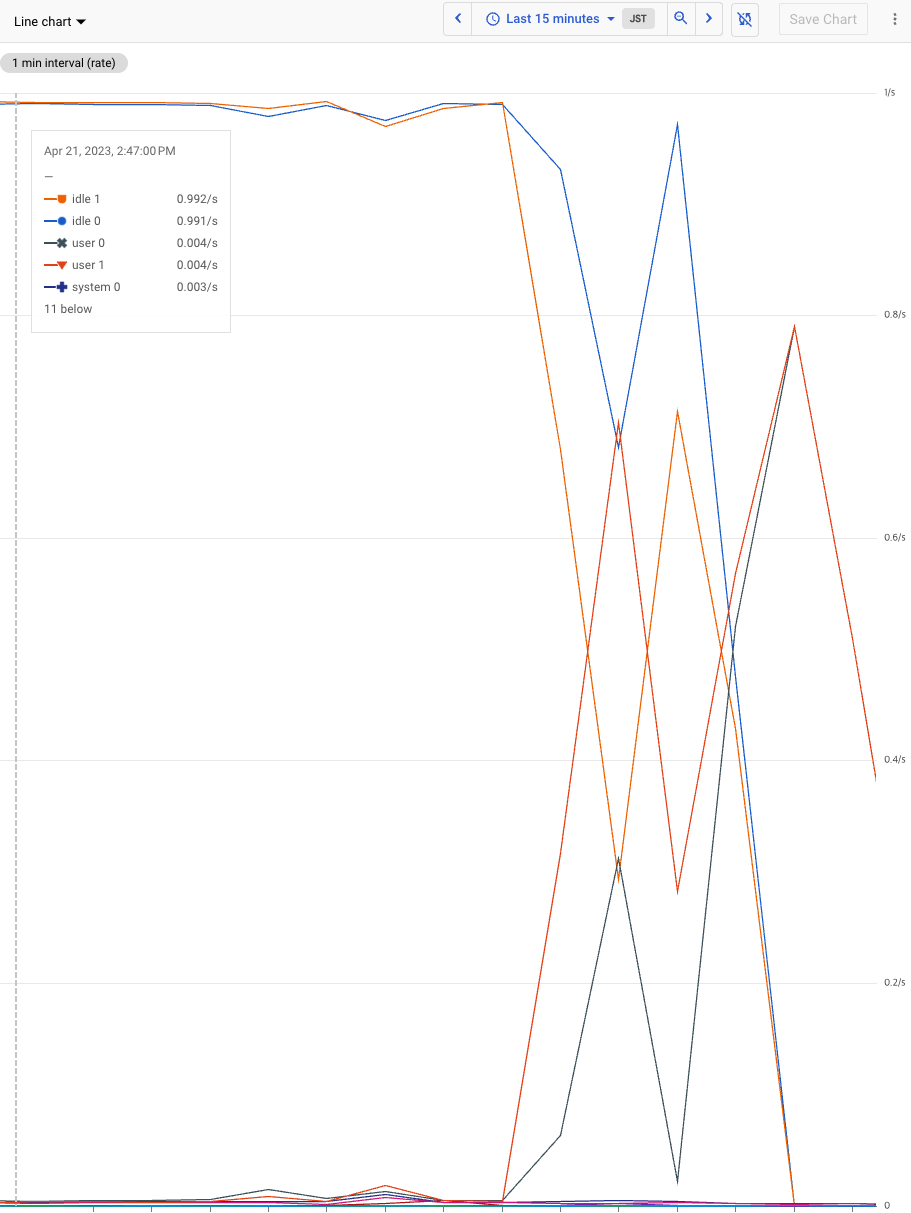
잠시 기다려보면 Prometheus Target 이라는 메트릭과 node 등의 카테고리가 생성됩니다.
prometheus.googleapis.com/ prefix를 가지고 확인할 수 있습니다.

grafana에서 데이터 확인
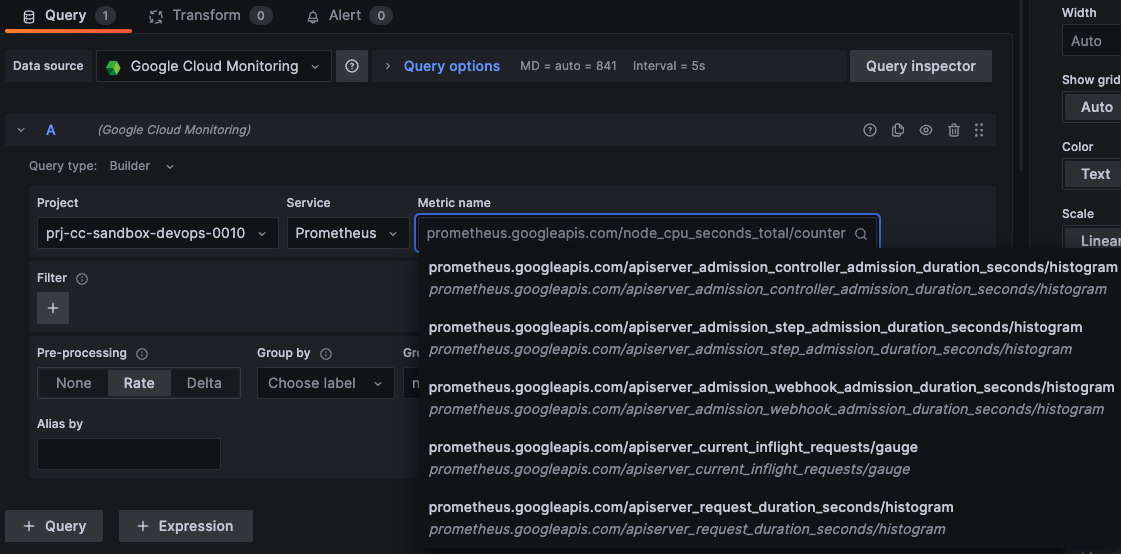
Grafana 설치 및 google cloud monitoring 연동에서처럼 google cloud data source 를 연결하고 dashboard 에서 메트릭을 확인해봅니다.
panel 추가에서 data source는 Google Cloud Monitoring 을 선택하고, project 명, Service(cloud monitoring 에서는 Metric Categories)를 선택하고 원하는 메트릭을 설정합니다.
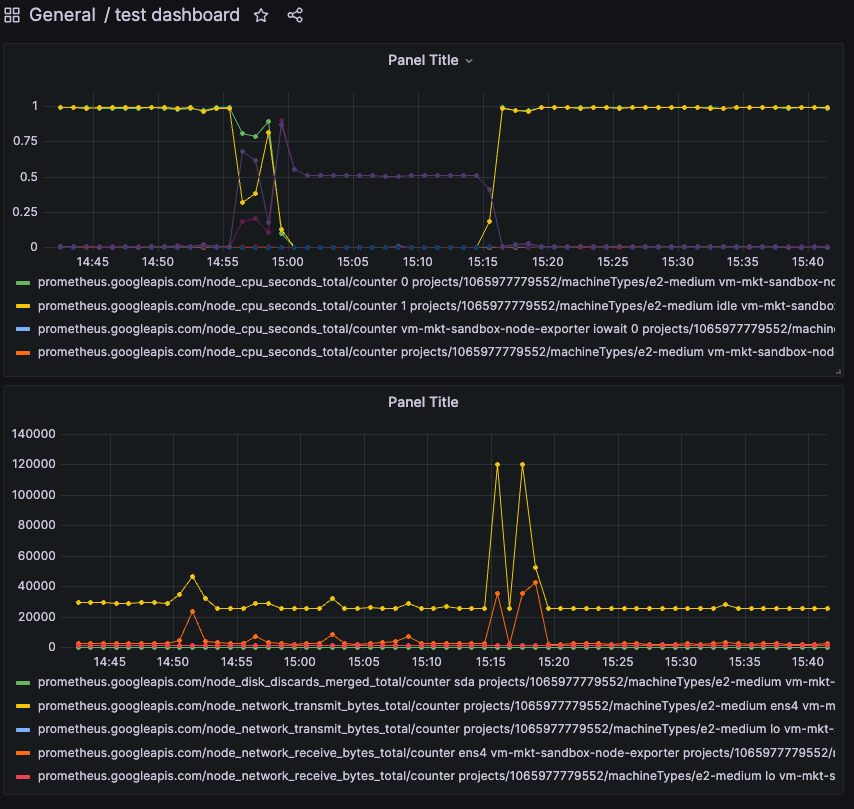
gce > opsagent > cloud monitoring > grafana 까지 전달된 데이터를 확인할 수 있습니다.

I live fullest