모아데이터 기업 과제
- 조회 기간 내의 data 내부를 every메소드르 검사하여 모든 데이터의 값이 0이면
차트를 그려주지 않고 특정 svg를 화면에 구현해주었습니다.
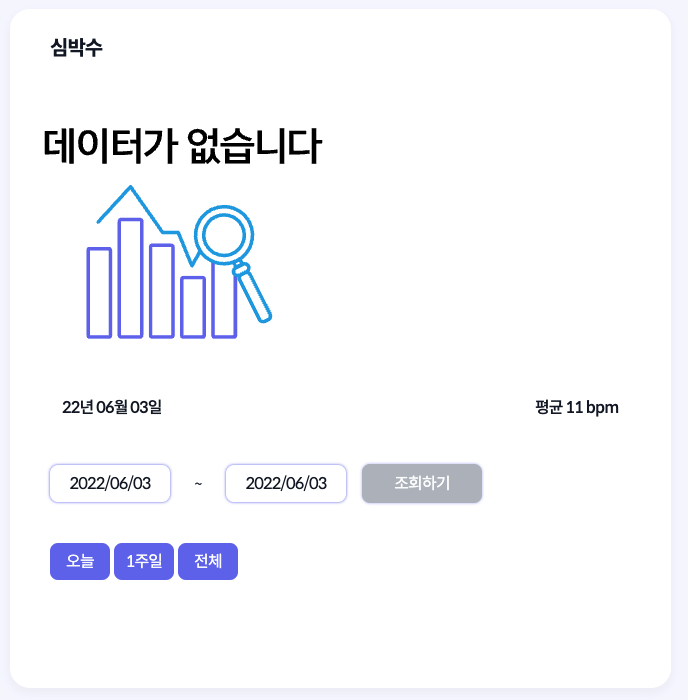
export const hasData = (data: Data[]) => {
  if (!data) return false;
  if (data.every((datum) => datum.y === 0)) {
    return false;
  }
  return true;
};
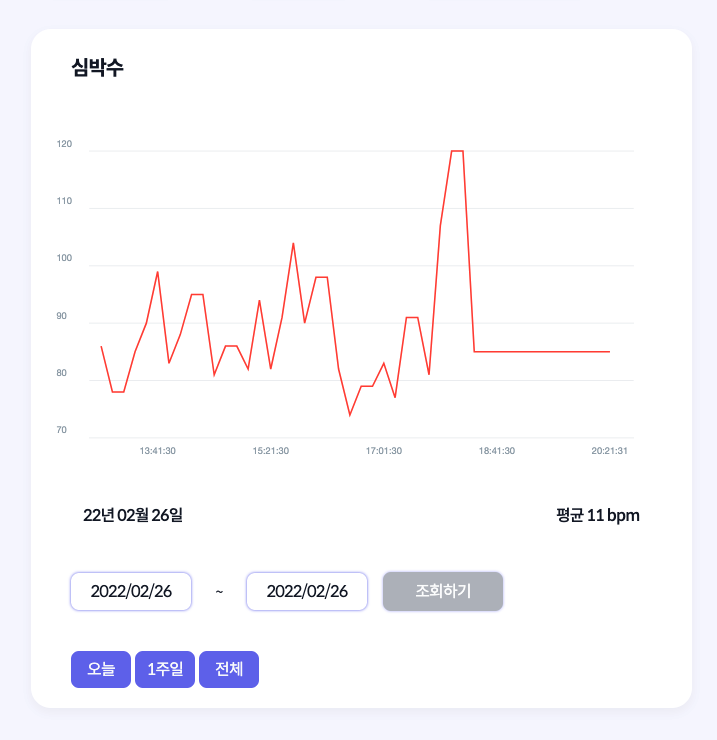
- 오늘 1주일 전체 버튼을 누르면 날짜를 해당하는 날짜로 변경할 수 있도록 해 주었습니다.
export const setToday = () => {
  const now = dayjs();
  const today = now.format('YYYY-MM-DD');
  return today;
};

export const setWeek = (endDate: string) => {
  const startDate = dayjs(endDate).add(-7, 'd').format('YYYY-MM-DD');
  const weekSetting = [startDate, endDate];
  return weekSetting;
};
- 차트에 최종 모습입니다.
카카오맵 react api 관련 이슈
function(){
  const Main = () => {
    const [position, setPosition] = useState()
    return (
      <>
        <Map // 지도를 표시할 Container
          center={{
            // 지도의 중심좌표
            lat: 33.450701,
            lng: 126.570667,
          }}
          style={{
            width: "100%",
            height: "450px",
          }}
          level={3} // 지도의 확대 레벨
          onClick={(_t, mouseEvent) => setPosition({
            lat: mouseEvent.latLng.getLat(),
            lng: mouseEvent.latLng.getLng(),
          })}
        >
          {position && <MapMarker position={position} />}
        </Map>
        {position && <p>{'클릭한 위치의 위도는 ' + position.lat + ' 이고, 경도는 ' + position.lng + ' 입니다'}</p>}
      </>
    )
  }
  return (<Main/>)
}
- 온클릭 부분에서 lat, lng 타입이 옵셔널로 지정되어있어서 해당 부분 깃헙에 이슈로 남겼고
아직 완벽히 타입을 전부 지정하지 않았다고 답변을 받았습니다.
    onClick={(_t, mouseEvent) => {
          if (mouseEvent.latLng) {
            setPosition({
              lat: mouseEvent.latLng.getLat(),
              lng: mouseEvent.latLng.getLng(),
            })
          }
        }}
You only have to right once