-
Family - SibSp(형제 자매) + Parch(부모, 자녀)
-
SibSp와 Parch 합하면 Family
-
Family로 합쳐서 분석
-
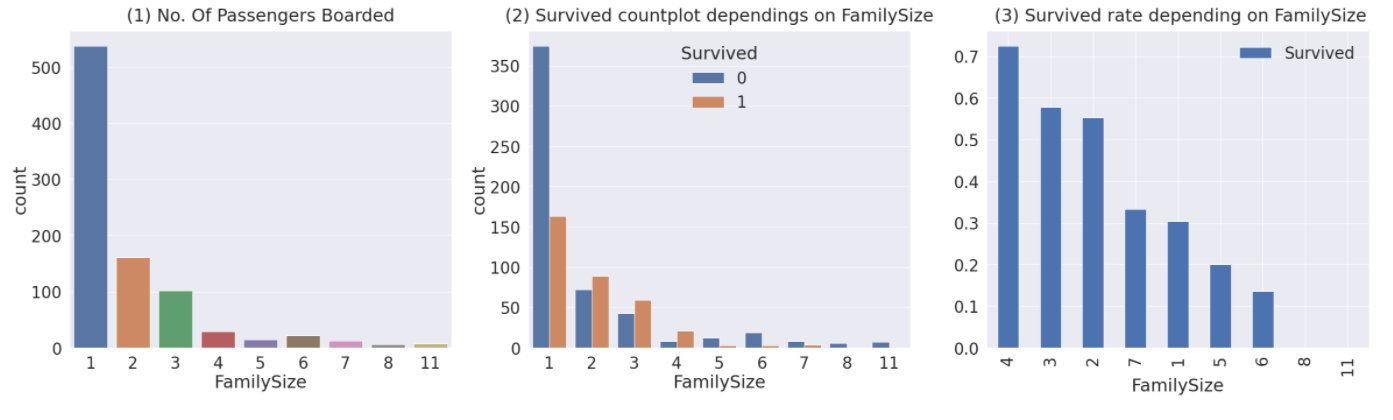
FamilySize와 생존 관계
-
Figure(1): 가족의 크기가 1~11
-
대부분 1명 혹은 2~4명입니다.
-
Figure(2),(3): 가족의 크기에 따른 생존비교
-
가족이 4명인 경우 가장 생존확률이 높다
-
가족 수가 많아질수록 작다
-
즉, 3~4인이 가장 높다
-
-
Fare
-
탑승요금
-
contious feature
-
distribution 매우 비대칭
-
이상치에 대한 과민 반응으로 실체 예측 시 결과는 좋지 않을 것으로 예상됨
-
Fare columns의 log값 취하기
-
python 람다함수 이용(map, log를 편하기 넣기 가능)
-
log를 취한 비대칭성이 많이 사라짐
-
이런 작업을 통해 모델이 좀 더 좋은 성능을 비춤
-
feature engineering작업(모델 성능 향상)
-
-
Cabin
-
NaN이 약 80%
-
생존에 미치는 영향은 미미할 것
-
모델이 포함 안 시킵니다.
-
-
Ticket
-
NaN이 없다
-
string data이므로 어떤 작업을 통헤야 모델 적용 가능
-
아이디어 중요
-
ticket number이 다양하므로 어떤 특징을 뽑아내어 생존과 연결시켜야하는지 고려 필수
-
Family~SibSp(형제 자매) + Parch(부모, 자녀)
df_train['FamilySize'] = df_train['SibSp'] + df_train['Parch'] + 1 #자신을 포함
df_test['FamilySize'] = df_test['SibSp'] + df_test['Parch'] + 1 #자신 포함
print("Maximum size of Family: ", df_train['FamilySize'].max())
print("Minimum size of Family; ", df_train['FamilySize'].min())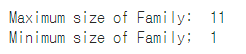
f,ax = plt.subplots(1,3, figsize=(40,10))
sns.countplot('FamilySize', data = df_train, ax=ax[0])
ax[0].set_title('(1) No. Of Passengers Boarded', y= 1.02)

sns.countplot('FamilySize', hue='Survived', data=df_train, ax=ax[1])
ax[1].set_title('(2) Survived countplot dependings on FamilySize', y=1.02)

df_train[['FamilySize', 'Survived']].groupby(['FamilySize'], as_index=True).mean().sort_values(by='Survived', ascending=False).plot.bar(ax=ax[2])
ax[2].set_title(' (3) Survived rate depending on FamilySize', y=1.02)

plt.subplots_adjust(wspace=0.2, hspace=0.5)
plt.show()
Fare
fig, ax = plt.subplots(1, 1, figsize=(8,8))
g = sns.distplot(df_train['Fare'], color='b', label = 'Skewness : {:.2f}'.format(df_train['Fare'].skew()), ax=ax)
g = g.legend(loc='best')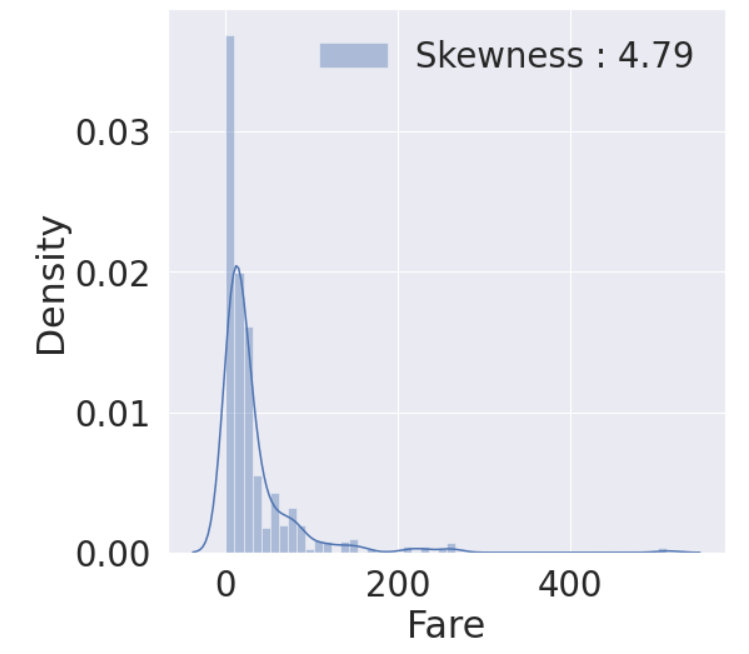
df_test.loc[df_test.Fare.isnull(), 'Fare'] = df_test['Fare'].mean()

df_train['Fare'] = df_train['Fare'].map(lambda i: np.log(i) if i > 0 else 0)
df_test['Fare'] = df_test['Fare'].map(lambda i : np.log(i) if i > 0 else 0)
fig, ax = plt.subplots(1, 1, figsize=(8,8))
g = sns.distplot(df_train['Fare'], color='b', label='Skewness : {:.2f}'.format(df_train['Fare'].skew()), ax=ax)
g = g.legend(loc='best')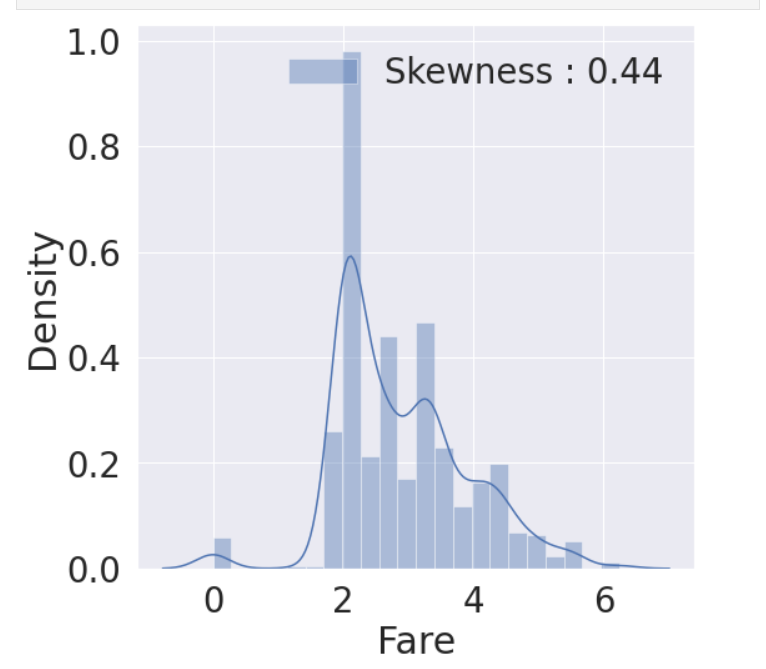
Cabin
df_train.head()
Ticket
df_train['Ticket'].value_counts()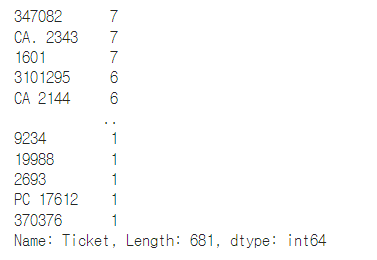

성장을 도울 아카이빙 블로그