Definition of Overfitting
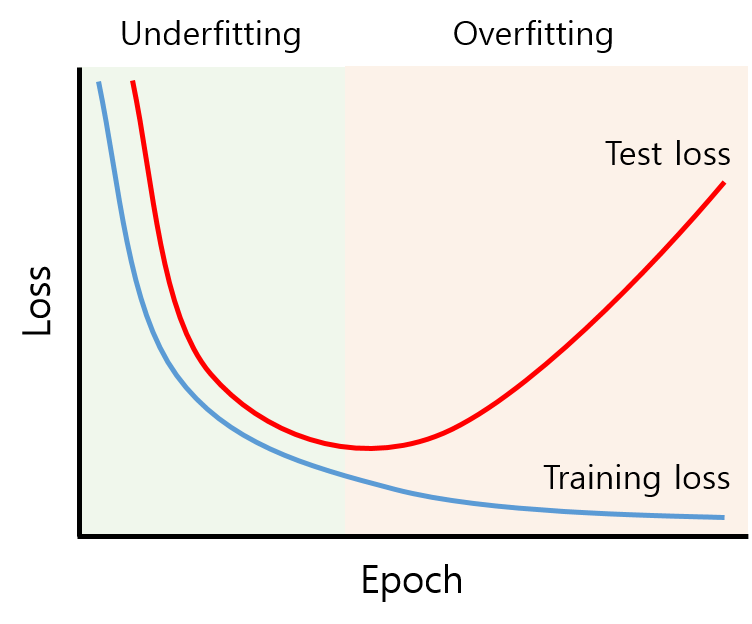
: train set은 잘 맞추나 validation/test set는 그렇지 못한 현상
Regularization
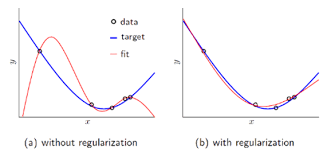
- 정의: train set이 정답을 못 맞추게 하면서 오버피팅을 방해합니다. 그로 인해 train loss는 증가를 하지만 validation/ test loss는 감소가 됩니다.(오버피팅 막음)
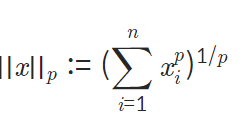
Lp norm
- norm: 벡터, 함수, 행렬의 크기를 구하는 것
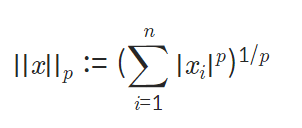
: p의 값에 따라 L1인지 L2인지 결정이 된다.
vector norm
i) p가 자연수일 때
x=np.array([1,10,1,1,1])
p=5
norm_x=np.linalg.norm(x, ord=p)
making_norm = (sum(x**p))**(1/p)
print("result of numpy package norm function : %0.5f "%norm_x)
print("result of making norm : %0.5f "%making_norm)
ii) p가 무한대일 때
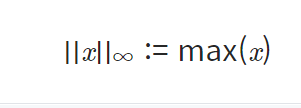
norm_x=np.linalg.norm(x, ord=np.inf)
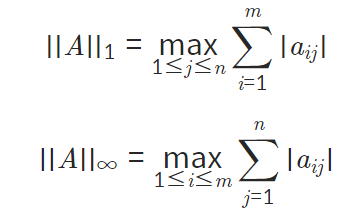
print("result of infinite norm : %0.5f "%norm_x)matrix norm
: p =1 ,p 가 무한대일 경우만 파악하면 된다.
i) p=1, 컬럼의 합이 가장 큰 값 출력
ii) p가 무한대, 로우의 합이 가장 큰 값 출력
: A = m * n 행렬
A=np.array([[1,2,3],[1,2,3],[4,6,8]])
inf_norm_A=np.linalg.norm(A, ord=np.inf)
print("result inf norm of A :", inf_norm_A)
one_norm_A=np.linalg.norm(A, ord=1)
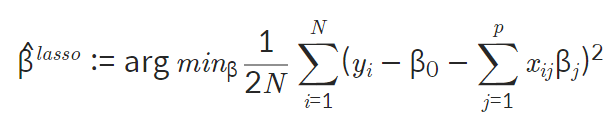
print("result one norm of A :", one_norm_A)L1 Regularization
-
식:
-
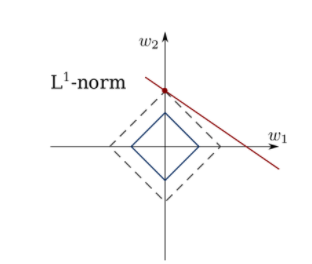
특징:
- 어떤 컬럼이 결과에 영향을 미치는지에 대해서 알 수 있다.- 그로 인해 차원 축소와 같은 효과를 내어 결과 예측이 가능하다.
- 두 개의 하이퍼파라미터가 erro값 영향 미침
- X가 2차원 이상의 여러 컬럼 값이 있는 데이터일 경우 효과 좋음
- X가 1차원이면 의미가 없다.
- 마름모형태 :
-
예시:
*loss 문제
plt.figure(figsize=(5,5))
plt.scatter(X,Y)
plt.plot(X,linear.predict(X.reshape(-1,1)),'-b')
plt.title('petal-sepal scatter with linear regression')
plt.xlabel('petal length (cm)')
plt.ylabel('sepal length (cm)')
plt.grid()
plt.show()
L2 Regularization
- 식:

-
특징:
-
원의 형태 :

-
수렴이 빠름
-> 제곱 텀에서 결과에 큰 영향을 미치면 더 크게 아니면 더 작게 보낸다.
-
*Ridge 문제
#L2 regularization은 Ridge로 import 합니다.
from sklearn.linear_model import Ridge

L2 = Ridge()
L2.fit(X.reshape(-1,1), Y)
a, b = L2.coef_, L2.intercept_
print("기울기 : %0.2f, 절편 : %0.2f" %(a,b))

plt.figure(figsize=(5,5))
plt.scatter(X,Y)
plt.plot(X,L2.predict(X.reshape(-1,1)),'-b')
plt.title('petal-sepal scatter with L2 regularization(Ridge)')
plt.xlabel('petal length (cm)')
plt.ylabel('sepal length (cm)')
plt.grid()
plt.show()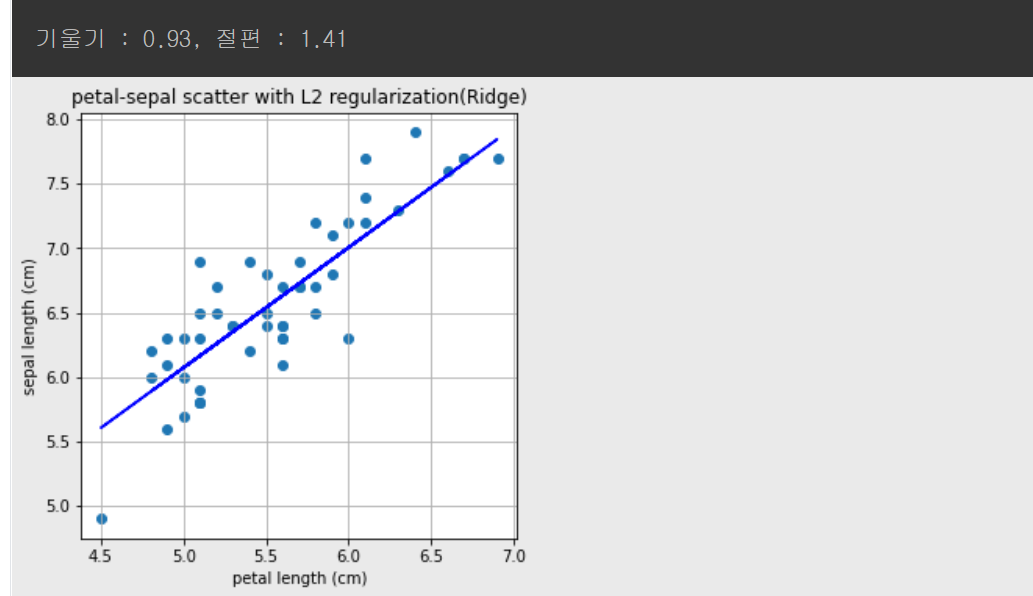
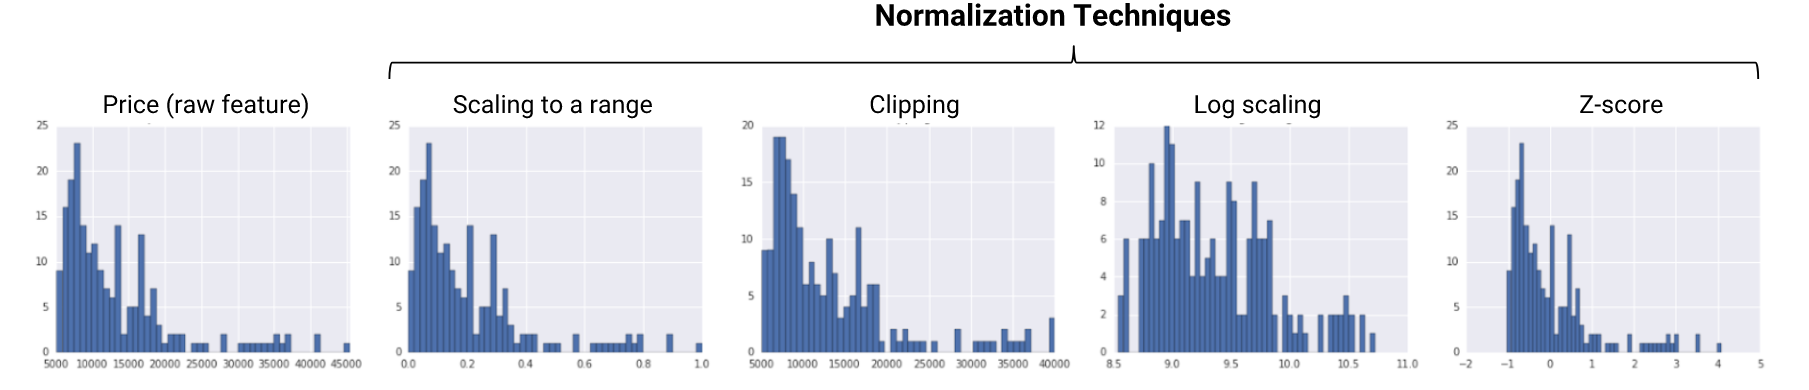
Normalization

- 정의: train에 적합하게 데이터 전처리하는 과정.(서로 다른 범위의 데이터를 같은 범위로 바꿔준다)
-
예시: z-score 혹은 minmax scaler을 사용하여 0과 1 사이의 값우로 분포 조정
-
효과: 데이터 값의 분포로 인해서 거리 왜곡이 생겨서 학습에 방해되는 문제 해결
Batch Normalization
-
특징:
- 정확도 향상 및 속도 증가
- loss함수의 감소빨라짐.
- 정규화가 되어 고른 분포를 가짐
- ϵ--> gradient vanishing , explode 문제 해결-> 안정적인 학습도 가능
Dropout
-
정의: 확률적으로 랜덤하게 선택한 후 정보 전달
-
특징:
- 오버피팅을 막는 Regularization layer 중 하나.
- fully connected layer에서 오버피팅 나타날 시 추가
-
코드 구현
tf.keras.layers.Dropout(rate, noise_shape=None, seed=None, **kwargs)
>>> tf.random.set_seed(0)
>>> layer = tf.keras.layers.Dropout(.2, input_shape=(2,))
>>> data = np.arange(10).reshape(5, 2).astype(np.float32)
>>> print(data)
[[0. 1.]
 [2. 3.]
 [4. 5.]
 [6. 7.]
 [8. 9.]]
>>> outputs = layer(data, training=True)
>>> print(outputs)
tf.Tensor(
[[ 0.    1.25]
 [ 2.5   3.75]
 [ 5.    6.25]
 [ 7.5   8.75]
 [10.    0.  ]], shape=(5, 2), dtype=float32)
성장을 도울 아카이빙 블로그