Linear classification (2): non-linear data
선형적으로 분포하고 있는 데이터를 선형분류기로 예측할 수 있는 것을 이전 글에서 확인했다. 그렇다면 비선형적으로 분포하는 데이터를 선형분류기로 나눌 수 없을까? 이번 글에서는 비선형 데이터를 선형분류기로 다뤄보자.
In previous page, we observe that the linear classifier can predict the labels of the linearly distributed data. Then, can the linear classifier predict the labels of non-linearly data? In this page, we use the linear classifier with non-linear data.
Non-linear data
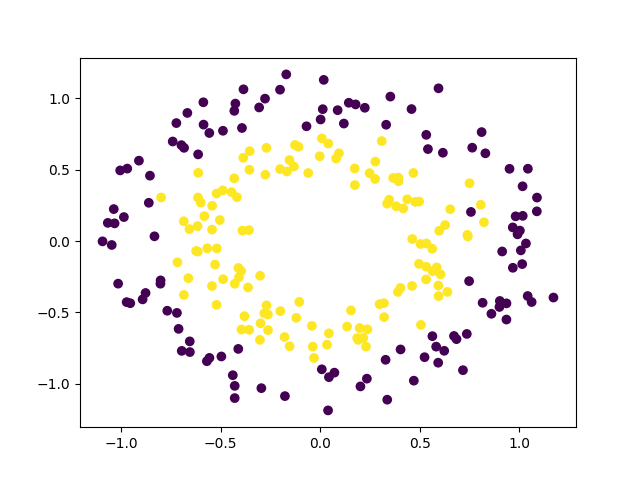
아래 그림과 같이 가로축에 대해 세로축이 비선형적으로 변하는 데이터가 있다. 이와 같은 경우 선형 분류기로 분류가 가능한지 알아보고, 가능하다면 어떻게 할 수 있을까?
We have data where the vertical axis varies nonlinearly with respect to the horizontal axis, as shown in the figure below. In this case, is it possible to classify it with a linear classifier, and if so, how?
Preprocessing
위 그림과 같은 비선형 데이터는 직선 하나로 분류 할 수 없다. 즉 원본 데이터를 그대로 선형 분류기에 넣으면 분류를 정확하게 할 수 없다. 하지만 데이터를 전처리하면 선형 분류기로도 분류가 가능하다.
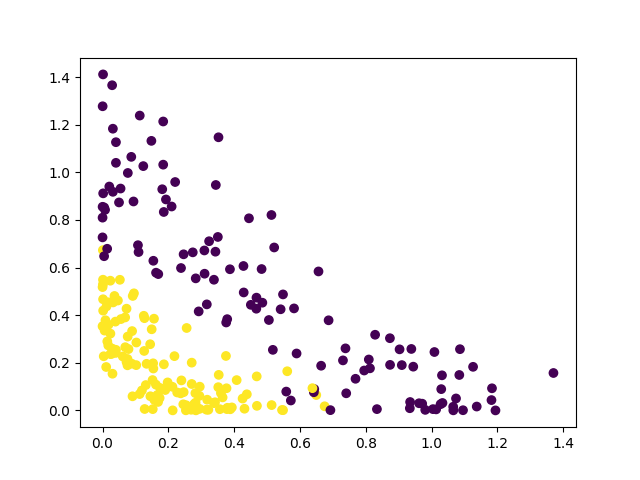
아래 그림은 좌표에 대해 제곱을 하여 나타낸 그림이다. 제곱을 함으로써 두 라벨을 분류할 수 있는 경계가 생긴 것을 볼 수 있다.
Non-linear data, like the image above, cannot be classified by a straight line, which means that if you put the raw data into a linear classifier, it will not be able to classify it correctly. However, if you preprocess the data, you can classify it with a linear classifier.
The figure below shows the squared coordinates. You can see that squaring the coordinates creates a boundary between the two labels.
Train & Test
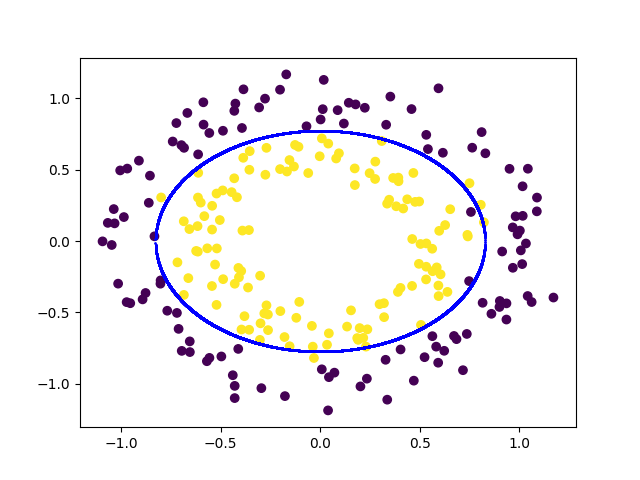
데이터 전처리 후 학습된 파라미터로 분류한 결과를 살펴보자.
Let's take a look at the results of preprocessing the data and classifying it with the learned parameters.
-
Train data
-
Test data
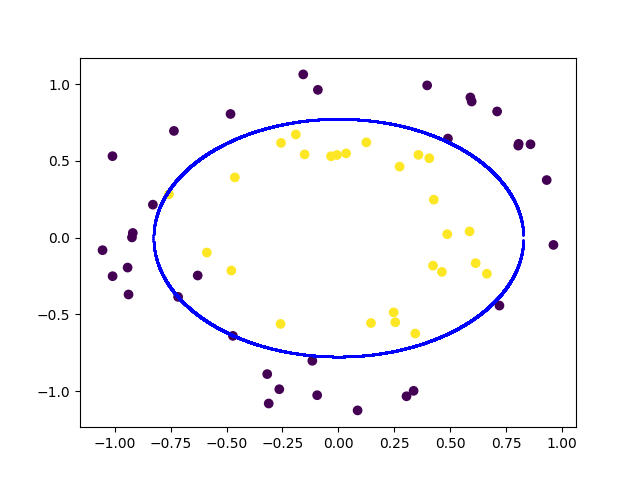
전처리한 데이터로 학습 시켰을 때 학습데이터와 테스트데이터 모두 높은 정확도의 분류 성능을 갖는 것을 볼 수 있다. 이처럼 데이터를 어떻게 처리하는지에 따라 결과가 달라 질 수 있기 떄문에 데이터 전처리도 굉장히 중요한 파트임을 알 수 있다.
