Ch.3
Information System Project
- Analysis
📌 Tools of System Analysis
1️⃣ Leveling down
2️⃣ Context Diagram
-
Context Diagram
: A graphical representation process of capture, manipulate, store, distribute data between a system and its components.What unique rules apply to drawing context diagrams?
💬 Data Store can only exist in DFD but not Context Diagram.
-
DFD ( Data-flow Diagram )
: Graphically represents movements of data between a system and its components.Why do systems analysts use data flow diagrams?
💬 Systems Analyst uses the DFD to study and analyze
the internal communication and process of business.
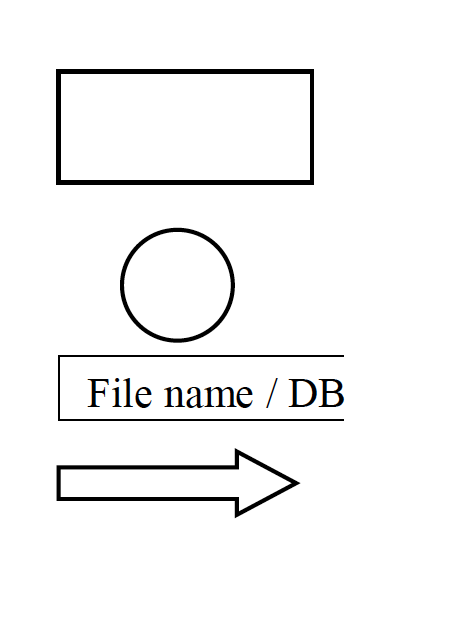
🔻 External Entity
: Represent the origin and/or destination of the data.🔻 Process (Transformation)
: Represent work or action performed on data.🔻 Data Store
: Represent data at rest.🔻 Data Flow
: Represent data in movement as a unit from one place to another.
Drawn as an arrow.
Select a meaningful name to represent the data.
-
Level-0 Diagram
: A DFD that represents major processes, data flows, data stores at a high level of detail. -
Balancing DFD
: A DFD that represents conservation of input and output when a process is decomposed to lower level.
BPR ( Business Process Reengineering )
: Reorganize data flow in major sections to eliminate unnecessary steps and identify activities that can be improved.
A decision table
: A graphical representation entities in table format that consists of intersection points of the conditional cases.
Decision tables are best suited for business rules that have multiple conditions.