import pandas as pd
import numpy as np
import matplotlib.pyplot as plt
import seaborn as sns

import tensorflow as tf
import keras
from keras.models import Sequential
from keras.layers import Dense
from tensorflow.keras.optimizers import RMSprop

import warnings
warnings.filterwarnings('ignore')
^ 라이브러리
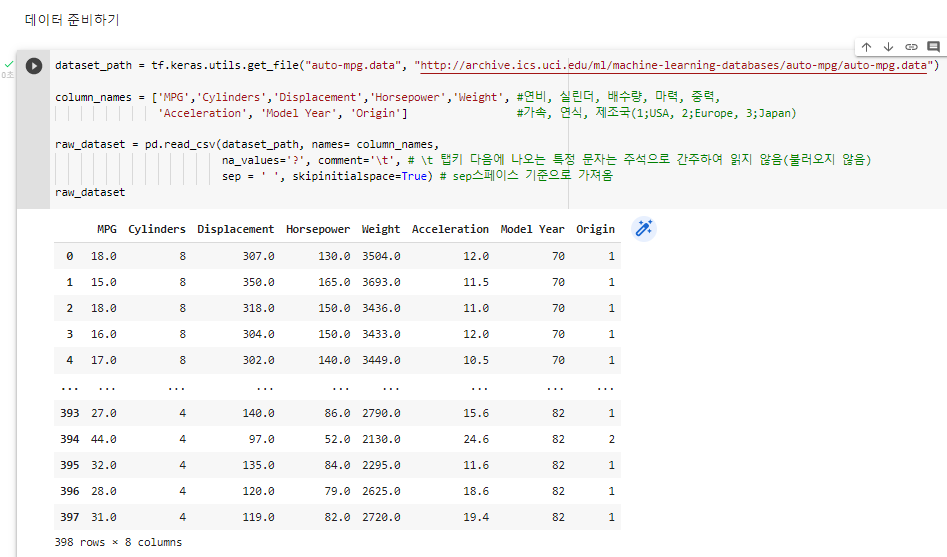
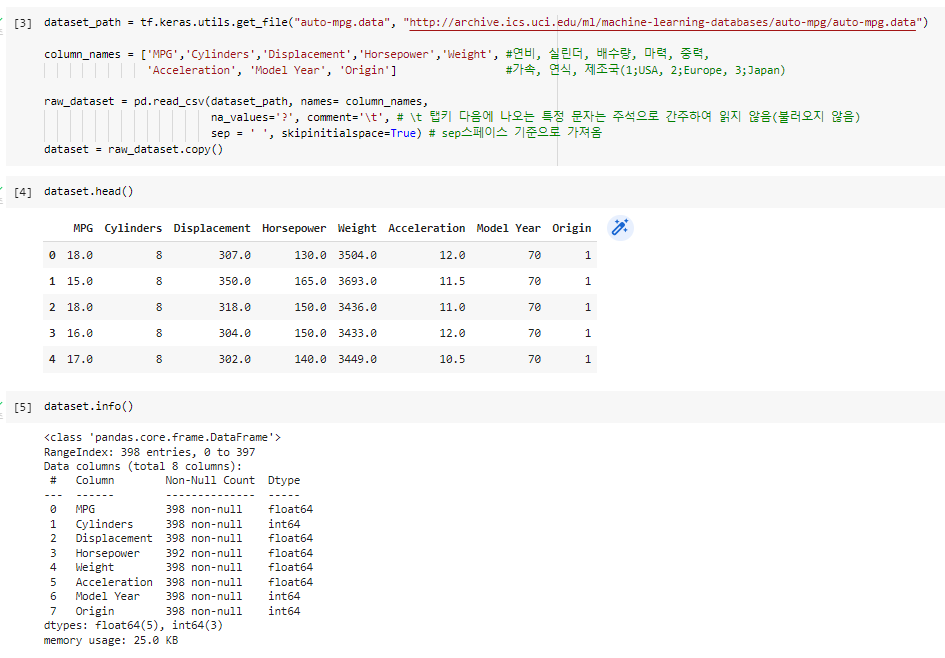
^ 데이터 준비하기
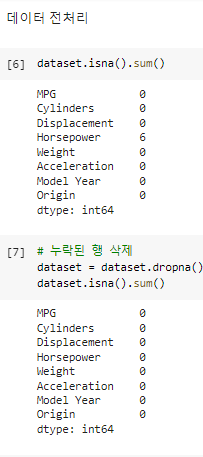
^ 데이터 전처리통해 누락된 행 삭제
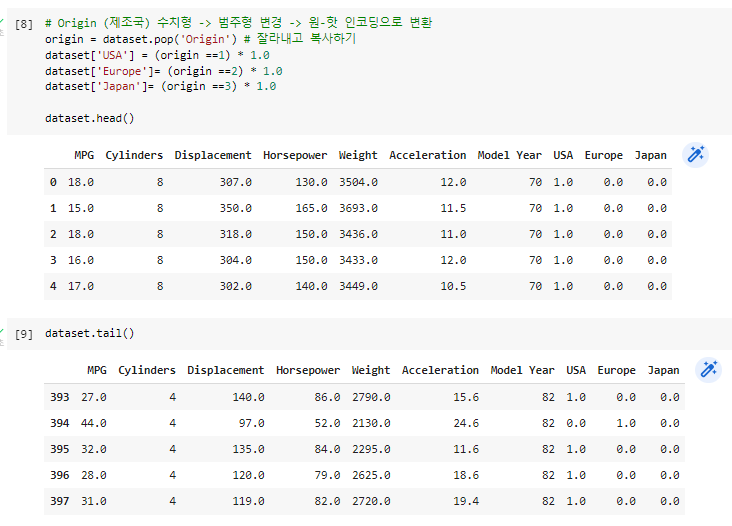
^ 원-핫 인코딩 변환
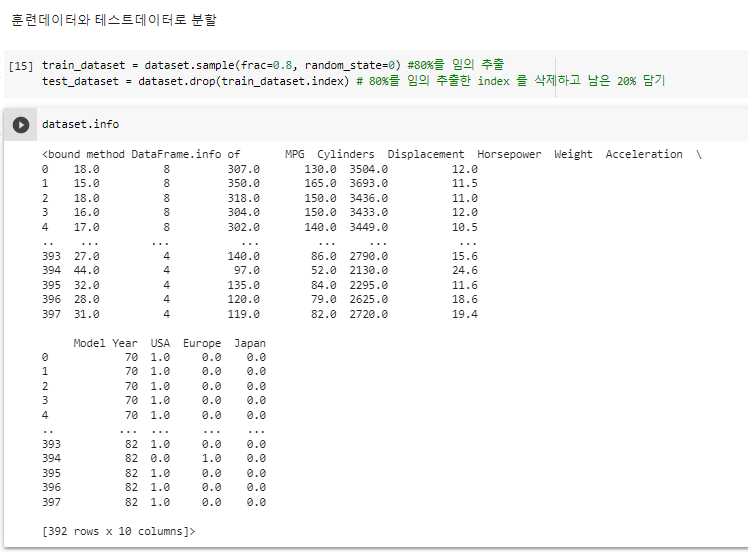
^ 훈련데이터와 테스트데이터 분할
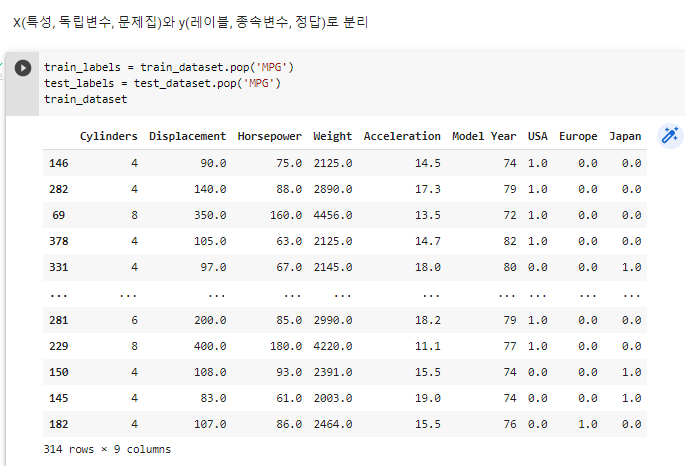
^ X와 y 로 분리
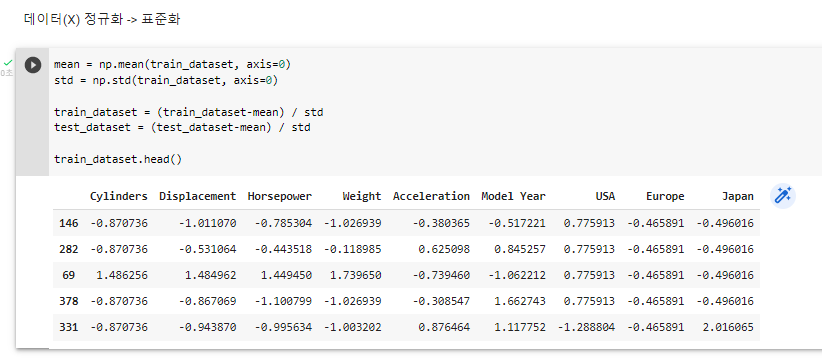
^ 데이터 정규화 표준화
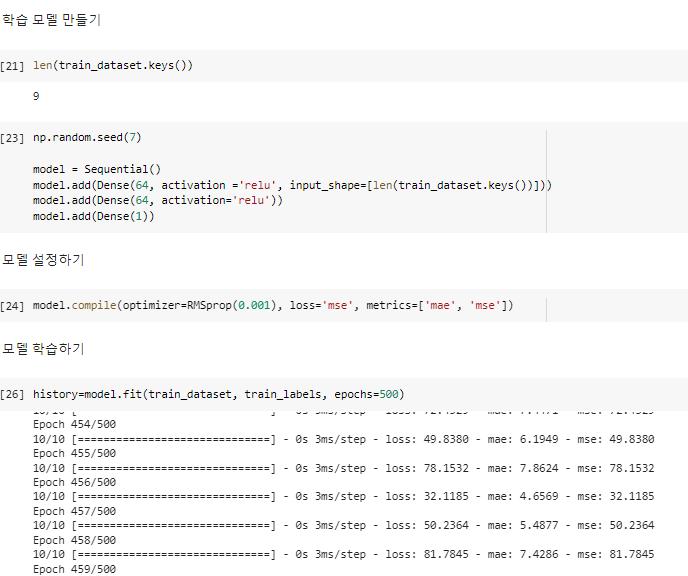
^학습 모델 만들기
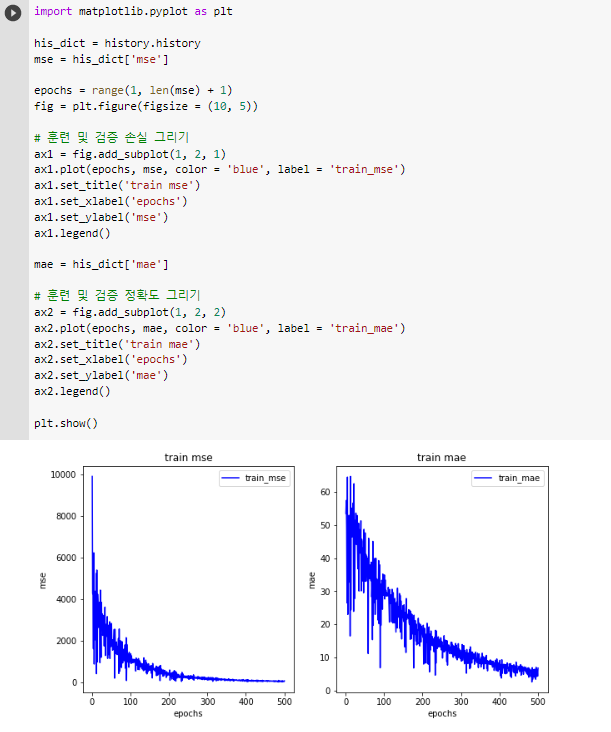
import matplotlib.pyplot as plt

his_dict = history.history
mse = his_dict['mse']

epochs = range(1, len(mse) + 1)
fig = plt.figure(figsize = (10, 5))

# 훈련 및 검증 손실 그리기
ax1 = fig.add_subplot(1, 2, 1)
ax1.plot(epochs, mse, color = 'blue', label = 'train_mse')
ax1.set_title('train mse')
ax1.set_xlabel('epochs')
ax1.set_ylabel('mse')
ax1.legend()

mae = his_dict['mae']

# 훈련 및 검증 정확도 그리기
ax2 = fig.add_subplot(1, 2, 2)
ax2.plot(epochs, mae, color = 'blue', label = 'train_mae')
ax2.set_title('train mae')
ax2.set_xlabel('epochs')
ax2.set_ylabel('mae')
ax2.legend()

plt.show()
^ 그리기
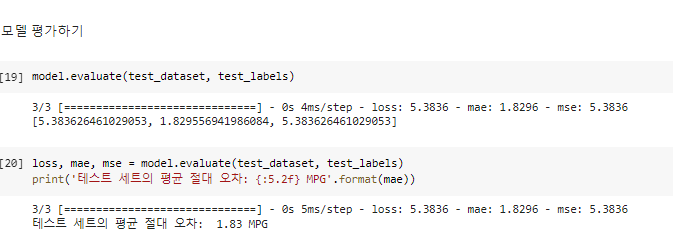
^모델 평가하기
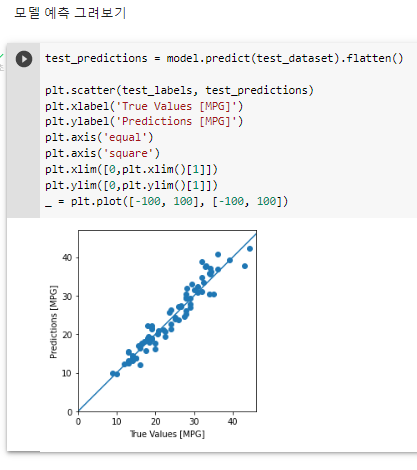
test_predictions = model.predict(test_dataset).flatten()

plt.scatter(test_labels, test_predictions)
plt.xlabel('True Values [MPG]')
plt.ylabel('Predictions [MPG]')
plt.axis('equal')
plt.axis('square')
plt.xlim([0,plt.xlim()[1]])
plt.ylim([0,plt.ylim()[1]])
_ = plt.plot([-100, 100], [-100, 100])
^ 모델 예측 그려보기