
Jupyter & VSCode
12. ~ . matplotlib
- matplotlib 그래프 기본 형태
- plt.figure(figsize=(10, 6))
- plt.plot(x, y)
- plt.show
- matplotlib 그래프 기본 기능
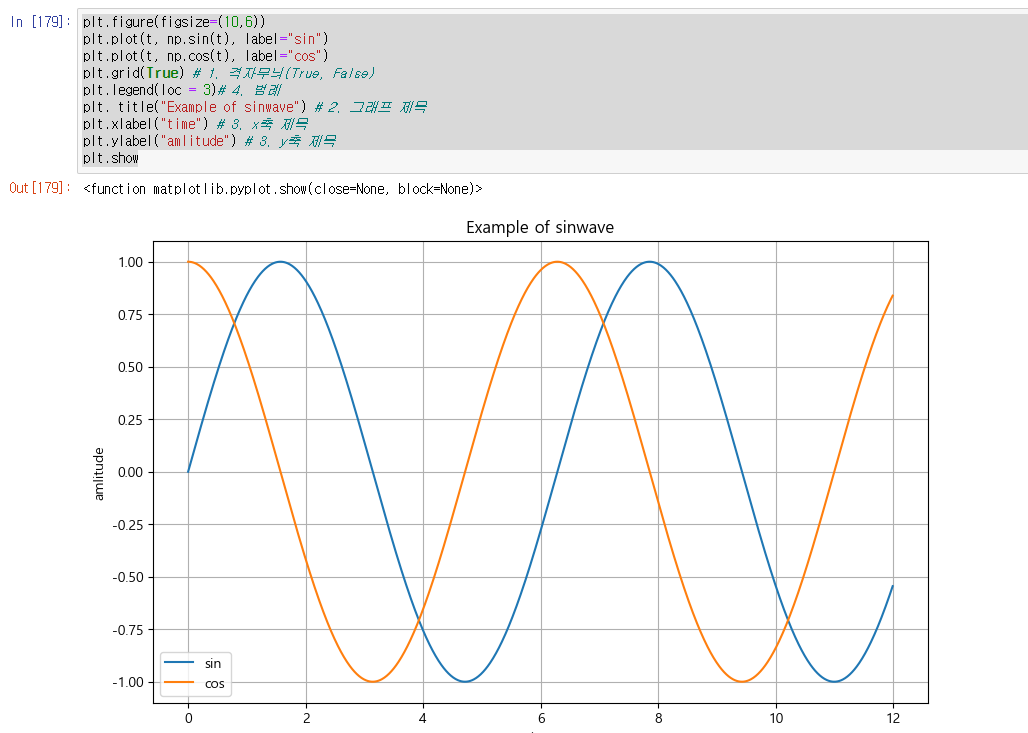
- plt.figure(figsize=(10,6)) = 그래프 크기
- plt.plot(t, np.sin(t), label="sin") = x축 데이터 및 라벨명
- plt.plot(t, np.cos(t), label="cos") = y축 데이터 및 라벨명
- plt.grid(True) = 격자무늬 출력(True, False)
- plt.legend(loc = 3) = 범례 출력(숫자 or 문자로 위치 설정 가능)
- plt. title("Example of sinwave") = 그래프 제목 출력
- plt.xlabel("time") = x축 제목
- plt.ylabel("amlitude") = y축 제목
- plt.show = 그래프 출력
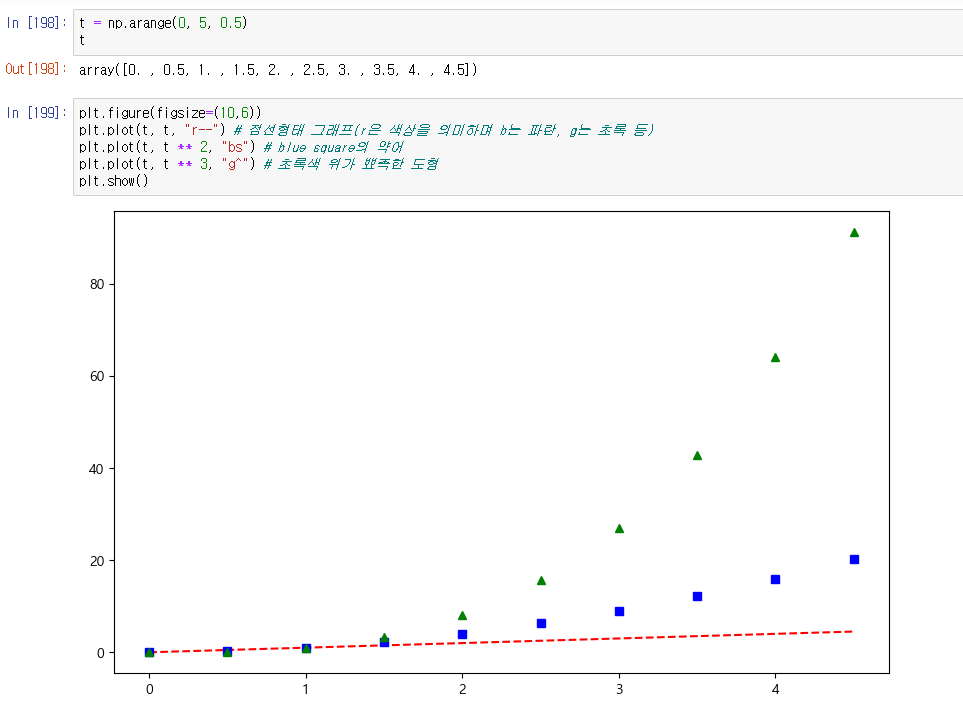
- plt.figure(figsize=(10,6))
- plt.plot(t, t, "r--") # 점선형태 그래프(r은 색상을 의미하며 b는 파란, g는 초록 등)
- plt.plot(t, t ** 2, "bs") # blue square의 약어
- plt.plot(t, t ** 3, "g^") # 초록색 위가 뾰족한 도형
- plt.show()
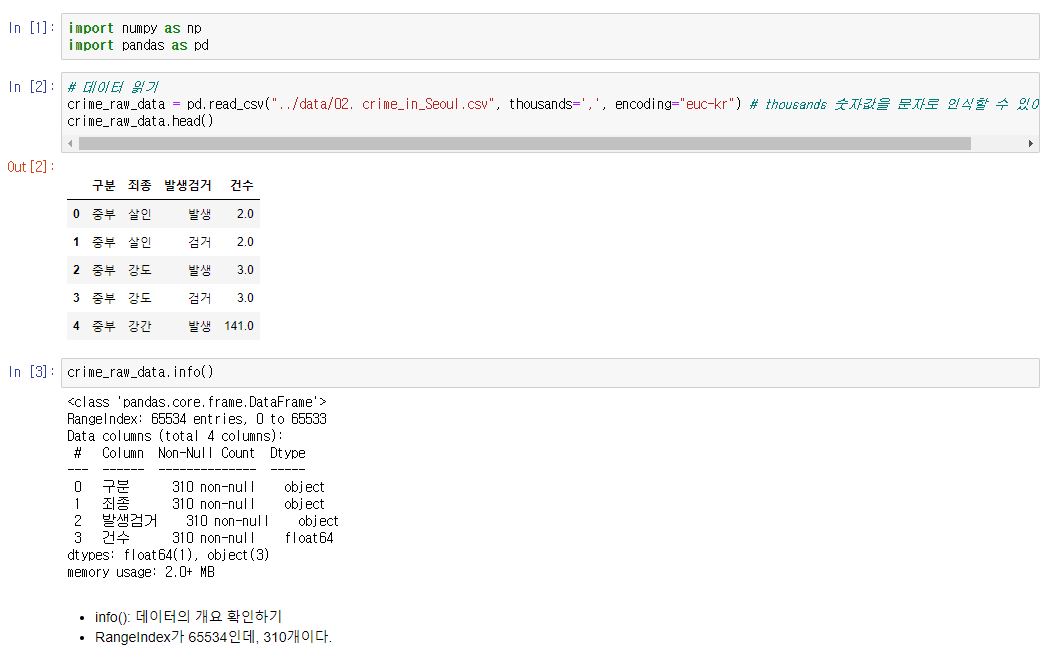
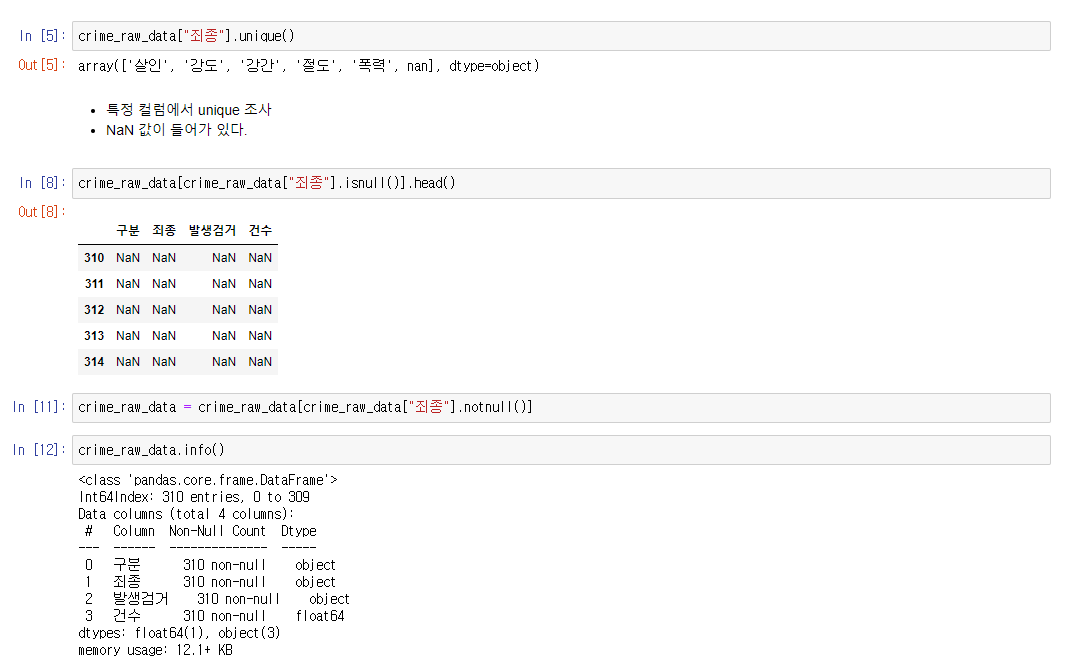
1. 데이터 읽어보기
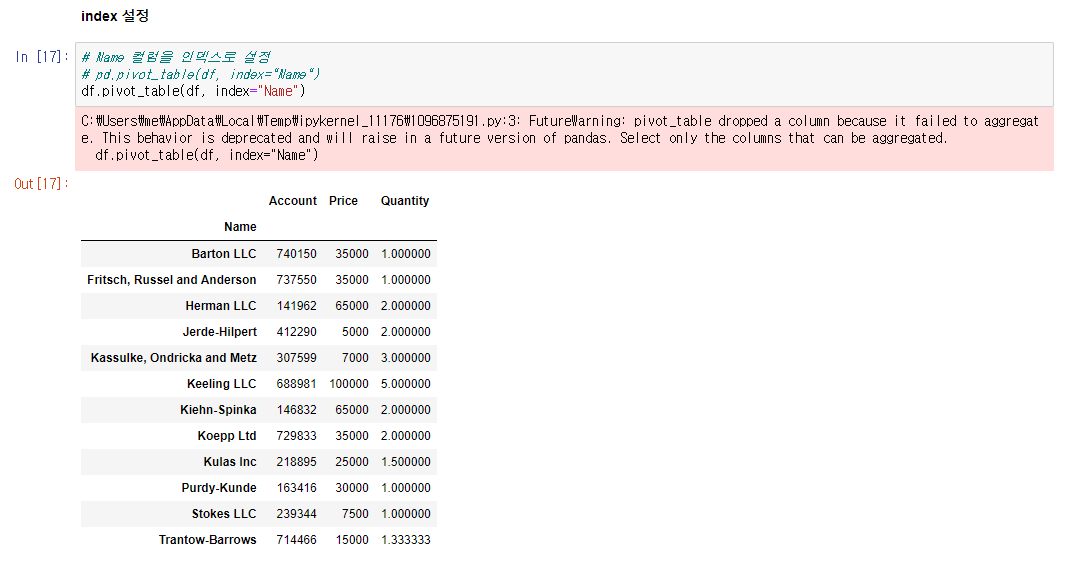
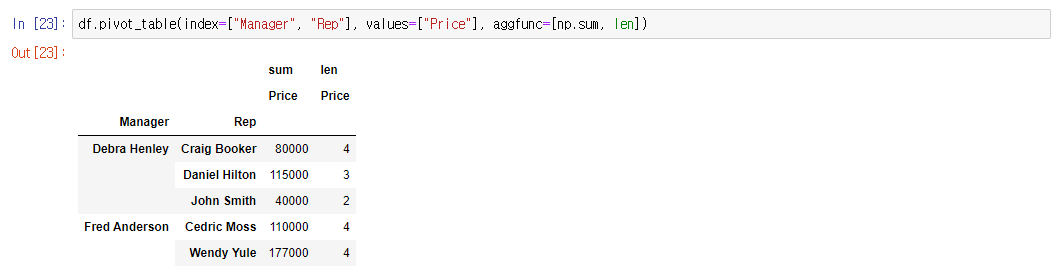
2. Pandas Pivot Table
-
index 설정
-
values 설정
-
columns 설정
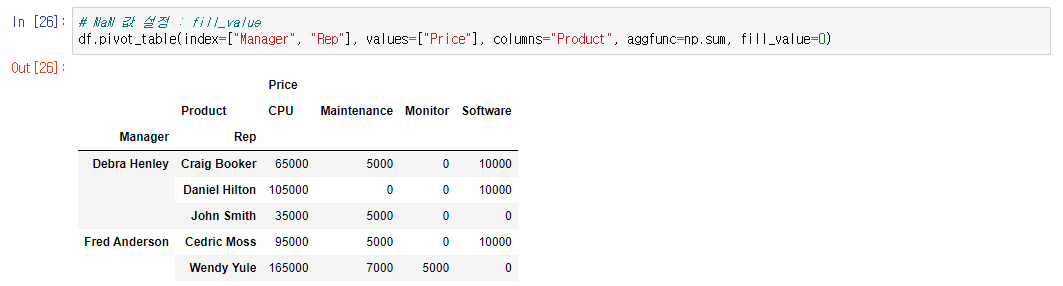
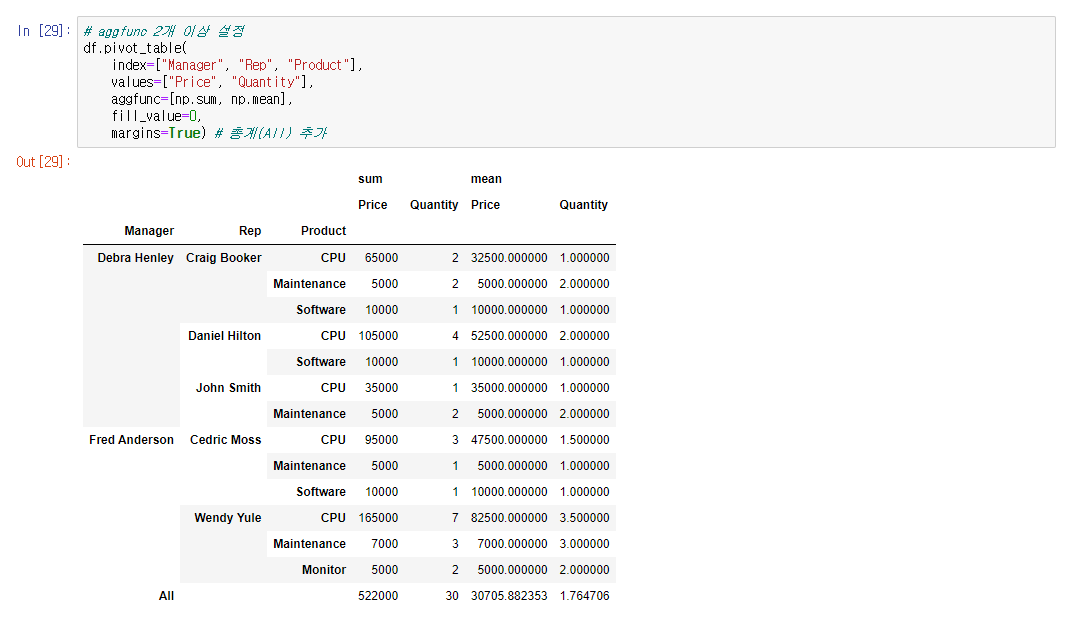
- aggfunc 설정
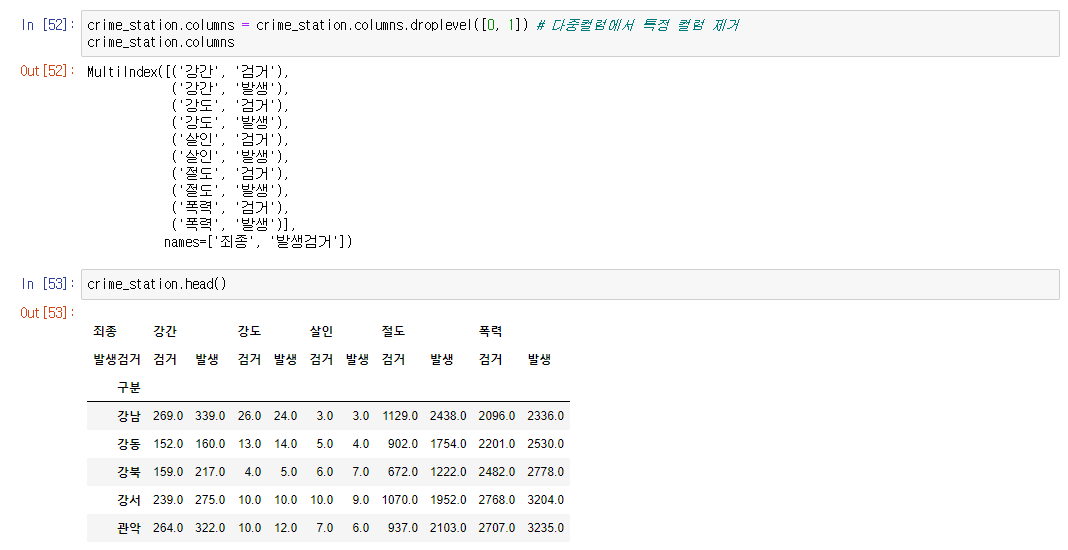
3. 데이터 정리
- pivot table 생성
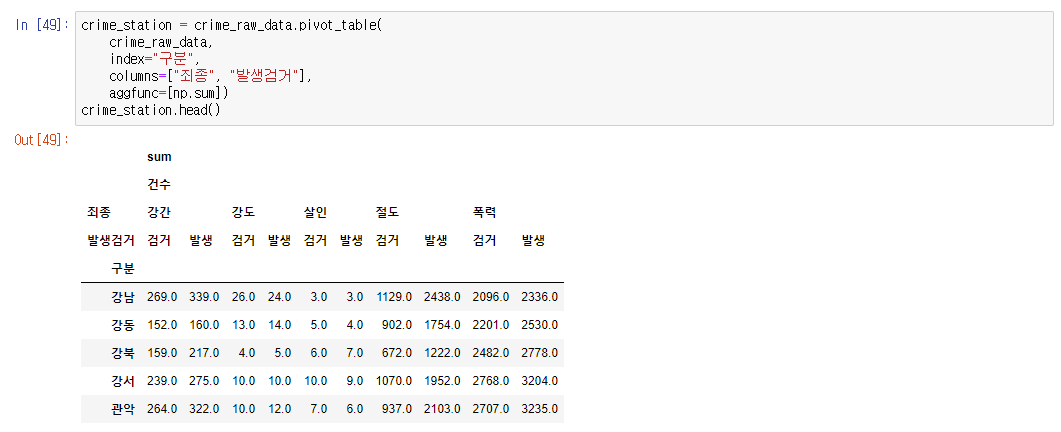
- 멀티 인덱스
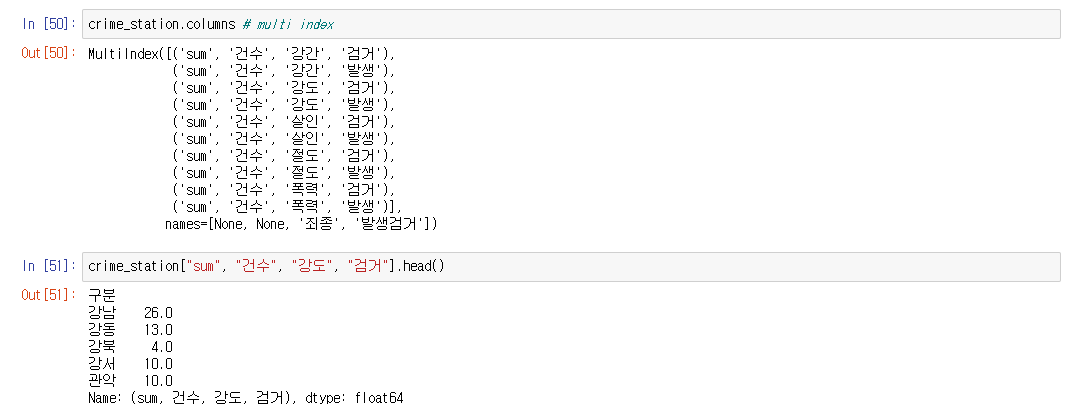
- 다중 컬럼에서 특정 컬럼 제거
4. pip 명령과 conda 명령
4-1. pip 명령
- pip list - 설치된 모듈리스트 반환
- pip install module_name - 모듈 설치
- pip uninstall module_name - 설치된 모듈 제거
4-2. conda 명령
- conda list - 설치된 모듈리스트 반환
- conda install module_name - 모듈 설치
- conda uninstall module_name - 설치된 모듈 제거
- conda install -c channel_name module_name - 지정된 배포 채널에서 모듈 설치
그러나 모든 모듈이 conda로 설치되는 것은 아니다.
pip를 사용하면 conda 환경에서 dependency 관리가 정확하지 않을 수 있어 아나콘다에서는 가급적 conda 명령어를 사용하는 것이 좋다.
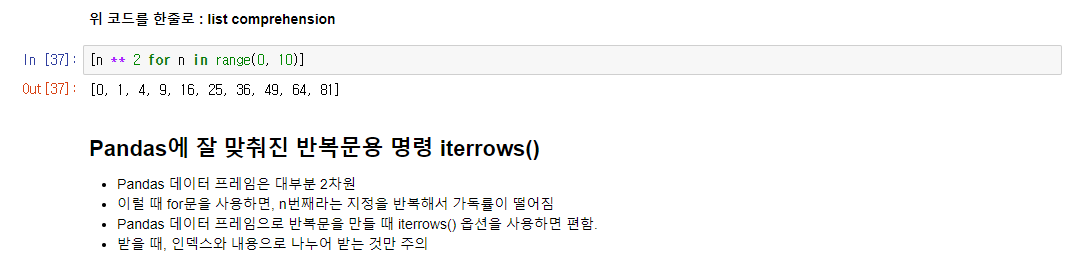
5. for문
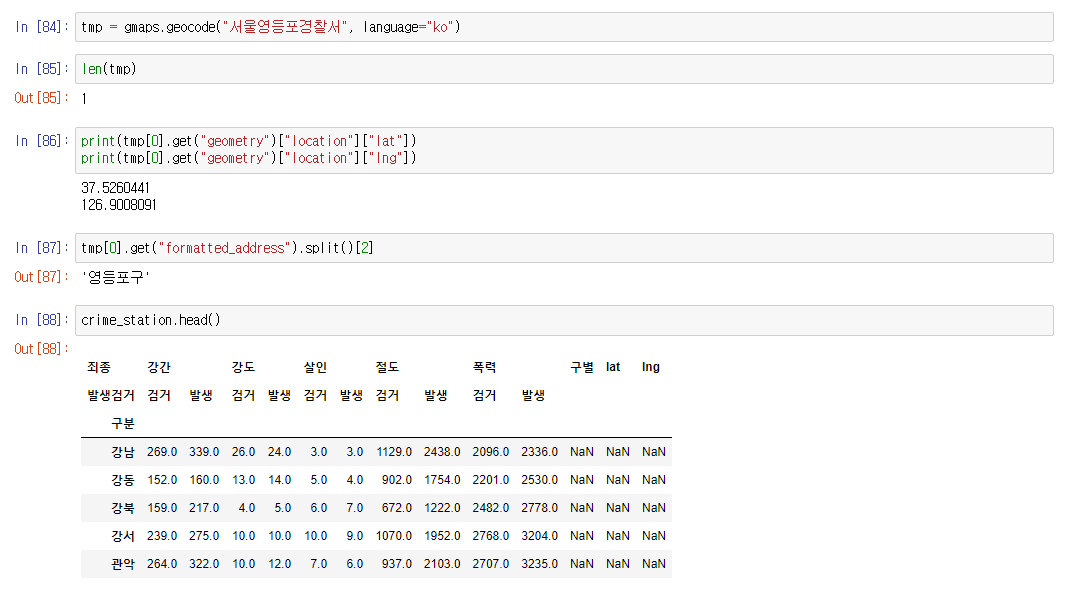
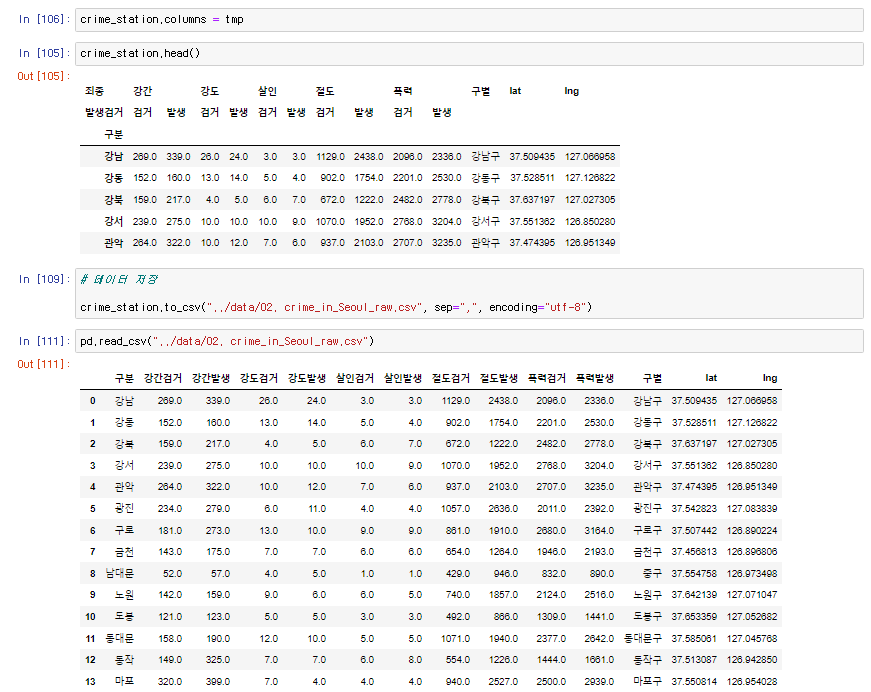
6. Google Maps를 이용한 데이터 정리
- Google Maps에서 가져온 데이터 추출
- 가져온 데이터 추가
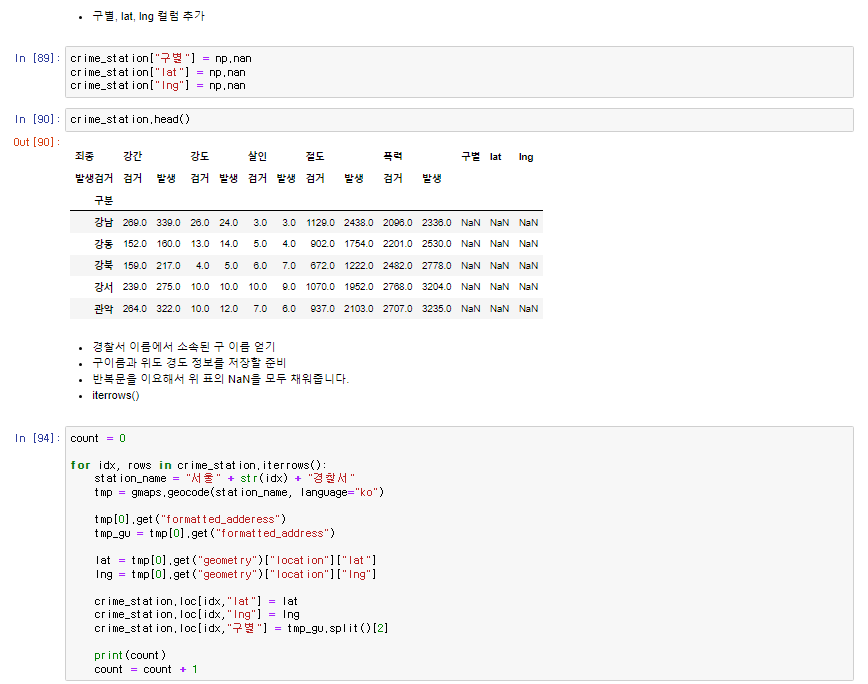
- 가져온 데이터 정리
7. Pivot Table을 이용한 데이터 변경

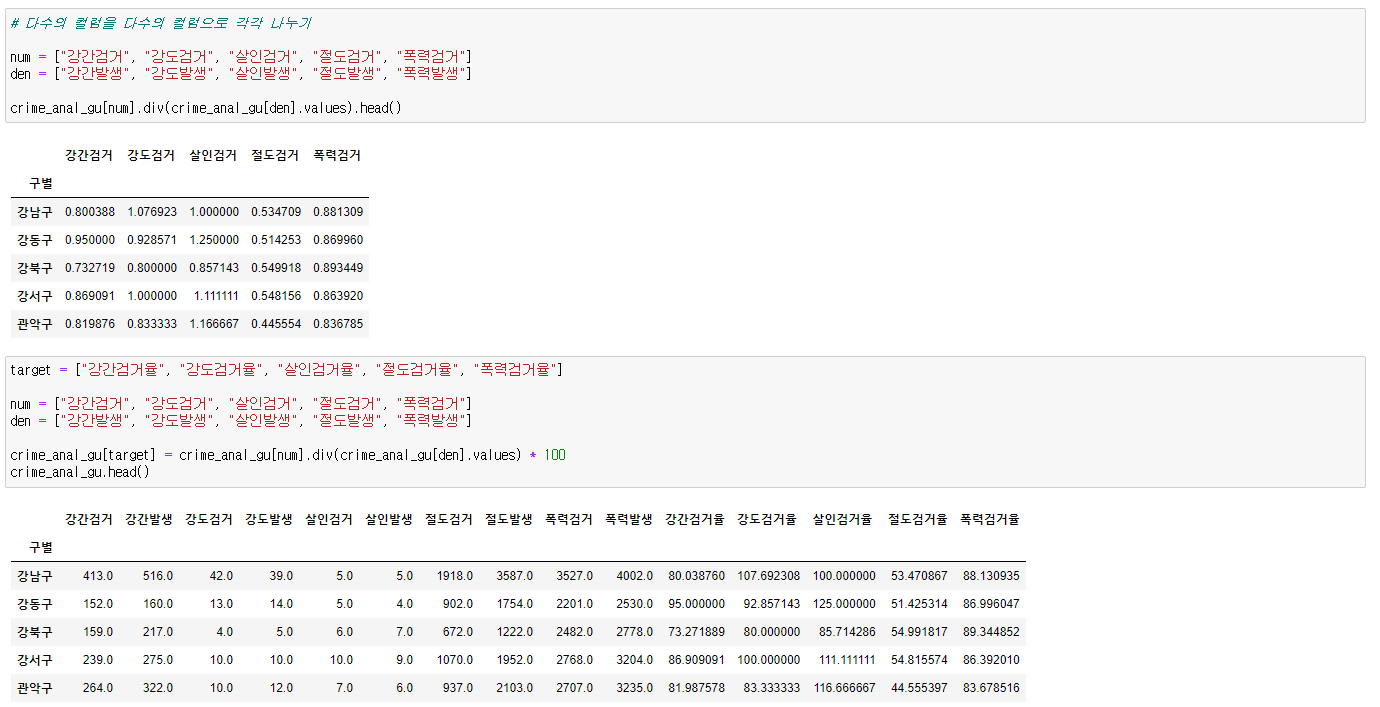
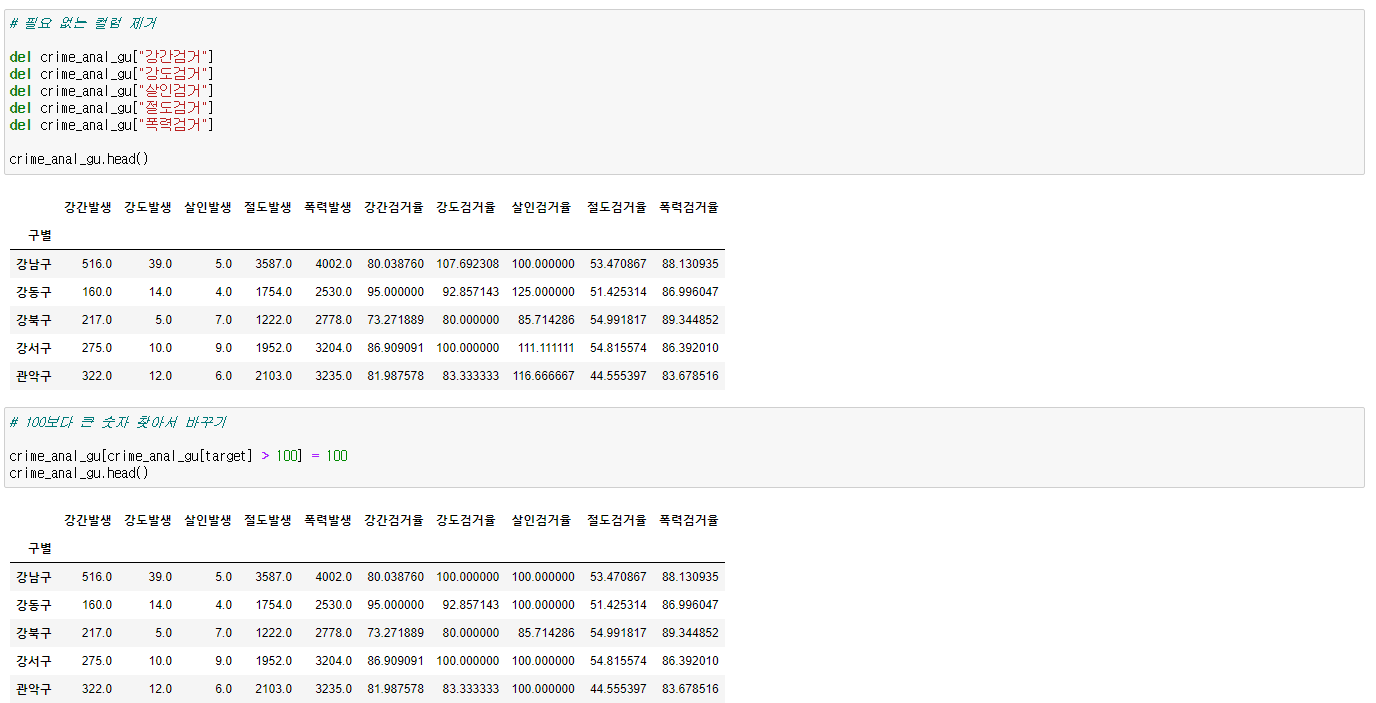
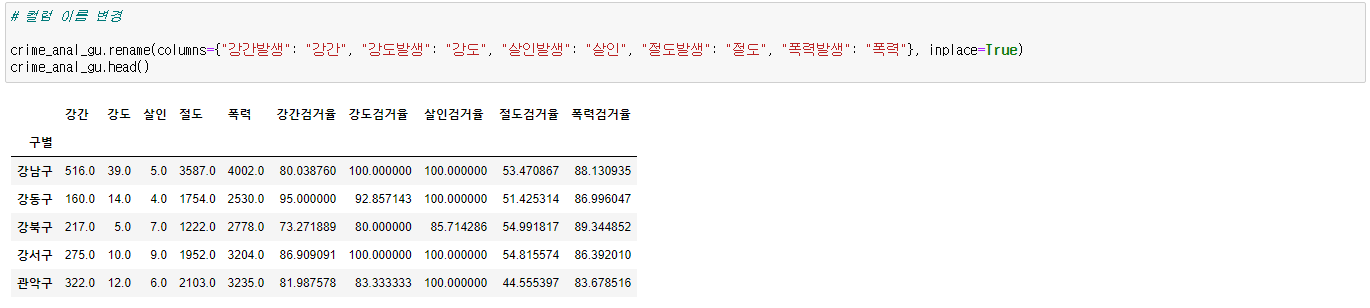
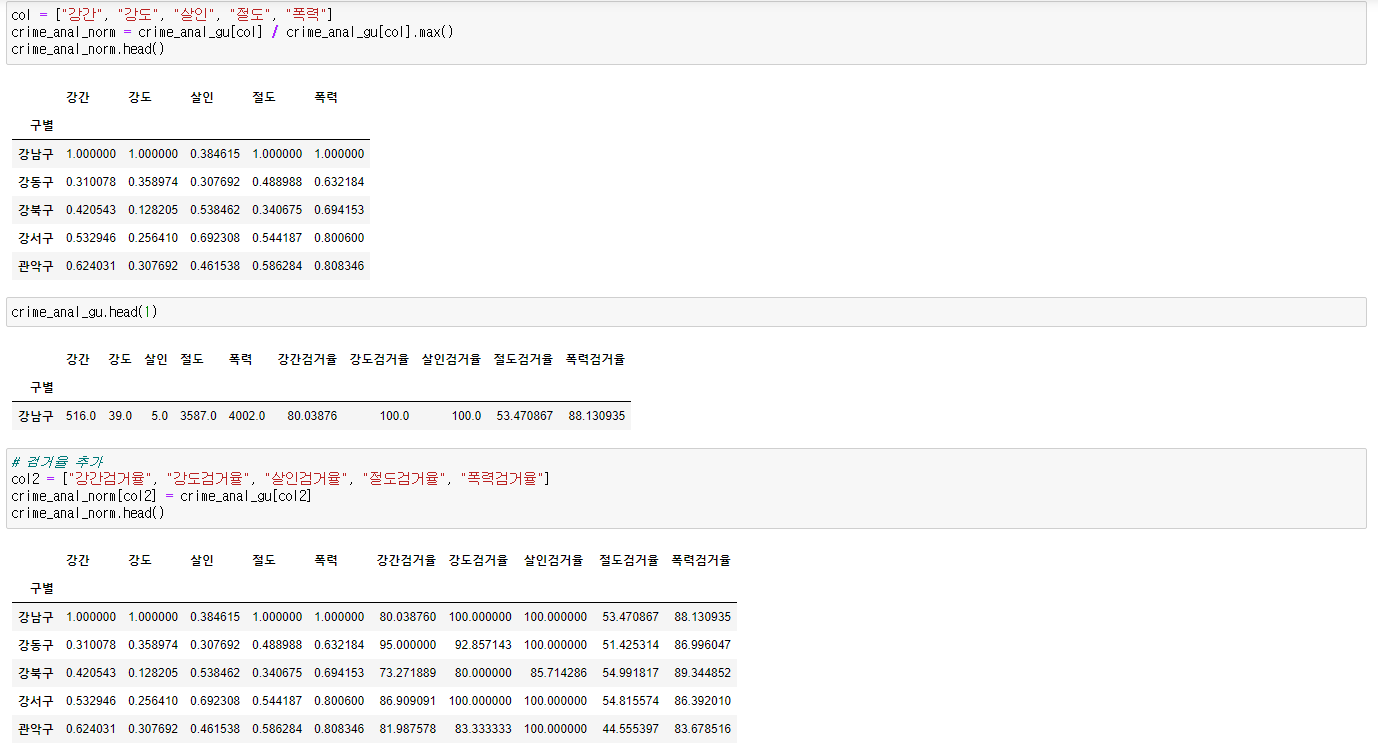
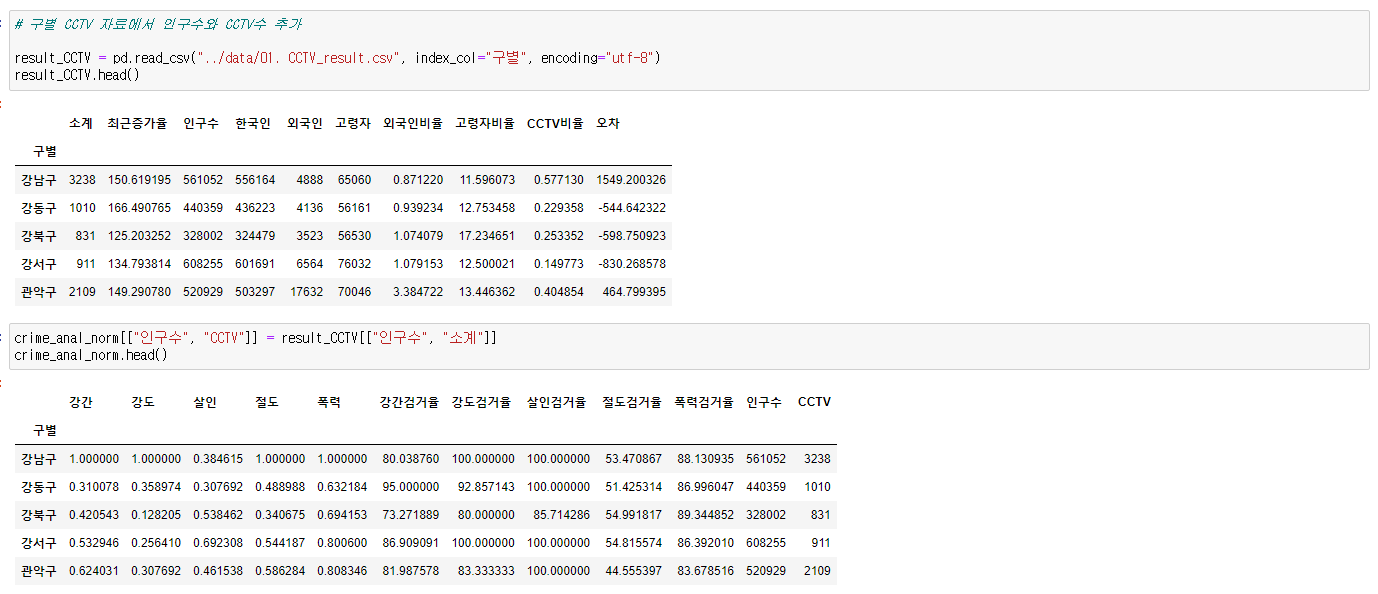
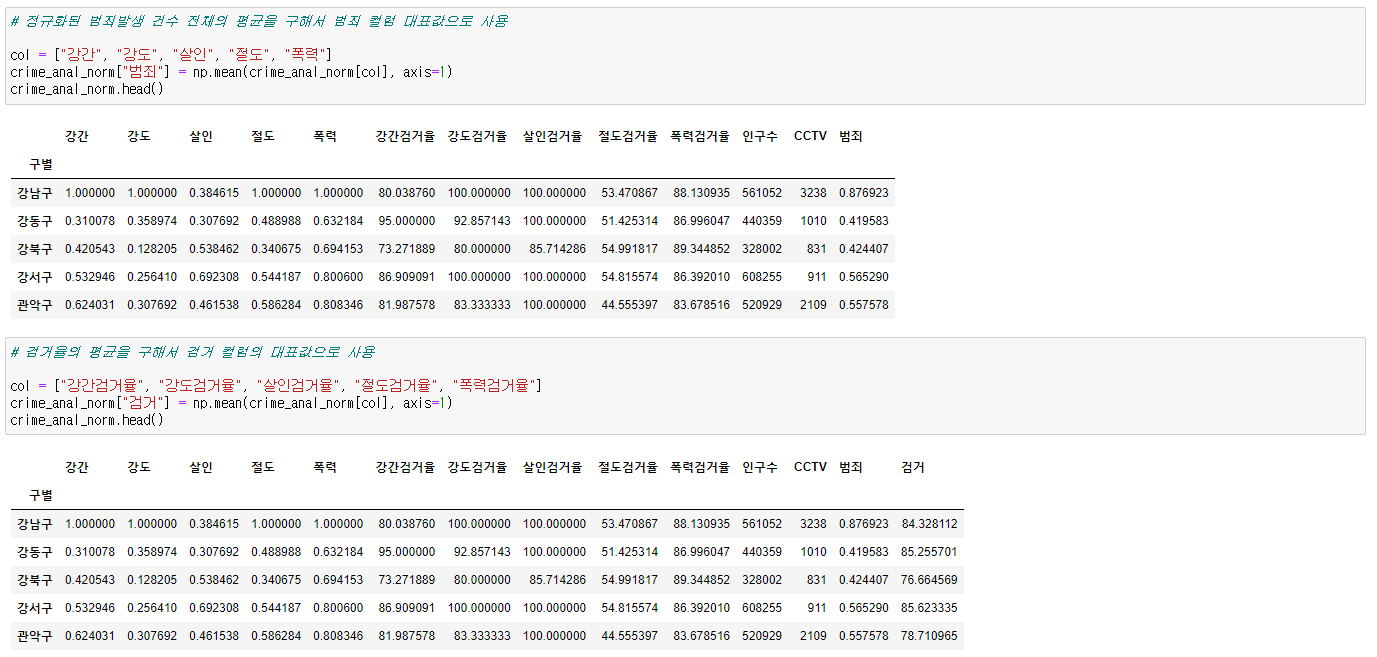
8. 데이터 최종 정리(정규화)

초심자 입니다!