.png)
아래의 방법은 모두 android studio의 emmulator를 사용할 경우에 해당합니다.
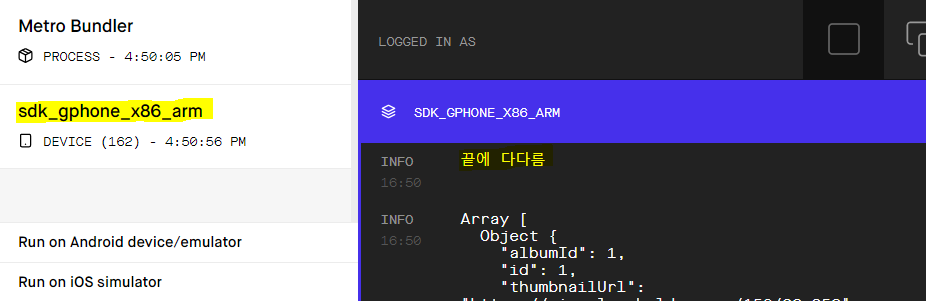
🎨 localhost webpage
- localhost 주소로 실행되는 webpage에서 지금 실행중인 device에 해당하는 tab을 클릭하면 console 값을 확인할 수 있다.
FlatList의 onEndReached event 발생시, fetch 함수를 실행하면서 제대로 event를 전달하는지 확인함

const onEndReached = () => {
  getData();
  console.log("끝에 다다름")
}
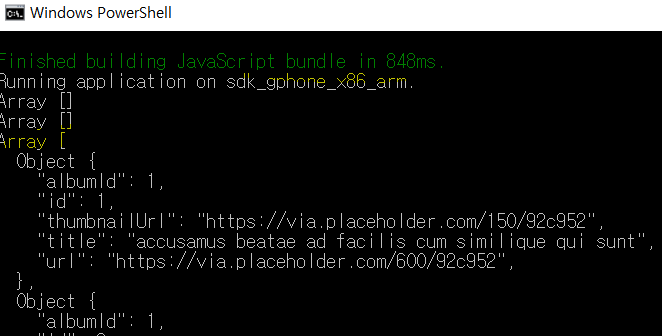
🎨 Terminal
expo start/npm start를 실행한 terminal창에서 console 값을 확인할 수 있다.
화면 render시 fetch 함수를 실행하는데 그 때 fetch된 data를 확인함

useEffect(() => {
  getData();
}, [])
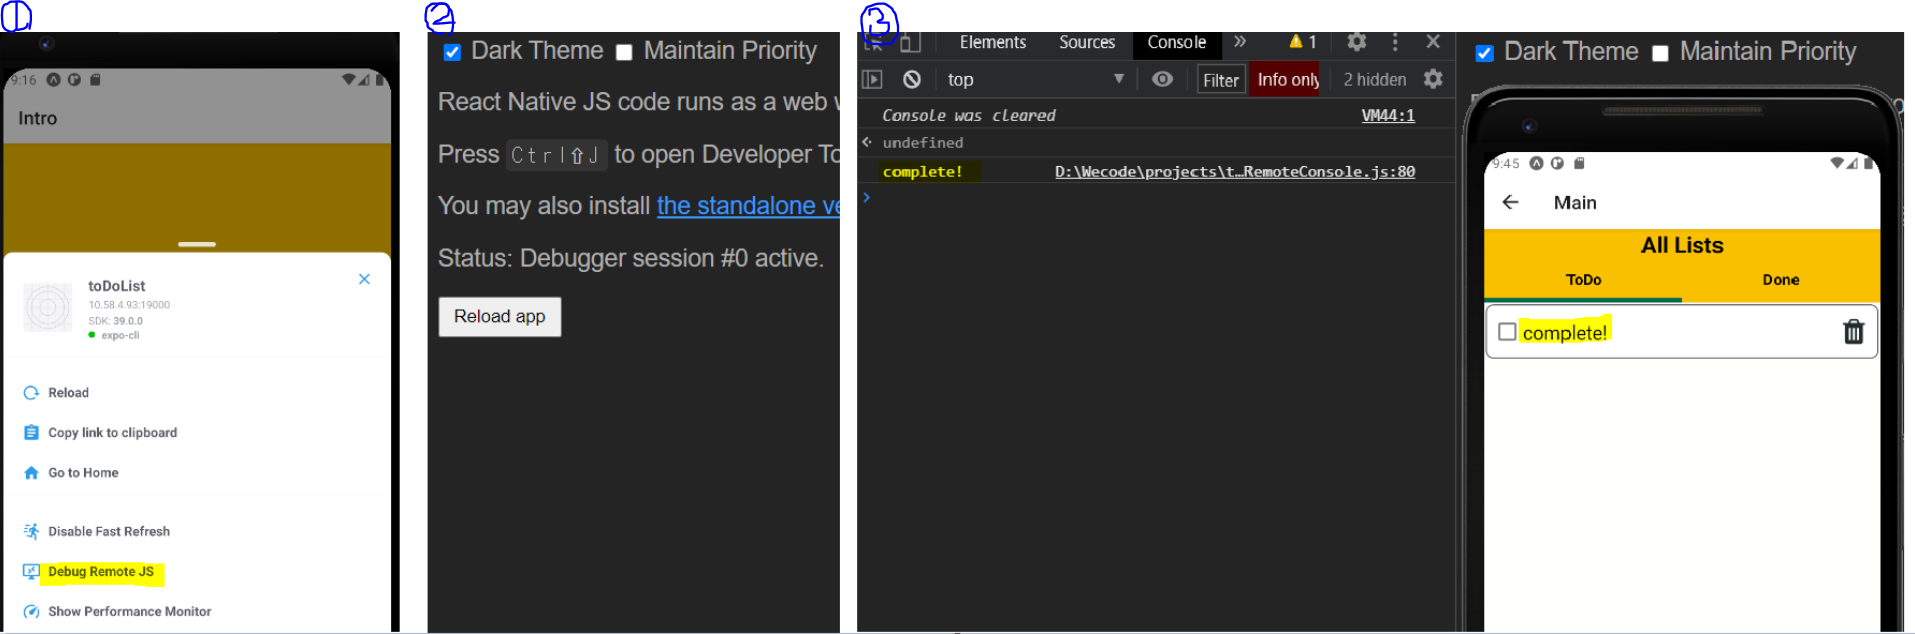
🎨 Debugging library
debugging tool을 사용하기 위해 아래의 library 설치 및 셋팅이 필요합니다.
react-devtools, react-native-debugger-open이 설치된 Project에서 Debug Remote JS를 실행했을때 열리는 Chrome 페이지의 개발자 도구에서 console 값을 확인할 수 있다.
react-devtools
yarn global add react-devtools 또는 npm install -g react-devtoolsreact-native-debugger-open
npm i --save-dev react-native-debugger-open # or -gpackage.json의 scripts 위치에 아래 key-value를 추가한다. "scripts": { "postinstall": "rndebugger-open" }npm run postinstall를 터미널에 입력하여 setting을 마무리한다. › 정상적으로 setting이 완료되었다면 PASS라는 message가 뜬다.
1) DevTool
: emulator로 npm start! > chrome debugging 페이지로 이동 > 개발자 도구
(console 창에서 console 값 확인 가능)
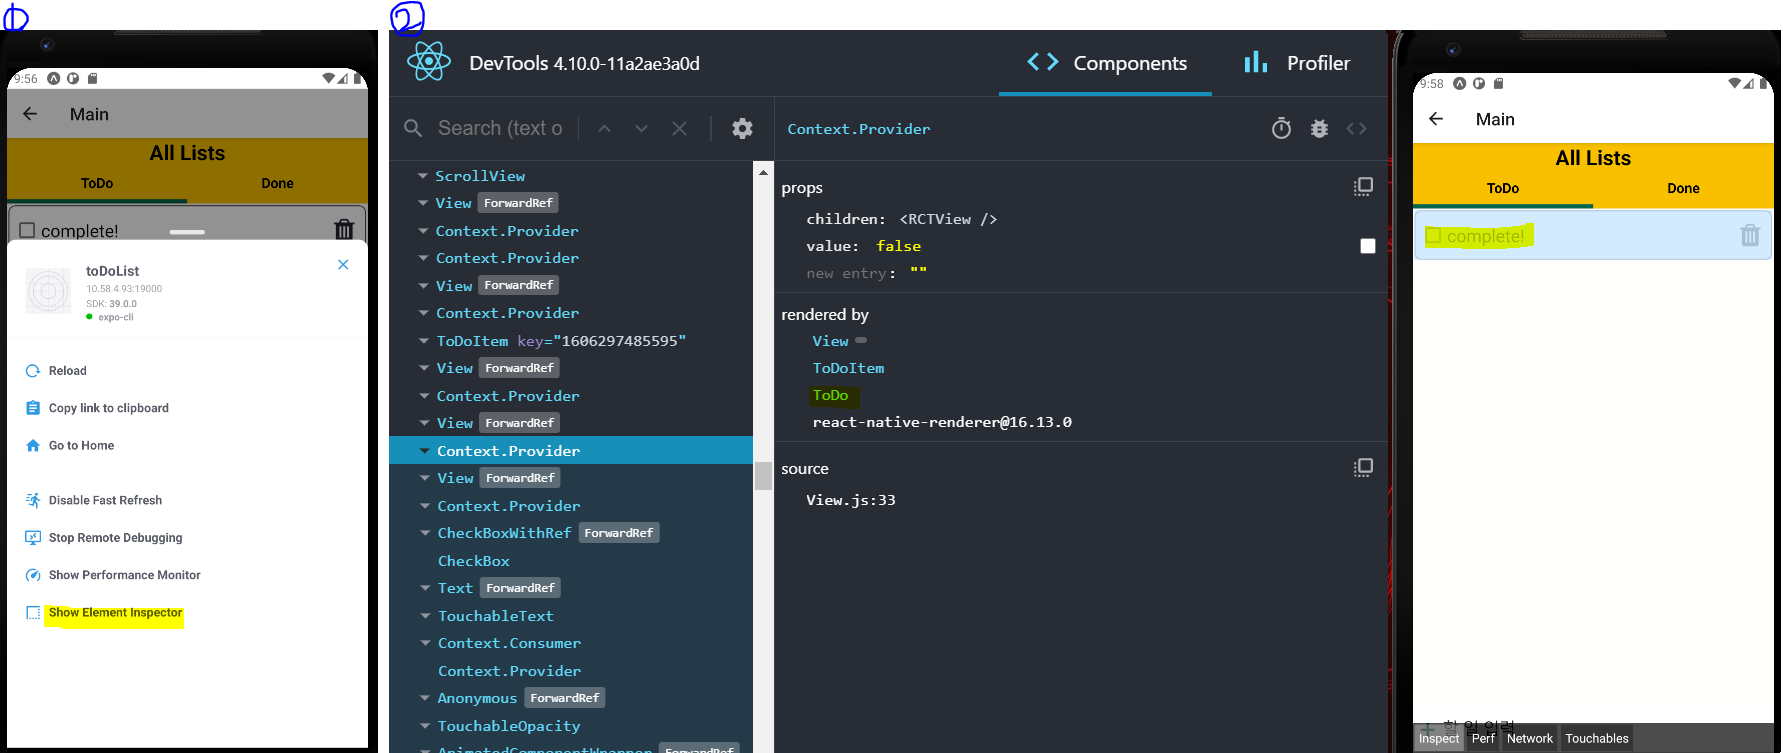
2) React DevTool
:새터미널을 연다 > project 위치로 이동한다 > react-devtools 명령어를 입력한다 > DevTools 실행 프로그램이 열린다
: DevTools라는 새로운 실행 프로그램이 열리면 emulator에 Show Element Inspector를 클릭하여 개발자 도구를 활성화 시킨 뒤, 원하는 component를 클릭하면 DevTools 실행 프로그램에서 props를 확인할 수 있다.
  const handleAddItem = () => {
    console.log(text); // 업데이트된 text state 확인
    if (text) {
      dispatch(addItem({ id: Date.now(), name: text }));
      setText('');
    } else {
      alert('할 일을 입력해주세요 : (');
    }
}; 

Turtle Never stop