
해시코드 질문코드 빈도
- 이전에 실습을 진행한 해시코드 https://hashcode.co.kr 사이트에선 다양한 질문이 올라왔는데, 질문제목 아래에 태그가 있었습니다.
- 이를 스크래핑 해 각 주제 별로 질문수를 파악하고 시각화 해봅시다.
태그 추출
- 먼저
User_Agent를 추가합니다.user_agent = {"User-Agent": "Mozilla/5.0 (Macintosh; Intel Mac OS X 10_15_4) AppleWebKit/537.36 (KHTML, like Gecko) Chrome/83.0.4103.97 Safari/537.36"}
ul태그를 모두 찾은후, 내부의li태그를text로 추출합니다.import requests from bs4 import BeautifulSoup res = requests.get("https://hashcode.co.kr") soup = BeautifulSoup(res.text, "html.parser") ul_tags = soup.find_all("ul", "question-tags") for ul in ul_tags: li_tags = ul.find_all("li") for li in li_tags: print(li.text.strip())결과 :
java
encryption
python
postgresql
python
excel
pyinstaller
openpyxl
kotlin
android-studio
python
python
game
polynomial
python
pandas
selenium
crawling
python
python
pandas
selenium
crawling
xcode
c++
html
Dict 변수를 이용한 빈도 파악
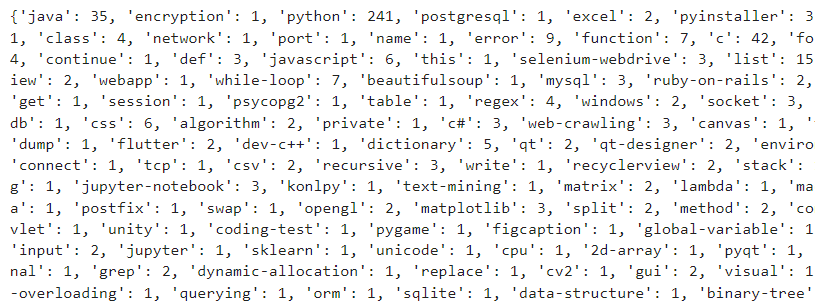
Pagination을 이용해 10 페이지 까지의 태그를 출력,
dict변수를 만들어 질문의 빈도를 확인import time frequency = {} for i in range(1,11): res = requests.get("https://hashcode.co.kr/?page={}".format(i), user_agent) soup = BeautifulSoup(res.text, "html.parser") ul_tags = soup.find_all("ul", "question-tags") for ul in ul_tags: li_tags = ul.find_all("li") for li in li_tags: tag = li.text.strip() if tag not in frequency: frequency[tag] = 1 else: frequency[tag] += 1 time.sleep(0.5) print(frequency)
Seaborn을 이용한 시각화
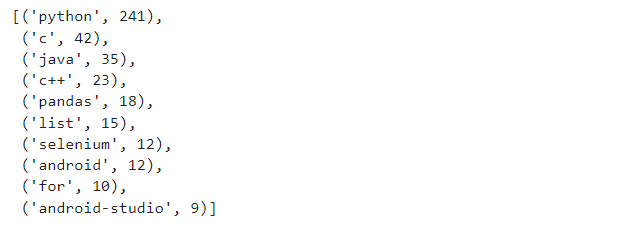
Counter를 사용해 가장 빈도가 높은 value들을 추출from collections import Counter counter = Counter(frequency) counter.most_common(10)
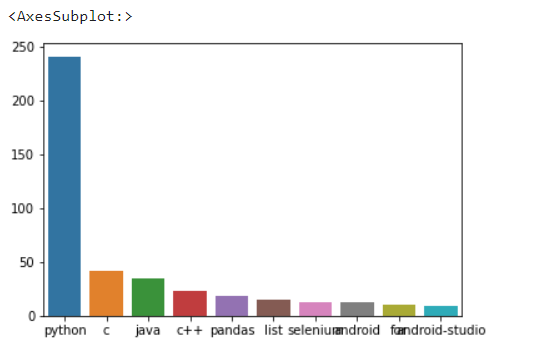
Seaborn을 이용해 Barplot를 그리기import seaborn as sns x = [elem[0] for elem in counter.most_common(10)] y = [elem[1] for elem in counter.most_common(10)] sns.barplot(x=x, y=y)
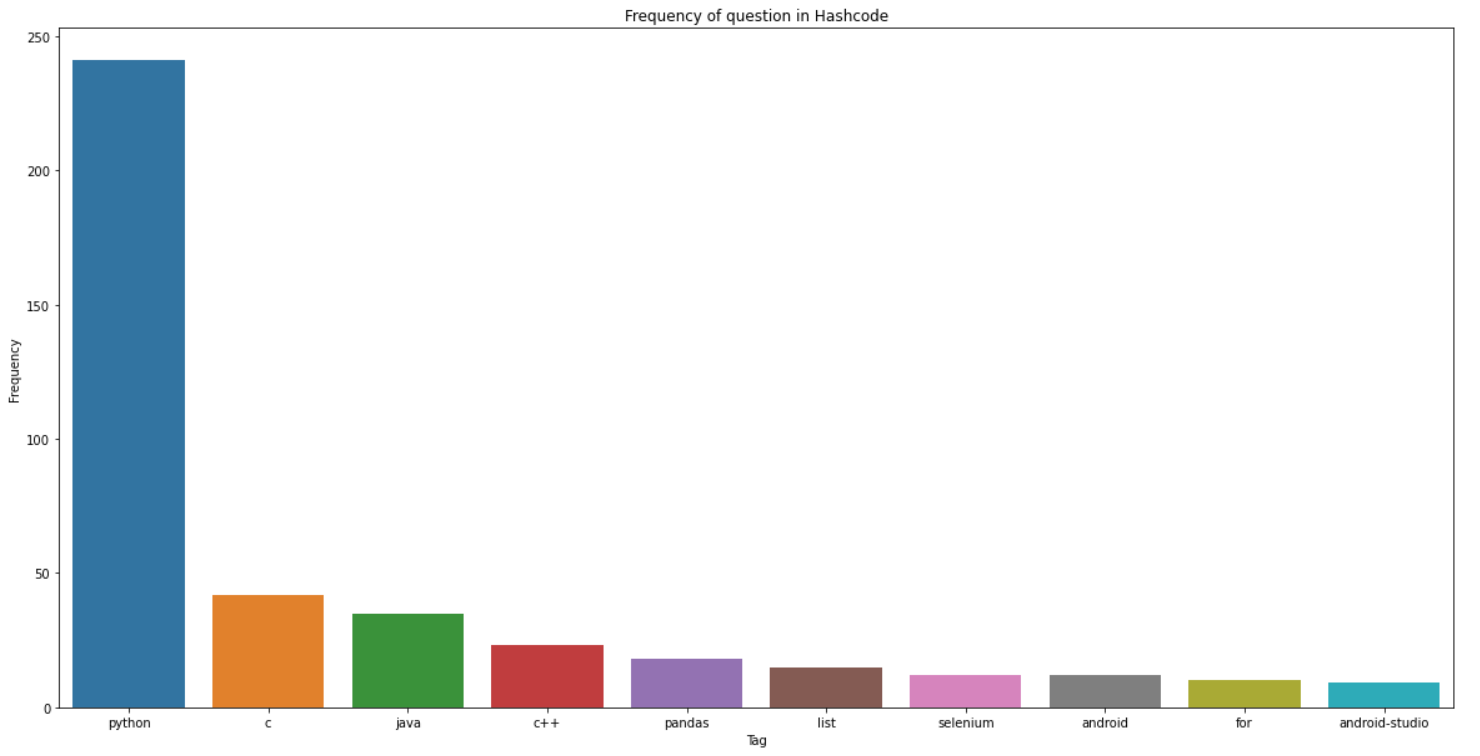
figure,xlabel,title등 을 이용하여 시각화를 완성import matplotlib. pyplot as plt plt.figure(figsize= (20,10)) plt.title("Frequency of question in Hashcode") plt.xlabel("Tag") plt.xlabel("Frequency") sns.barplot(x=x, y=y) plt.show()


AI Tensorflow Python