1. DASK arrays
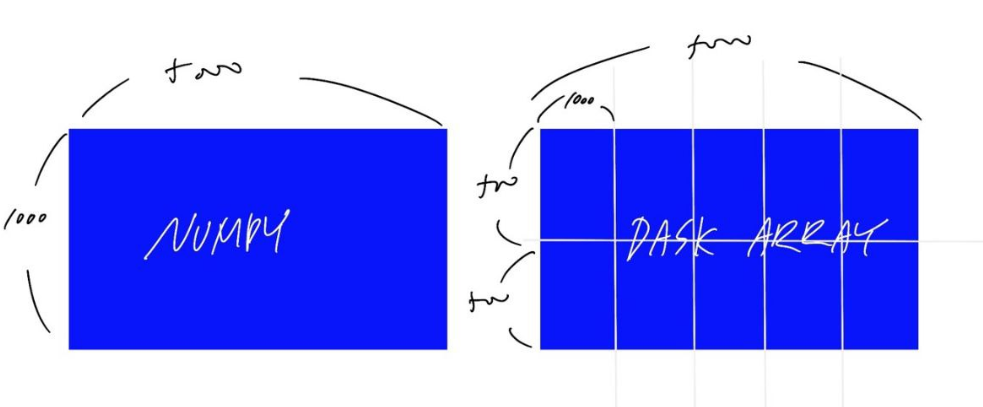
1-1) NUMPY vs DASK Arrays
- numpy array와 사용 방법이 약간 차이나지만 비슷함
- dask array는 chunk size를 확실하게 지정해 주어야 함
- dask array를 compute하면 numpy array로 값 나옴
- dask array method는 numpy의 method와 비슷하게 사용됨
-x.max(),x.min(),x.sum(),x.mean()
# dask arrays

import dask.array as da
import numpy as np

x = np.ones((1000, 5000))
print(x.sum()) # 500000.0

y = da.ones((1000, 5000), chunks = (500, 1000))
print(y.sum().compute()) # 500000.0

# da로 계산한 과정이 더 빠름

print(type(y)) # <class 'dask.array.core.Array'>
print(type(y.sum().compute())) # <class 'numpy.float64'>
 |
|---|
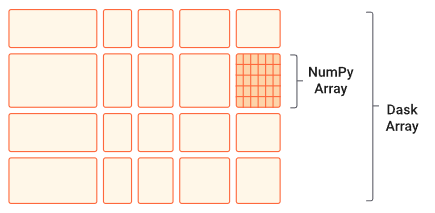
| DASK Chunking Array (source : DASK document) |
 |
|---|
| Numpy vs DASK Array |
1-2) DASK array image
- 이미지를 이용하는 것도 NUMPY와 동일함
import dask.array as daimport da.image - chunked image만 보는(생성하는) 경우
.map_blocks()사용
import dask.array as da
import da.image

img_array = da.image.imread('img/*.png') # lazy 값
# 위의 코드는 전체 이미지를 다 보는 경우
# chunk 이미지만 보는 경우는 아래와 같이 사용함

chunk_func_img = img_array.map_blocks(my_func)
# Convert the color photos to grayscale
grayscale_images = image_array.mean(axis=-1)

# Apply the edge detection function
edge_images = grayscale_images.map_blocks(compute_edges)

# Select the zeroth image and compute its values
sample_image = edge_images[0].compute()

# Show the result
plt.imshow(sample_image, cmap='gray')
plt.show()
2. DASK DataFrame
2-1) Basic
-
import dask.dataframe as dd -
.delayed를 사용하지 않고 효율적인 작업을 가능하게 함
import dask.dataframe as dd
d_df = dd.read_csv('data/*.csv', blocksize = '100mb')
# data 폴더 내의 모든 csv 파일을 lazy하게 읽음 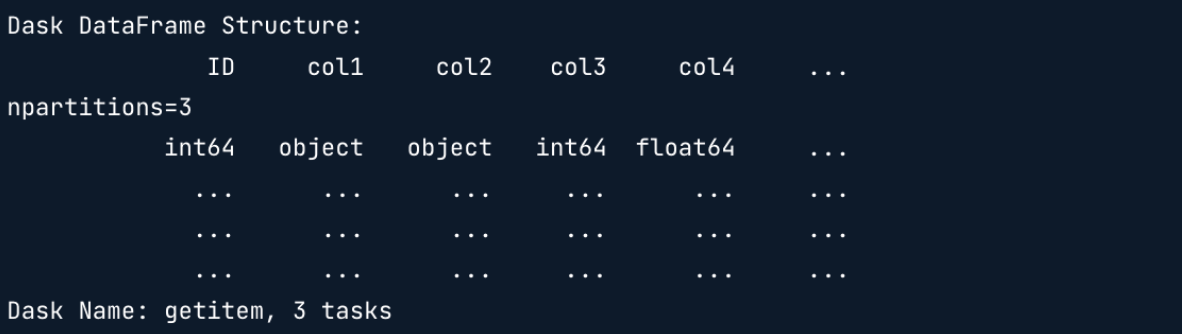
-
column name(Structure), data type, 그리고 n개의 chunk(npartitions = n)의 결과 확인 가능
(n개의 csv파일이 존재한다는 의미) -
파일이 너무 큰 경우 chunk size를 직접 설정
blocksize = '' -
한 csv 파일의 용량이 blocksize보다 작으면 해당 csv 파일이 1 partition. 클 경우엔 나눠짐
-
데이터 프레임 분석 속도를 높이길 원한다면 Parquet을 사용해야 함. 데이터 읽고 쓰는 것이 빨라짐.
dd.read_parquet(),dask_df.to_parquet()
2-2) Syntax
-
.head(),.to_csv('file-*.csv'),.groupby(),.nlargest(n= , columns =),.min()등의 DataFrame과 동일한 작업이 가능함 -
Datetime function 사용 가능
-import dask.datetime as dd
-dd.to_datetime(d_df['date'])
-d_df['date'].dt.year
# Convert the release_date column from string to datetime

df['release_date'] = dd.to_datetime(df['release_date'])
# df['release_date'].to_datetime()은 오류남

# Show 5 rows of the DataFrame
print(df.head())
3. Multidimensional Arrays
-
이미지, 음성, 비디오 등의 데이터
-
Array like data는 다양한 포맷이 존재함
3-1) HDF5
-
hierarchical data format
-
하나의 file 내에 multiple dataset이 존재함(한 폴더 안에 다양한 file이 존재하듯이)
-
python에서는
h5py package를 사용함 -
chunk size를 수동으로 지정해주어야 함
import h5py

#open
file = h5py.File('data.hdf5')

# print the available datasets inside the file
print(file.keys())

# 위의 결과를 통해 해당 파일 안에 몇 개의 데이터셋이 있는지 확인할 수 있음
# dictionary 처럼 확인됨
# <KeysViewHDF5 ['alpha', 'beta', 'gamma']>

# select dataset alpha
dataset_1 = file['/alpha']
print(dataset_1)

# data shape 및 type 확인 가능
# <HDF5 dataset 'alpha' : shape (5000, 100, 100), type '<f4'>
# 아직 데이터 load는 안됨


# data chunk size를 지정해주어야 함
import dask.array as da
# load dataset into a dask array
alpha = da.from_array(dataset_1, chunks = (100, 50, 50))
3-2) Zarr
-
hierarchical dataset
-
조금 더 현대화된 array, designed to be chunked → chunk size를 자동으로 지정해줌
-
AWS, Google Cloud와 같은 cloud computing service에 스트리밍하기 좋음
-
hdf5와는 다르게 해당 파일 structure 확인할 수 있음
hdf5_file = h5py.File('data/esample.hdf5')

exam = da.from_array(hdf5_file['/exam'], chunks = (12, 20, 20))

# Select only the 24 am
hour_24 = exam[0::24]

# Calculate the mean exam on 24 a.m. for each location
hour24_mean = hour_24.mean(axis = 0)

plt.imshow(hour24_mean.compute())
plt.show()
# data.zarr file, weather dataset
weather_ = da.from_zarr('data.zarr', component = 'weather')

# To see the chunk sizes
print(weather_)
# dask.array<from-zarr, shape = (1000, 100, 100), dtype = float32, chunksize = (100, 20, 20), chunktype = numpy.ndarray>

# Find the min
low_mean = weather_.min().mean()

low_mean_value = low_mean.compute()

print(low_mean_value)
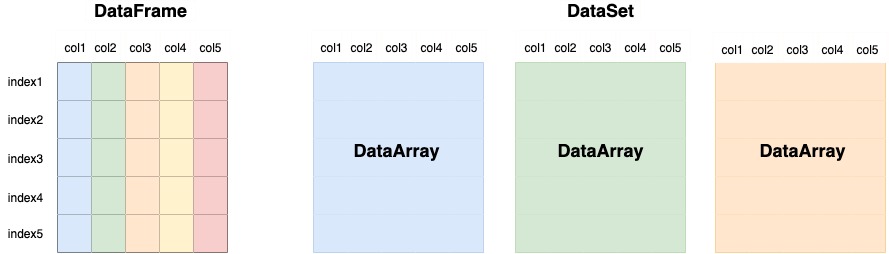
4. Xarray
- Xarray는 pandas와 같이 index label을 사용하지만 더 high dimensional arrays
- DataArray : for a single data variable
- Dataset : a container for multiple DataArrays (Data Variables)

- pandas가 하나의 인덱스(i.e. 위도)를 갖고있다면, Xarray는 multiple 인덱스(i.e. 위도, 경도, 시간)를 가진 Multi Dimensional Array라는 것
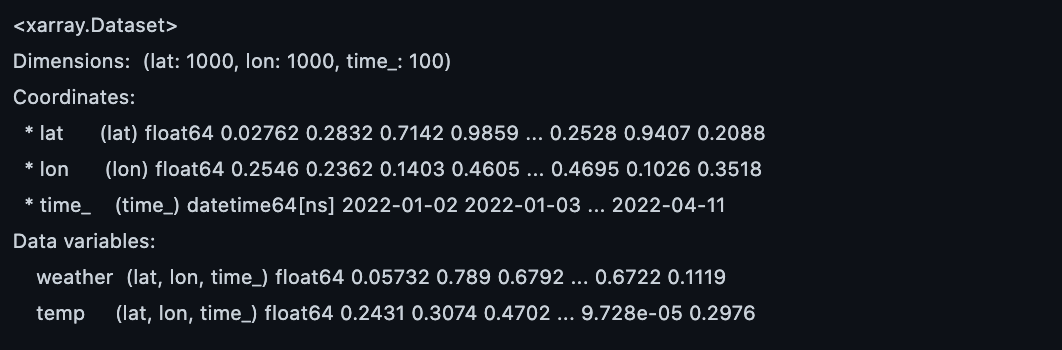
- zarr 파일 안에 있는 하나의 데이터셋만 load하는 것이 아닌 xr을 이용하여 모든 데이터셋을 로드할 수 있음
# xr open
import xarray as xr
ds = xr.open_zarr('data.zarr')
print(ds)

# xr 생성
def rand_time(start = '2022-01-01', end = '2022-05-10', number=1):
    time_list = []
    current = datetime.datetime.strptime(start, "%Y-%m-%d")
    while current < datetime.datetime.strptime(end, "%Y-%m-%d"):
        current += datetime.timedelta(days = number)
        time_list.append(current)
    return time_list

rand_time('2022-01-01', '2022-05-10', number=1)

xarray_1 = xr.Dataset(
    {'weather' : (('lat', 'lon', 'time_'), np.random.rand(1000, 1000, 100)),
    'temp' : (('lat', 'lon', 'time_'), np.random.rand(1000, 1000, 100))},
    coords = {
        'lat': list(np.random.rand(1000)),
        'lon': list(np.random.rand(1000)),
        'time_': rand_time('2022-01-01', '2022-04-11', number=1)
        },
)

print(xarray_1)

# variable : data_array(2개 존재 _ weather, temp)
# variable 안에는 3개의 coordinates _lat, lon, time_ 이 존재 (multi index 정보)
xarray_1.to_zarr('test3.zarr')

import dask.array as da
xarray_1_read = da.from_zarr('test3.zarr', component='weather')
xarray_1_read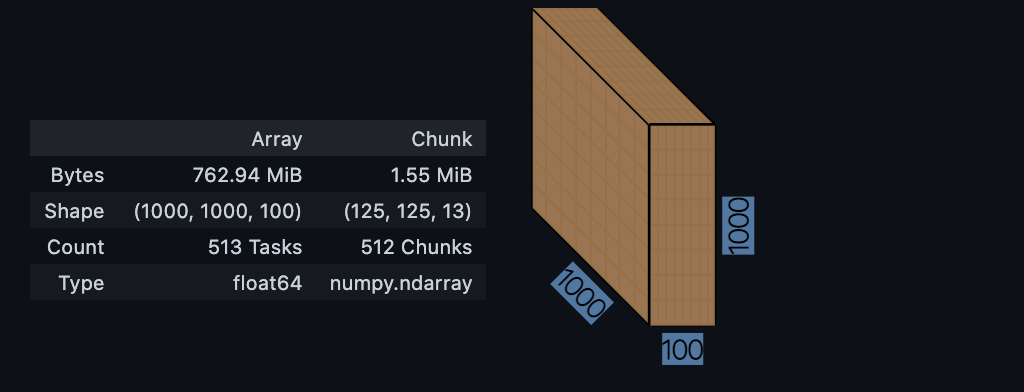
- coordinates(인덱스)를 제외하고는 lazy한 값
- data variable: data of interest
- coordinate: label to describe the data of interest
i.e. latitude, longitude, time : coordinates // temperature : data variable
5. DataFrame vs Dataset
DataFrame | DataSet |
|---|---|
df.loc['2022-01-01'] | ds.sel(time = '2022-01-01') |
df.iloc[0] | ds.isel(time = 0) |
df['column0'] | ds['variable0'] |
df.mean() | ds.mean() ds.mean(dim = ('dim0', 'dim1')) |
df.rolling(10).mean() | x = ds.rolling(dim1=10).mean() x.compute() |
6. Plotting
ds['variable0'].plot()

fig, (ax1, ax2) = plt.subplots(1,2, figsize=(8, 5))

# Plot ax1
ds_sel['weather'].plot(ax = ax1)

# Plot x
x.plot(col='month', col_wrap=4, add_colorbar=False)
# col_wrap 한 줄에 몇 개의 그래프를 그릴 것인가

plt.show()- 데이터가 1D, 2D, 3D일때, 알아서 Line, Heatmap, Histogram 그래프로 Plotting
- Plotting은 lazy가 불가능함
