
데이터 다루기
02-1 훈련 세트와 테스트 세트
지도 학습과 비지도 학습
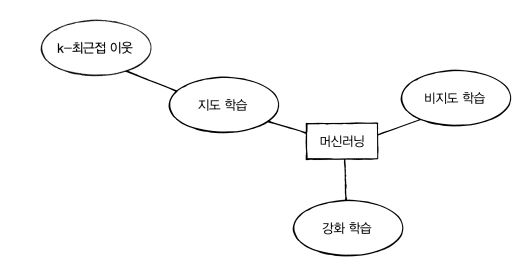
- 지도학습 알고리즘은 훈련하기 위해 데이터와 정답이 필요하다
- 비지도 학습은 입력 데이터만 주어지고 데이터로부터 스스로 특성을 찾아내는 학습 방법이다.
훈련 세트와 테스트 세트
- 훈련세트는 머신러닝 훈련에 사용되는 데이터 세트
- 테스트 세트는 머신러닝 테스트에 사용되는 데이터 세트. 우리의 예제(도미, 빙어 예제)에서는 35개 훈련, 14개 테스트 세트로 사용
샘플링 편향
전체 데이터를 대표할 수 있는 샘플링이 아닌 한쪽으로 치우친 샘플링
- 주어진 데이터를 슬라이싱으로 훈련세트와 테스트 세트를 나눌 경우, 샘플링 편향이 생길 수 있다. 따라서 슬라이싱이 아닌 다른 방법이 필요함
넘파이
파이썬의 대표적인 배열 라이브러리
- np.arrange(n): 0부터 n까지의 숫자로 구성된 오름차순 배열을 만든다.
- np.shuffle(arr): 주어진 배열을 무작위로 섞는다.
- 여기서는 샘플링 편향을 극복하고 적절한 테스트 세트와 훈련 세트를 나누기 위해 사용됨
#sampling bias
import numpy as np
input_arr = np.array ( fish_data )
target_arr = np.array ( fish_target )
print( input_arr )

#random index
index = np.arange( 49 )
np.random.seed(42)
np.random.shuffle( index )

train_input = input_arr [ index[: 35]  ]
train_target = target_arr [ index [: 35] ]

test_input = input_arr [ index[35 : ] ]
test_target = target_arr [ index [35 : ] ]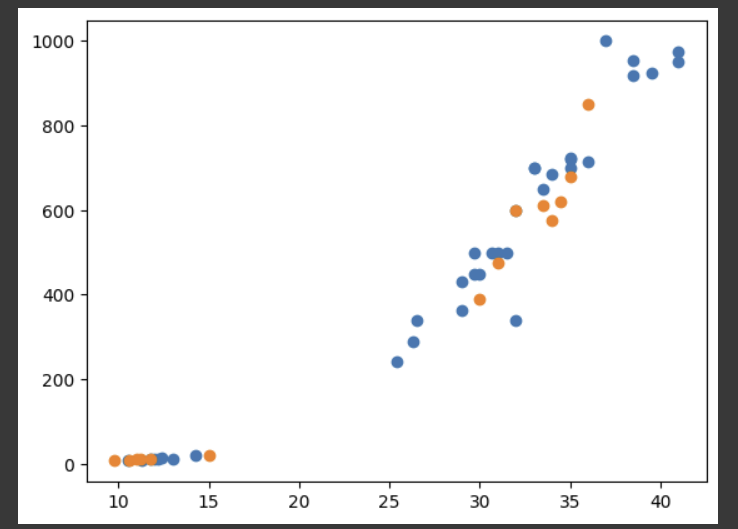
샘플이 적절하게 섞인 것을 확인 할 수 있다.
두 번째 머신러닝 프로그램
사용 모델: KNeighborsClassifier
목표: 주어진 빙어, 도미 데이터를 테스트세트와 훈련세트로 나누어서 모델을 훈련하고 테스트를 통해 모델을 평가한다.
from sklearn.neighbors import KNeighborsClassifier
kn = KNeighborsClassifier()
kn.fit( train_input, train_target )
kn.score( test_input, test_target )
kn.predict( test_input )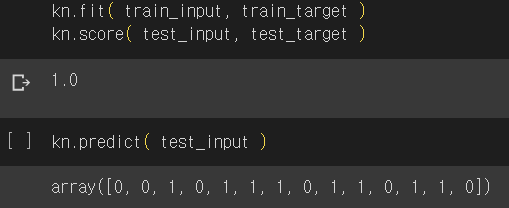
02-2 데이터 전처리
넘파이로 데이터 준비하기
- np.column_stack(): 주어진 두 배열의 각 element를 한 배열로 만들어서 각 배열을 2차원 배열의 행으로 쌓아준다.
- np.concatenate():
- sklearn.model_selection.train_test_split(input_data, target, startify = target, seed = n)
: 주어진 데이터에 대해 75%는 train, 25%는 test로 나눠준다.
stratify는 샘플링 편향을 극복하기 위한 메소드. 입력 받은 배열 값이 대해 train, test에 적절히 섞이도록한다.
seed는 랜덤 시드 값
데이터 표준화하기
이전 모델의 한계: x, y의 scale이 달라서 거리 측정에 문제가 있다.
해결방법: scaling/표준화
예시:
위와 같은 데이터가 주어지고, 주황색 세모 데이터의 분류를 맞추려 할 때,
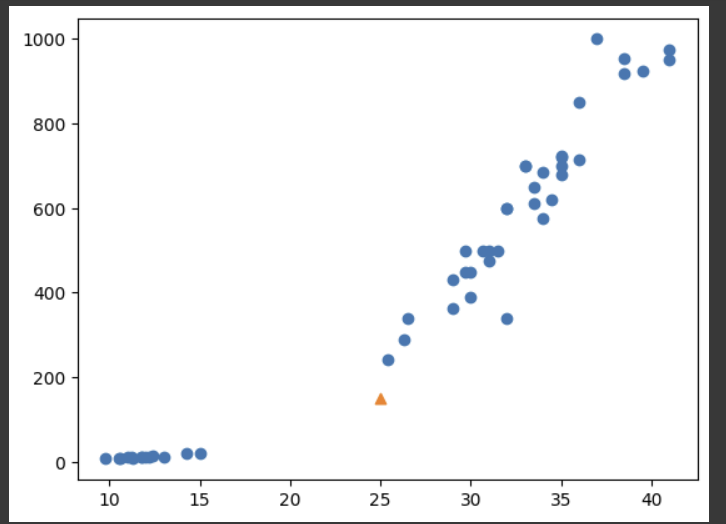
이때 반영되는 kneighbors는 아래와 같다.
plt.scatter(fish_data[:,0], fish_data[:, 1])
plt.scatter(25, 150, marker = '^')
plt.scatter(train_input[indexes, 0], train_input[indexes, 1], marker = 'D')
plt.show()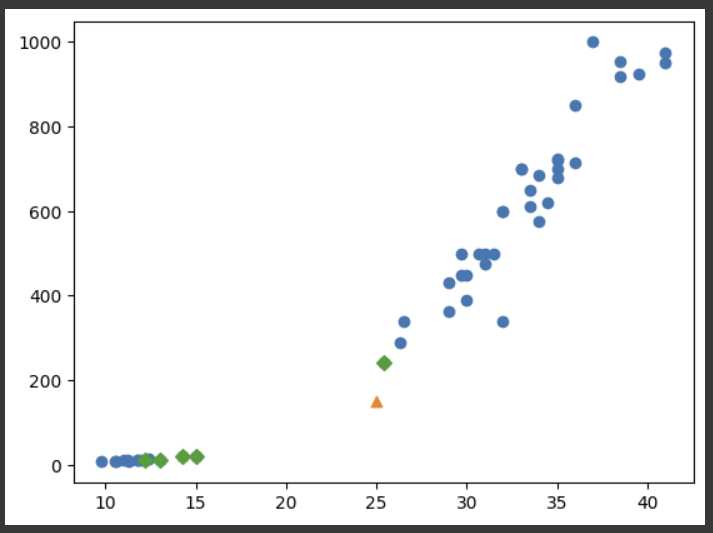
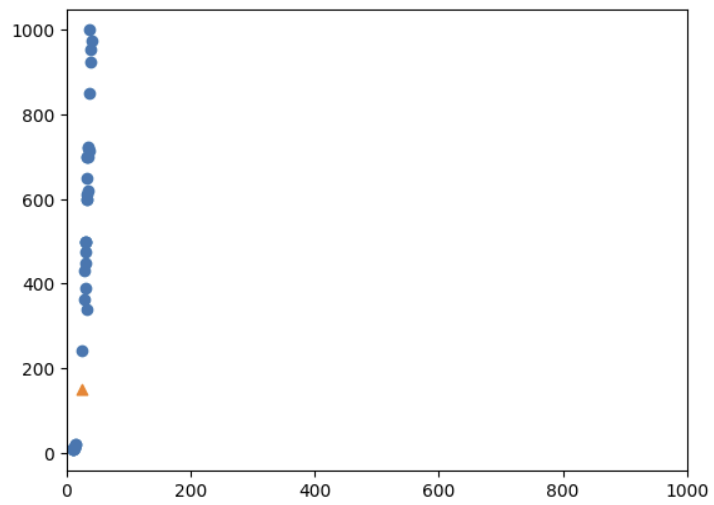
x축의 범위를 y와 같게 할 경우, 아래와 그래프를 볼 수 있다. 즉, 위와 같은 그래프와 달리 실제로 측정되는 거리는 아래와 같고, 이는 y축 값에 의해 거리가 거의 결정된다는 것이다.
plt.scatter(train_input[:,0], train_input[:, 1])
plt.scatter(25, 150, marker = '^')
#x축의 범위를 조정한다
plt.xlim((0,1000))
plt.show()- xlim: x축의 범위를 조정한다.
알고리즘이 거리 기반일 때는 더 표준화가 중요해진다.
#train data scaling
mean = np.mean(train_input, axis = 0)
std = np.std(train_input, axis = 0)
scaled_train_input = (train_input - mean)/std

#new test data scaling
new_test_input = [[25, 150]]
new_scaled_test_input = ( new_test_input - mean )/std

#train the model with scaled train input
kn.fit(scaled_train_input, train_target)
kn.predict(new_scaled_test_input)

#get distances and indexes that used to predict new test data
distances, indexes = kn.kneighbors(new_scaled_test_input)

#test data scaling
scaled_test_input = (test_input-mean)/std
kn.score(scaled_test_input, test_target)
#scored 1.0

plt.scatter(scaled_train_input[:,0], scaled_train_input[:,1])
plt.scatter(new_scaled_test_input[:,0], new_scaled_test_input[:,1], marker = '^')
plt.scatter(scaled_train_input[indexes,0], scaled_train_input[indexes,1], marker = 'D')
plt.show()- kneighbors(test data): test data를 계산 할 때 사용된 indexes와 각 index와 test data 간의 distances를 반환한다. 반환 값은 2차원 배열
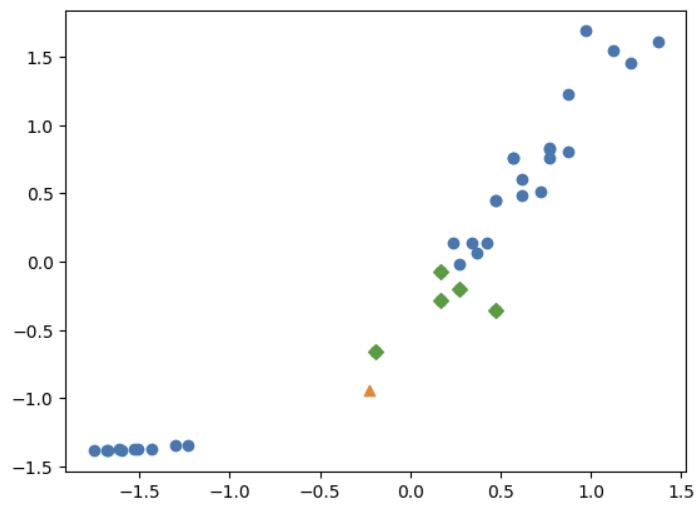
표준화 결과 위와 같은 결과를 얻고, 아까 예측에 실패했던 데이터, [[25,150]]을 정확하게 예측할 수 있게 된다.
기타
심화 공부
- 훈련, 테스트 세트로 나눈 도미, 빙어 데이터를 matplotlib을 이용해 따로 출력하는 프로그램
#심화 공부
train_bream_index = []
train_smelt_index = []
for i in index[:35]:
  if target_arr[i] == 1:
      train_bream_index.append(i)
  else :
    train_smelt_index.append(i)

test_bream_index = []
test_smelt_index = []
for i in index[35:]:
  if target_arr[i] == 1:
      test_bream_index.append(i)
  else :
    test_smelt_index.append(i)

train_bream = input_arr[train_bream_index]
train_smelt = input_arr[train_smelt_index]
test_bream = input_arr[test_bream_index]
test_smelt = input_arr[test_smelt_index]
print(train_bream)
plt.scatter(train_bream[:,0], train_bream[:,1])
plt.scatter(train_smelt[:,0], train_smelt[:,1])
plt.scatter(test_bream[:,0], test_bream[:,1])
plt.scatter(test_smelt[:,0], test_smelt[:,1])
plt.show()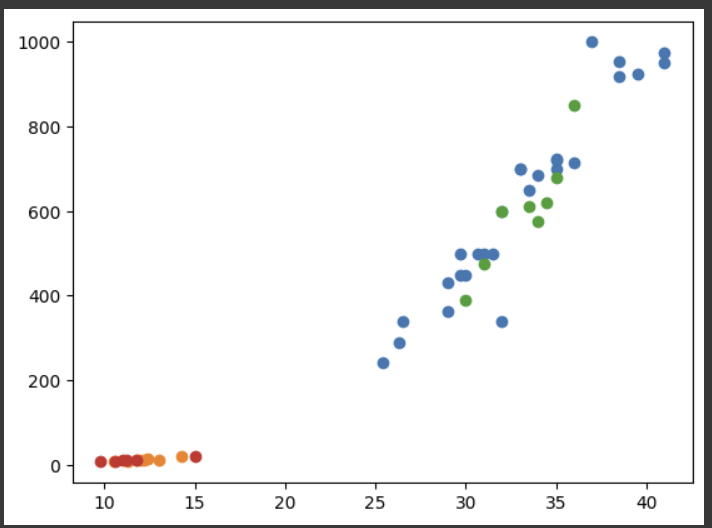

그냥 사람