Precision(정밀도) and Recall(재현율)
1) 데이터 가져오기
import pandas as pd
wine_url = 'https://raw.githubusercontent.com/PinkWink/ML_tutorial/master/dataset/wine.csv'
wine = pd.read_csv(wine_url,index_col=0)
wine.head()
2) 맛 등급 설정
# (1) quality 컬럼 이진화
# wine 데이터의 ['taste'] 컬럼 생성
# wine의 quality column울 grade로 잡고, 5등급 보다 크면 1, 그게 아니라면 0으로 잡음
wine['taste'] = [1. if grade>5 else 0. for grade in wine['quality']]
# (2) 모델링
# label인 taste, quality를 drop, 나머지를 X의 특성으로 봄
X = wine.drop(['taste', 'quality'], axis=1)
# 새로만들 y데이터
y = wine['taste']
3) 데이터 분리
from sklearn.model_selection import train_test_split
X_train, X_test, y_train, y_test = train_test_split(X, y, test_size=0.2, random_state=13)
4) 로지스틱 회귀
from sklearn.linear_model import LogisticRegression
from sklearn.metrics import accuracy_score

lr = LogisticRegression(solver='liblinear', random_state=13)
lr.fit(X_train, y_train)

y_pred_tr = lr.predict(X_train)
y_pred_test = lr.predict(X_test)

print('Train Acc : ', accuracy_score(y_train, y_pred_tr))
print('Test Acc : ', accuracy_score(y_test, y_pred_test))
Train Acc : 0.7429286126611506
Test Acc : 0.7446153846153846
5) classification report
from sklearn.metrics import classification_report
print(classification_report(y_test, lr.predict(X_test)))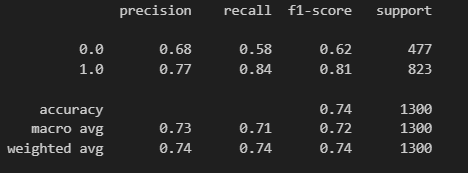
6) confusion matrix
from sklearn.metrics import confusion_matrix
confusion_matrix(y_test, lr.predict(X_test))
array( [ [ 275, 202 ] , [ 130, 693 ] ] , dtype=int64 )
- 0라인 | 0이라고 한 갯수, 1이라고 한 갯수 : [275,202]
- 1라인 | 0이라고 한 갯수, 1이라고 한 갯수 : [130,693]
7) precision_recall curve
import matplotlib.pyplot as plt
from sklearn.metrics import precision_recall_curve

# predict_proba : class 별 확률을 구해주기 떄문에 1일 때 확률을 가져옴
pred = lr.predict_proba(X_test)[:, 1]
precisions, recalls, thresholds = precision_recall_curve(y_test, pred)

plt.figure(figsize=(6, 3))
# thresholds를 기준으로, precisions그래프를 그림
# :len(thresholds) : thresholds의 크기 만큼 그리겠다
plt.plot(thresholds, precisions[:len(thresholds)], label='precision')
plt.plot(thresholds, recalls[:len(thresholds)], label='recall')
plt.grid()
plt.legend()
plt.show()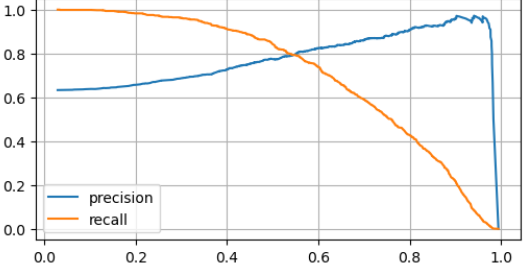
8) threshlod = 0.5
- threshlod 값을 따로 정해주지 않으면 0.5가 디폴트값 임
# lr(분류기)에서 predict_proba를 X_test에 대해서 해라
pred_proba = lr.predict_proba(X_test)
# 앞부분 3개만 보고싶음
pred_proba[:3]
array
([[0.40472417, 0.59527583],
[0.51002386, 0.48997614],
[0.10222708, 0.89777292]])
9) 간단히 확인해보기
- 1_ y_pred_test을 pred_proba 옆으로 붙인 데이터를 만들고 싶음
- 2_그래서 reshape을 통해 y_pred_test 먼저 틀을 만들어 줌 (리스트 안 리스트)
- .reshape(-1,1) : reshape(니가 알아서해, 마지막만 1로 만들어줘)
- 3_ np.concatenate을 이용해 둘을 붙여 줌
import numpy as np

np.concatenate([pred_proba, y_pred_test.reshape(-1,1)], axis=1)
10) Binarizer
threshold를 사용자의 지정을 받아서 0과 1을 바꿔주는 명령어
from sklearn.preprocessing import Binarizer
binarizer = Binarizer(threshold=0.6).fit(pred_proba)
pred_bin = binarizer.transform(pred_proba)[:,1]
pred_bin
array([0., 0., 1., ..., 1., 0., 1.])
11) 다시 classification report
from sklearn.metrics import classification_report
print(classification_report(y_test, pred_bin))
11) 다시 classification report
from sklearn.metrics import classification_report
print(classification_report(y_test, pred_bin))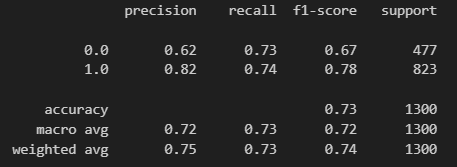

비전공자의 데이터 공부법