k means 클러스터링을 알아보겠습니다.
k means 클러스터링은 비지도학습 상황에서 사용하기 좋습니다. k-means 알고리즘은 k값이 있을 때, 주어진 데이터들을 k개의 클러스터로 묶은 알고리즘입니다.
데이터를 일단 만들어보겠습니다.
from sklearn.datasets import make_blobs
import pandas as pd
import numpy as np
import matplotlib.pyplot as plt
import random

# 중심점이 5개인 100개의 점 데이터를 무작위로 생성
points, labels = make_blobs(n_samples=100, centers=5, n_features=2, random_state=135)

print(labels.shape, labels[:10])    # 10개의 점들이 각각 대응하는 중심점(label) 값 출력
(100,) [2 1 0 3 3 1 0 0 1 2]
비지도학습은 라벨이 사실 없습니다. 우리가 지정해준 라벨은 임의로 지정한 k개의 중심점이 새로운 label이라고 생가하면 됩니다.
# 축
fig = plt.figure()
ax = fig.add_subplot(1, 1, 1)

# 점들을 데이터 프레임 형테로 저장
points_df = pd.DataFrame(points, columns=['X', 'Y'])
display(points_df.head())

# 점 데이터를 X-Y grid에 시각화하기
ax.scatter(points[:, 0], points[:, 1], c='black', label='random generated data')


ax.set_xlabel('X') #x축 라벨
ax.set_ylabel('Y')#y축 라벨
ax.legend()
ax.grid()
X Y
0 4.634119 -6.525904
1 -6.520086 7.166243
2 2.141423 -5.210926
3 1.700542 8.540779
4 -0.338092 8.765097
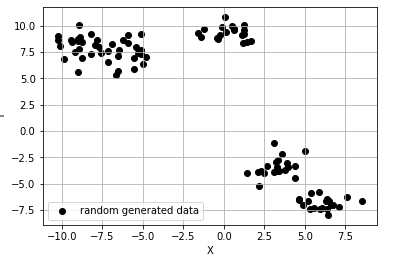
그래프를 보면 딱봐도 4개나 5개의 군집을 할 수 있을 것 같이 보입니다! kmeans는 이런 상황에 강력합니다. 왜 강력할 까요!
k means는
- k개의 수를 정합니다 (군집을 몇개 할지)
- 그러기 위해선 시각화로 먼저 확인해보는 것도 좋겠죠? - k개의 중심점을 랜덤으로 선택하고 각각 가까운 거리를 유클리드로 계산합니다.
- 가까우면 서로의 클러스터에 속하게 됩니다. 하지만 처음엔 랜덤으로 찍었기 때문에 점들과의 거리가 가까운 지점이 더 있을 것 입니다. 각 클러스터에 속하는 모든 점들의 평균점으로 중심점을 이동하게 되어 다시 계산이 됩니다.
- 이런식으로 반복을 하여 최적의 중심점에 도달합니다.
from sklearn.cluster import KMeans

# 1), 2) 위에서 생성한 무작위 점 데이터(points)에 클러스터의 수(K)가 5인 K-means 알고리즘을 적용
kmeans_cluster = KMeans(n_clusters=5)

# 3) ~ 6) 과정이 전부 함축되어 있는 코드입니다. points에 대하여 K가 5일 때의 K-means iteration을 수행
kmeans_cluster.fit(points)

print(type(kmeans_cluster.labels_))
print(np.shape(kmeans_cluster.labels_))
print(np.unique(kmeans_cluster.labels_))
<class 'numpy.ndarray'>
(100,)
[0 1 2 3 4]
# n 번째 클러스터 데이터를 어떤 색으로 도식할 지 결정하는 color dictionary
color_dict = {0: 'red', 1: 'blue', 2:'green', 3:'brown', 4:'indigo'}

# 점 데이터를 X-Y grid에 시각화합니다.
fig = plt.figure()
ax = fig.add_subplot(1, 1, 1)

# K-means clustering의 결과대로 색깔별로 구분하여 점에 색칠한 후 도식
for cluster in range(5):
    cluster_sub_points = points[kmeans_cluster.labels_ == cluster] # 전체 무작위 점 데이터에서 K-means 알고리즘에 의해 군집화된 sub data를 분리합니다.
    ax.scatter(cluster_sub_points[:, 0], cluster_sub_points[:, 1], c=color_dict[cluster], label='cluster_{}'.format(cluster)) # 해당 sub data를 plot합니다.

# 축 이름을 라벨에 달고, 점 데이터 그리기
ax.set_xlabel('X')
ax.set_ylabel('Y')
ax.legend()
ax.grid()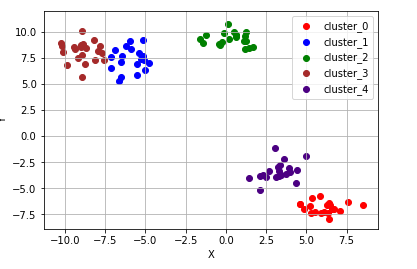
5개로 클러스터를 해보니까 잘 분리가 된 것 같습니다. 이런 상황에서는 정말 잘 수행해줍니다. 하지만 단점이 있겠죠.. 저렇게 오순도순이 아니라 선모양의 점들이라면 어떨까요? 3개의 예시를 보겠습니다.
# 원형 분포
from sklearn.datasets import make_circles

# 데이터 생성
circle_points, circle_labels = make_circles(n_samples=100, factor=0.5, noise=0.01) # 원형 분포를 가지는 점 데이터 100개를 생성합니다.

# 캔버스 생성
fig = plt.figure()
ax = fig.add_subplot(1, 1, 1)

# K-means 수행
circle_kmeans = KMeans(n_clusters=2)
circle_kmeans.fit(circle_points)
color_dict = {0: 'red', 1: 'blue'}
for cluster in range(2):
    cluster_sub_points = circle_points[circle_kmeans.labels_ == cluster]
    ax.scatter(cluster_sub_points[:, 0], cluster_sub_points[:, 1], c=color_dict[cluster], label='cluster_{}'.format(cluster))
ax.set_title('K-means on circle data, K=2')
ax.set_xlabel('X')
ax.set_ylabel('Y')
ax.legend()
ax.grid()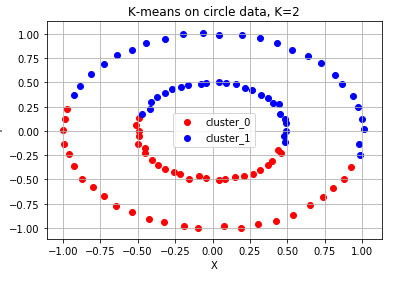
#달 모양 분포
from sklearn.datasets import make_moons

# 데이터 생성
moon_points, moon_labels = make_moons(n_samples=100, noise=0.01) # 달 모양 분포를 가지는 점 데이터 100개를 생성합니다.

# 캔버스 생성
fig = plt.figure()
ax = fig.add_subplot(1, 1, 1)

# 달 모양 분포 데이터 plot
moon_kmeans = KMeans(n_clusters=2)
moon_kmeans.fit(moon_points)
color_dict = {0: 'red', 1: 'blue'}
for cluster in range(2):
    cluster_sub_points = moon_points[moon_kmeans.labels_ == cluster]
    ax.scatter(cluster_sub_points[:, 0], cluster_sub_points[:, 1], c=color_dict[cluster], label='cluster_{}'.format(cluster))
ax.set_title('K-means on moon-shaped data, K=2')
ax.set_xlabel('X')
ax.set_ylabel('Y')
ax.legend()
ax.grid()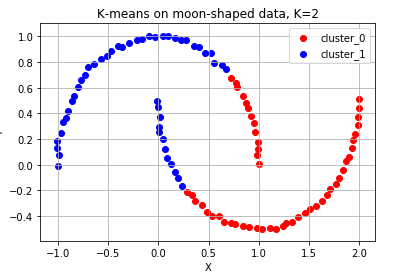
#대각선 모양 분포
from sklearn.datasets import make_circles, make_moons, make_blobs

# 데이터 생성
diag_points, _ = make_blobs(n_samples=100, random_state=170) #대각선 분포를 가지는 점 데이터 100개를 생성합니다.(현재는 무작위 분포)
transformation = [[0.6, -0.6], [-0.4, 0.8]] #대각선 변환을 위한 대각 행렬
diag_points = np.dot(diag_points, transformation) #본 과정을 통해 무작위 분포의 점 데이터를 대각선 분포로 변환합니다.

# 캔버스 생성
fig = plt.figure()
ax = fig.add_subplot(1, 1, 1)

# 대각선 모양 분포 데이터 plot
diag_kmeans = KMeans(n_clusters=3)
diag_kmeans.fit(diag_points)
color_dict = {0: 'red', 1: 'blue', 2: 'green'}
for cluster in range(3):
    cluster_sub_points = diag_points[diag_kmeans.labels_ == cluster]
    ax.scatter(cluster_sub_points[:, 0], cluster_sub_points[:, 1], c=color_dict[cluster], label='cluster_{}'.format(cluster))
ax.set_title('K-means on diagonal-shaped data, K=2')
ax.set_xlabel('X')
ax.set_ylabel('Y')
ax.legend()
ax.grid()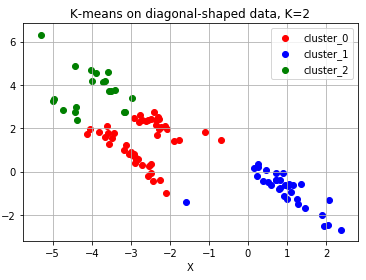
위 그래프 예시와 같이 분류가 안되는 형태가 있습니다. k개를 정하기 어려운 상황 위 예시처럼 유클리드 거리로는 분리하기 어려운 상황

인공지능 파이팅!