프로젝트를 시작하기 앞서, 짚고 넘어가야 할 점이 있다.
양질의 데이터를 갖고있다 하더라도, 그걸 분별할 수 있는 도메인 지식이 부족하다는 것.
때문에 계획했던대로 데이터로마 에서 훌륭한 투자자들이 투자한 종목을 확인하도록 한다
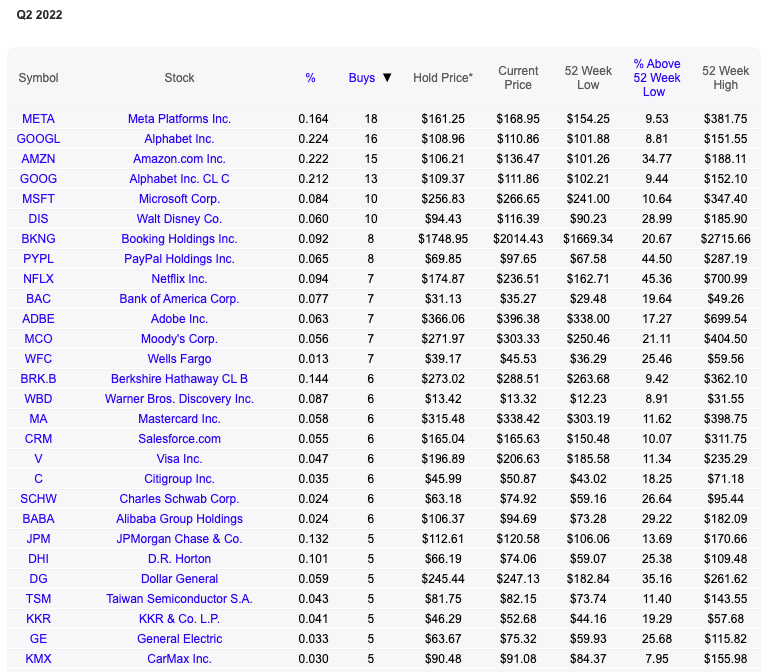
링크를 통해 들어가면, 위의 페이지를 볼 수 있다. 전체 포트폴리오에서 차지하는 비중, 지난 분기 동안 해당 주식을 구매한 투자자의 수 등 해당 종목이 얼마나 핫한지 알 수 있다.
모든 종목들을 분석할 수 없기에, 가장 많은 구매자가 있는 순서대로 몇 개만 추려내어 확인할 예정이다.
코드
module import
import requests
from bs4 import BeautifulSoup
import pandas as pd
header 작성
크롤링 작업을 할 때, 몇몇 페이지는 User-Agent 값을 요구한다.
investor_df = pd.DataFrame(columns=['symbol', 'percent_of_portfolio', 'buys', 'hold_price', 'current_price', 'lowest_price', 'highest_price'])크롤링
본 게시물은 크롤링에 대한 게시물이 아니기 때문에, 왜 혹은 어떻게 코드를 작성했는지는 작성하지 않겠다.
for i in range(1, 10):
    try:
        url = 'https://www.dataroma.com/m/g/portfolio_b.php?q=q&o=c&L={}'.format(i)
        html = requests.get(url,headers = header)
        soup = BeautifulSoup(html.text, 'html.parser')
    except:
        break
    trs = soup.select('tbody')[0].select('tr')
    if len(trs) == 0:
        break

    for i in range(0, len(trs) - 1, 1):
        symbol = trs[i].select('td')[0].text
        percent_of_portfolio = trs[i].select('td')[2].text
        stock_buys = trs[i].select('td')[3].text
        hold_price = trs[i].select('td')[4].text
        current_price = trs[i].select('td')[5].text
        lowest_price = trs[i].select('td')[6].text
        highest_price = trs[i].select('td')[8].text

        investor_df = investor_df.append({'symbol':symbol, 'percent_of_portfolio':percent_of_portfolio,'buys': stock_buys, 'hold_price': hold_price,'current_price':current_price, 'lowest_price':lowest_price, 'highest_price':highest_price},ignore_index=True)
개발자 도구를 열어 원하는 태그와 클래스 명만 있으면 페이지 안의 어떤 데이터든 긁어올 수 있다
데이터 저장
investor_df.to_parquet('investor.parquet', engine='pyarrow',compression='snappy')플랫폼에서 사용할 데이터는 아니기 때문에 그냥 로컬에 저장해서 꺼내 쓴다

데이터 엔지니어로 전향중인 백엔드 개발자입니다