요약
이번 4주차 주제는 Observability이다. 이번 실습에서는 AWS에서 기본적으로 제공해주는 기능과 프로메테우스, 그라파나 등을 직접 배포해보며 학습했다. 순서는 AWS에서 제공해주는 콘솔을 통한 로깅, CloudWatch로 시작되고 Metrics-server, kwatch 등 다양한 툴을 실제 클러스터에 배포해본다. 이후 프로메테우스와 그라파나와 같은 대표적인 모니터링 툴을 사용해보며 마무리된다.
핵심용어
- observability
IT 및 클라우드 컴퓨팅에서 통합 가시성이란 로그, 메트릭, 추적과 같이 시스템이 생성하는 데이터를 기반으로 시스템의 현재 상태를 측정하는 기능!
Logging 어떤일 , Metrics 어떤지표 , Tracing 왜? 분석
- 메트릭 시스템이란?
먼저, 메트릭에 대해 알아보면 숫자 측정값으로 모니터링하는 데 주로 사용한다. 메트릭 시스템이란 목표대상의 상태를 수집하고 관리, 모니터링하는 시스템이다.
배포환경
프로메테우스, 그라파나 등 이번에는 리소스를 많이 쓰는 툴을 사용하므로 노드의 인스턴스 사양이 기존과 달라졌다. 이번에는 t3.xlarge 을 인스턴스 사양을 사용한다. 가시다님이 AWS CloudFormation 파일을 준비해주셨다.
3주차에서 진행했던 것과 같이, 기본 설정을 진행해야 한다. 그 중 LB & External DNS 을 진행하지 않으면 이번 실습 중 안되는 것이 있으니 꼭 진행해야 한다. 3주차 링크
추가적으로 SSL인증서 발급이 필요하다. 관련된 내용은 Logging 파트에서 확인할 수 있다.
EKS Console
쿠버네티스 API를 통해서 리소스 및 정보를 확인 할 수 있습니다. 관련된 시스템을 AWS에서 지속적으로 관리 및 업데이트를 한다고 한다.
AWS Workshop에서 자세하게 확인할 수 있다.
Logging
AWS EKS에서 다양한 로깅과 모니터링도 제공한다. AWS에서 컨트롤 플레인을 제어하기에 접근할 수 없지만, 로그는 확인할 수 있다. AWS Docs에서 자세한 내용을 확인할 수 있다.
또, audit log가 전체 스트림의 90프로 이상을 차지 하기 때문에 활성화할 때 비용관점에서 유의하시는게 좋다고 한다.
aws cli를 통해 클러스터의 로깅옵션을 아래와 같이 설정시키면 로그를 AWS 콘솔에서 확인할 수 있다.
$aws eks **update-cluster-config** --region $AWS_DEFAULT_REGION --name $CLUSTER_NAME \
    --logging '{"clusterLogging":[{"types":["**api**","**audit**","**authenticator**","**controllerManager**","**scheduler**"],"enabled":**true**}]}'
API서버가 메트릭을 노출하는 엔드포인트 AWS Blog → 생략
# 아래의 명령어를 통해 반환하는 엔드포인트는 API서버가 메트릭을 노출하는 엔드포인트
$kubectl get --raw /metrics | grep "etcd_db_total_size_in_bytes"
아래는 관련된 로그를 직접 확인해보는 명령어이다.
# 로그 스트림
$aws logs tail /aws/eks/$CLUSTER_NAME/cluster --log-stream-name-prefix kube-controller-manager --follow
$kubectl scale deployment -n kube-system coredns --replicas=1
deployment.apps/coredns scaled
$kubectl scale deployment -n kube-system coredns --replicas=2
deployment.apps/coredns scaled
# 로그 스트림 확인
$aws logs tail /aws/eks/$CLUSTER_NAME/cluster --log-stream-name-prefix kube-controller-manager --follow
2023-05-17T10:37:01.000000+00:00 kube-controller-manager-03d7b752d418a3019486688cc6ced1a5 I0517 10:37:01.356908      10 replica_set.go:613] "Too many replicas" replicaSet="kube-system/coredns-6777fcd775" need=1 deleting=1
2023-05-17T10:37:01.000000+00:00 kube-controller-manager-03d7b752d418a3019486688cc6ced1a5 I0517 10:37:01.356955      10 replica_set.go:241] "Found related ReplicaSets" replicaSet="kube-system/coredns-6777fcd775" relatedReplicaSets=[kube-system/coredns-dc4979556 kube-system/coredns-6777fcd775]
2023-05-17T10:37:01.000000+00:00 kube-controller-manager-03d7b752d418a3019486688cc6ced1a5 I0517 10:37:01.357037      10 controller_utils.go:592] "Deleting pod" controller="coredns-6777fcd775" pod="kube-system/coredns-6777fcd775-k9ksb"
2023-05-17T10:37:01.000000+00:00 kube-controller-manager-03d7b752d418a3019486688cc6ced1a5 I0517 10:37:01.357138      10 event.go:294] "Event occurred" object="kube-system/coredns" fieldPath="" kind="Deployment" apiVersion="apps/v1" type="Normal" reason="ScalingReplicaSet" message="Scaled down replica set coredns-6777fcd775 to 1"
2023-05-17T10:37:01.000000+00:00 kube-controller-manager-03d7b752d418a3019486688cc6ced1a5 I0517 10:37:01.407444      10 event.go:294] "Event occurred" object="kube-system/coredns-6777fcd775" fieldPath="" kind="ReplicaSet" apiVersion="apps/v1" type="Normal" reason="SuccessfulDelete" message="Deleted pod: coredns-6777fcd775-k9ksb"
$eksctl utils update-cluster-logging --cluster $CLUSTER_NAME --region $AWS_DEFAULT_REGI --disable-types all --approve
2023-05-17 19:37:40 [ℹ]  will update CloudWatch logging for cluster "myeks" in "ap-northeast-2" (no types to enable & disable types: api, audit, authenticator, controllerManager, scheduler)
2023-05-17 19:38:12 [✔]  configured CloudWatch logging for cluster "myeks" in "ap-northeast-2" (no types enabled & disabled types: api, audit, authenticator, controllerManager, scheduler)
Control Plane metrics with Prometheus & CW Logs Insights 쿼리 - Docs
아래의 명령어를 통해 다양한 metrics를 확인할 수 있다. 로그를 필터링 하고 싶으면, Logs insights을 사용한다.
$kubectl get --raw /metrics | more
# HELP aggregator_openapi_v2_regeneration_count [ALPHA] Counter of OpenAPI v2 spec regeneration count broken down by causing APIServi
ce name and reason.
# TYPE aggregator_openapi_v2_regeneration_count counter
aggregator_openapi_v2_regeneration_count{apiservice="*",reason="startup"} 0
aggregator_openapi_v2_regeneration_count{apiservice="k8s_internal_local_delegation_chain_0000000002",reason="update"} 0
# HELP aggregator_openapi_v2_regeneration_duration [ALPHA] Gauge of OpenAPI v2 spec regeneration duration in seconds.
# TYPE aggregator_openapi_v2_regeneration_duration gauge
aggregator_openapi_v2_regeneration_duration{reason="startup"} 0.064469015
aggregator_openapi_v2_regeneration_duration{reason="update"} 0.022995886
# HELP aggregator_unavailable_apiservice [ALPHA] Gauge of APIServices which are marked as unavailable broken down by APIService name.
# TYPE aggregator_unavailable_apiservice gauge
aggregator_unavailable_apiservice{name="v1."} 0
aggregator_unavailable_apiservice{name="v1.admissionregistration.k8s.io"} 0
aggregator_unavailable_apiservice{name="v1.apiextensions.k8s.io"} 0
aggregator_unavailable_apiservice{name="v1.apps"} 0
aggregator_unavailable_apiservice{name="v1.authentication.k8s.io"} 0
aggregator_unavailable_apiservice{name="v1.authorization.k8s.io"} 0
aggregator_unavailable_apiservice{name="v1.autoscaling"} 0
aggregator_unavailable_apiservice{name="v1.batch"} 0
aggregator_unavailable_apiservice{name="v1.certificates.k8s.io"} 0
aggregator_unavailable_apiservice{name="v1.coordination.k8s.io"} 0
aggregator_unavailable_apiservice{name="v1.discovery.k8s.io"} 0
aggregator_unavailable_apiservice{name="v1.events.k8s.io"} 0
aggregator_unavailable_apiservice{name="v1.networking.k8s.io"} 0
aggregator_unavailable_apiservice{name="v1.node.k8s.io"} 0
aggregator_unavailable_apiservice{name="v1.policy"} 0
aggregator_unavailable_apiservice{name="v1.rbac.authorization.k8s.io"} 0

$kubectl get --raw /metrics | grep "etcd_db_total_size_in_bytes"
# HELP etcd_db_total_size_in_bytes [ALPHA] Total size of the etcd database file physically allocated in bytes.
# TYPE etcd_db_total_size_in_bytes gauge
etcd_db_total_size_in_bytes{endpoint="http://10.0.160.16:2379"} 4.337664e+06
etcd_db_total_size_in_bytes{endpoint="http://10.0.32.16:2379"} 4.374528e+06
etcd_db_total_size_in_bytes{endpoint="http://10.0.96.16:2379"} 4.370432e+06

$kubectl get --raw=/metrics | grep apiserver_storage_objects |awk '$2>100' |sort -g -k 2
# HELP apiserver_storage_objects [STABLE] Number of stored objects at the time of last check split by kind.
# TYPE apiserver_storage_objects gauge
apiserver_storage_objects{resource="events"} 246


$kubectl get --raw=/metrics | grep apiserver_storage_objects |awk '$2>100' |sort -g -k 2
# HELP apiserver_storage_objects [STABLE] Number of stored objects at the time of last check split by kind.
# TYPE apiserver_storage_objects gauge
apiserver_storage_objects{resource="events"} 246

$kubectl get --raw=/metrics | grep apiserver_storage_objects |awk '$2>50' |sort -g -k 2
# HELP apiserver_storage_objects [STABLE] Number of stored objects at the time of last check split by kind.
# TYPE apiserver_storage_objects gauge
apiserver_storage_objects{resource="clusterrolebindings.rbac.authorization.k8s.io"} 72
apiserver_storage_objects{resource="clusterroles.rbac.authorization.k8s.io"} 86
apiserver_storage_objects{resource="events"} 246
아래의 실습을 진행하기 위한 선수작업으로 SSL인증서 발급이 필요하다.(SSL 인증서 발급이 필요하다)
CERT_ARN=$(aws acm list-certificates --query 'CertificateSummaryList[].CertificateArn[]' --output text) echo $CERT_ARN
AWS Certificate Manager에서 인증서를 발급하면 된다. 나는 DNS 인증방식을 택했고, 인증서를 클릭하여 세부정보를 본 뒤, Route53에서 레코드 생성을 누르면 된다.
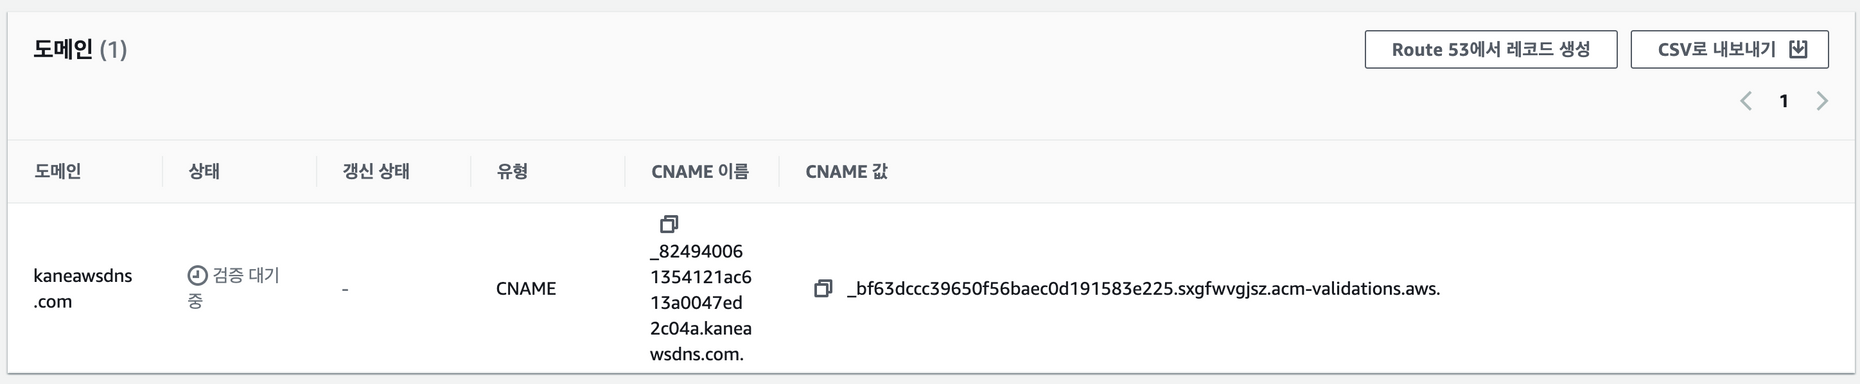
하지만, 시간이 오래걸려 나는 이메일인증방식으로 바꿨다. 그러면 aws와 연결된 이메일로 인증메일이 온다.
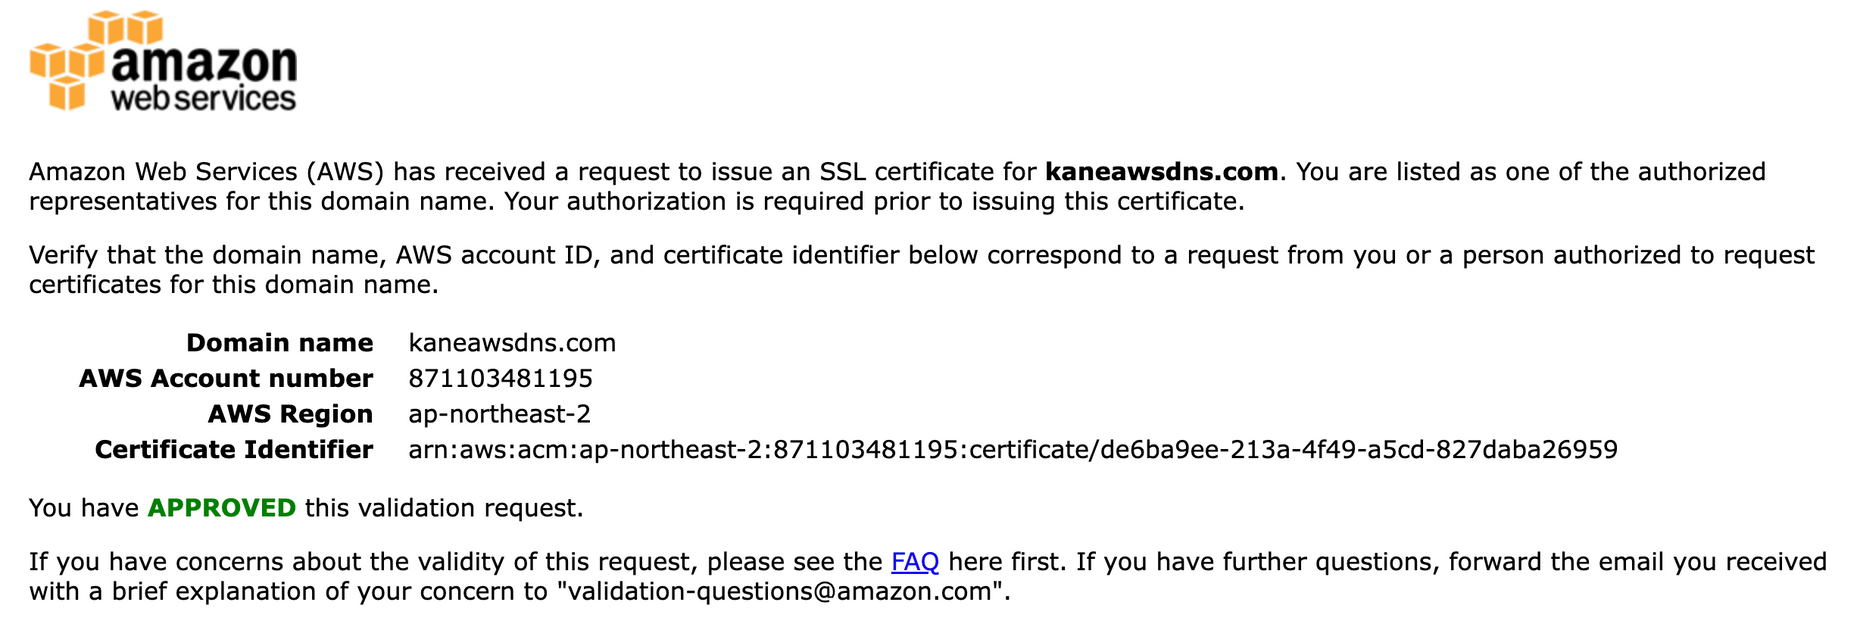
수락하면, 바로 인증이 완료된다.
스터디원 중에 감사하게, 관련 명령어를 정리해주신 분이 있다. 터미널을 통해 아래와 같이 진행할 수 있다.
ACM 인증서 명령어 # CloudWatch Log Insight Query
aws logs get-query-results --query-id $(aws logs start-query \
--log-group-name '/aws/eks/myeks/cluster' \
--start-time `date -d "-1 hours" +%s` \
--end-time `date +%s` \
--query-string 'fields @timestamp, @message | filter @logStream ~= "kube-scheduler" | sort @timestamp desc' \
| jq --raw-output '.queryId')
# ACM 퍼블릭 인증서 요청
CERT_ARN=$(aws acm request-certificate \
--domain-name $MyDomain \
--validation-method 'DNS' \
--key-algorithm 'RSA_2048' \
|jq --raw-output '.CertificateArn')
# 생성한 인증서 CNAME 이름 가져오기
CnameName=$(aws acm describe-certificate \
--certificate-arn $CERT_ARN \
--query 'Certificate.DomainValidationOptions[*].ResourceRecord.Name' \
--output text)
# 생성한 인증서 CNAME 값 가져오기
CnameValue=$(aws acm describe-certificate \
--certificate-arn $CERT_ARN \
--query 'Certificate.DomainValidationOptions[*].ResourceRecord.Value' \
--output text)
# 정상 출력 확인하기
echo $CERT_ARN, $CnameName, $CnameValue
# 레코드 파일
cat <<EOT > cname.json
{
"Comment": "create a acm's CNAME record",
"Changes": [
{
"Action": "CREATE",
"ResourceRecordSet": {
"Name": "CnameName",
"Type": "CNAME",
"TTL": 300,
"ResourceRecords": [
{
"Value": "CnameValue"
}
]
}
}
]
}
EOT
# CNAME 이름, 값 치환하기
sed -i "s/CnameName/$CnameName/g" cname.json
sed -i "s/CnameValue/$CnameValue/g" cname.json
cat cname.json
# Route53 레코드 생성
aws route53 change-resource-record-sets --hosted-zone-id $MyDnzHostedZoneId --change-batch file://cname.json이제 nginx를 배포해보자. 아래는 helm을 통해 nginx를 배포하는 코드이다.
# helm을 통해 배포
$helm repo add bitnami https://charts.bitnami.com/bitnami
"bitnami" has been added to your repositories
# 위에서 발급받은 인증서 사용
$CERT_ARN=$(aws acm list-certificates --query 'CertificateSummaryList[].CertificateArn[]' --output text)
$echo $CERT_ARN
arn:aws:acm:ap-northeast-2:871103481195:certificate/...
$MyDomain=kaneawsdns.com
$echo $MyDomain
kaneawsdns.com
$cat <<EOT > nginx-values.yaml
> service:
>     type: NodePort
>
> ingress:
>   enabled: true
>   ingressClassName: alb
>   hostname: nginx.$MyDomain
>   path: /*
>   annotations:
>     alb.ingress.kubernetes.io/scheme: internet-facing
>     alb.ingress.kubernetes.io/target-type: ip
>     alb.ingress.kubernetes.io/listen-ports: '[{"HTTPS":443}, {"HTTP":80}]'
>     alb.ingress.kubernetes.io/certificate-arn: $CERT_ARN
>     alb.ingress.kubernetes.io/success-codes: 200-399
>     alb.ingress.kubernetes.io/load-balancer-name: $CLUSTER_NAME-ingress-alb
>     alb.ingress.kubernetes.io/group.name: study
>     alb.ingress.kubernetes.io/ssl-redirect: '443'
> EOT

# 배포!
$helm install nginx bitnami/nginx --version 14.1.0 -f nginx-values.yaml
NAME: nginx
LAST DEPLOYED: Wed May 17 19:42:42 2023
NAMESPACE: default
STATUS: deployed
REVISION: 1
TEST SUITE: None
NOTES:
CHART NAME: nginx
CHART VERSION: 14.1.0
APP VERSION: 1.24.0
** Please be patient while the chart is being deployed **
NGINX can be accessed through the following DNS name from within your cluster:

    nginx.default.svc.cluster.local (port 80)

To access NGINX from outside the cluster, follow the steps below:

1. Get the NGINX URL and associate its hostname to your cluster external IP:

   export CLUSTER_IP=$(minikube ip) # On Minikube. Use: `kubectl cluster-info` on others K8s clusters
   echo "NGINX URL: http://nginx.kaneawsdns.com"
   echo "$CLUSTER_IP  nginx.kaneawsdns.com" | sudo tee -a /etc/hosts
이제 쿠버네티스의 리소스를 조회해보면 nginx를 확인할 수 있다.
$kubectl get ingress,deploy,svc,ep nginx
NAME                              CLASS   HOSTS                  ADDRESS   PORTS   AGE
ingress.networking.k8s.io/nginx   alb     nginx.kaneawsdns.com             80      15s

NAME                    READY   UP-TO-DATE   AVAILABLE   AGE
deployment.apps/nginx   0/1     1            0           15s

NAME            TYPE       CLUSTER-IP     EXTERNAL-IP   PORT(S)        AGE
service/nginx   NodePort   10.100.62.41   <none>        80:30847/TCP   15s

NAME              ENDPOINTS   AGE
endpoints/nginx               15s
# 로그를 남기기 위해, 웹사이트 접속시도
$while true; do curl -s https://nginx.$MyDomain -I | head -n 1; date; sleep 1; done
Wed May 17 19:46:26 KST 2023
Wed May 17 19:46:27 KST 2023
Wed May 17 19:46:28 KST 2023
Wed May 17 19:46:29 KST 2023
Wed May 17 19:46:30 KST 2023
이제 아래에서 로그를 확인해보면, 설치와 관련된 로그와 위에서 실행한 접속 관련된 로그를 확인할 수 있다.
# 관련 파드 로그
$kubectl logs deploy/nginx -f
nginx 12:13:25.20
nginx 12:13:25.21 Welcome to the Bitnami nginx container
nginx 12:13:25.21 Subscribe to project updates by watching https://github.com/bitnami/containers
nginx 12:13:25.21 Submit issues and feature requests at https://github.com/bitnami/containers/issues
nginx 12:13:25.21
nginx 12:13:25.21 INFO  ==> ** Starting NGINX setup **
nginx 12:13:25.22 INFO  ==> Validating settings in NGINX_* env vars
Generating RSA private key, 4096 bit long modulus (2 primes)
..........++++
......................++++
e is 65537 (0x010001)
Signature ok
subject=CN = example.com
Getting Private key
nginx 12:13:25.38 INFO  ==> No custom scripts in /docker-entrypoint-initdb.d
nginx 12:13:25.38 INFO  ==> Initializing NGINX
realpath: /bitnami/nginx/conf/vhosts: No such file or directory
nginx 12:13:25.40 INFO  ==> ** NGINX setup finished! **
nginx 12:13:25.41 INFO  ==> ** Starting NGINX **
...
192.168.1.72 - - [18/May/2023:12:15:37 +0000] "GET / HTTP/1.1" 200  409 "-" "ELB-HealthChecker/2.0" "-"
192.168.3.219 - - [18/May/2023:12:15:37 +0000] "GET / HTTP/1.1" 200  409 "-" "ELB-HealthChecker/2.0" "-"
192.168.2.230 - - [18/May/2023:12:15:43 +0000] "GET / HTTP/1.1" 200  409 "-" "ELB-HealthChecker/2.0" "-"
# 위에서 접속 시도한 로그
192.168.2.230 - - [18/May/2023:12:15:49 +0000] "GET / HTTP/1.1" 200  409 "-" "Mozilla/5.0 (Macintosh; Intel Mac OS X 10_15_7) AppleWebKit/537.36 (KHTML, like Gecko) Chrome/112.0.0.0 Whale/3.20.182.14 Safari/537.36" "218.235.82.74"
192.168.2.230 - - [18/May/2023:12:15:49 +0000] "GET /favicon.ico HTTP/1.1" 404  180 "https://nginx.kaneawsdns.com/" "Mozilla/5.0 (Macintosh; Intel Mac OS X 10_15_7) AppleWebKit/537.36 (KHTML, like Gecko) Chrome/112.0.0.0 Whale/3.20.182.14 Safari/537.36" "218.235.82.74"
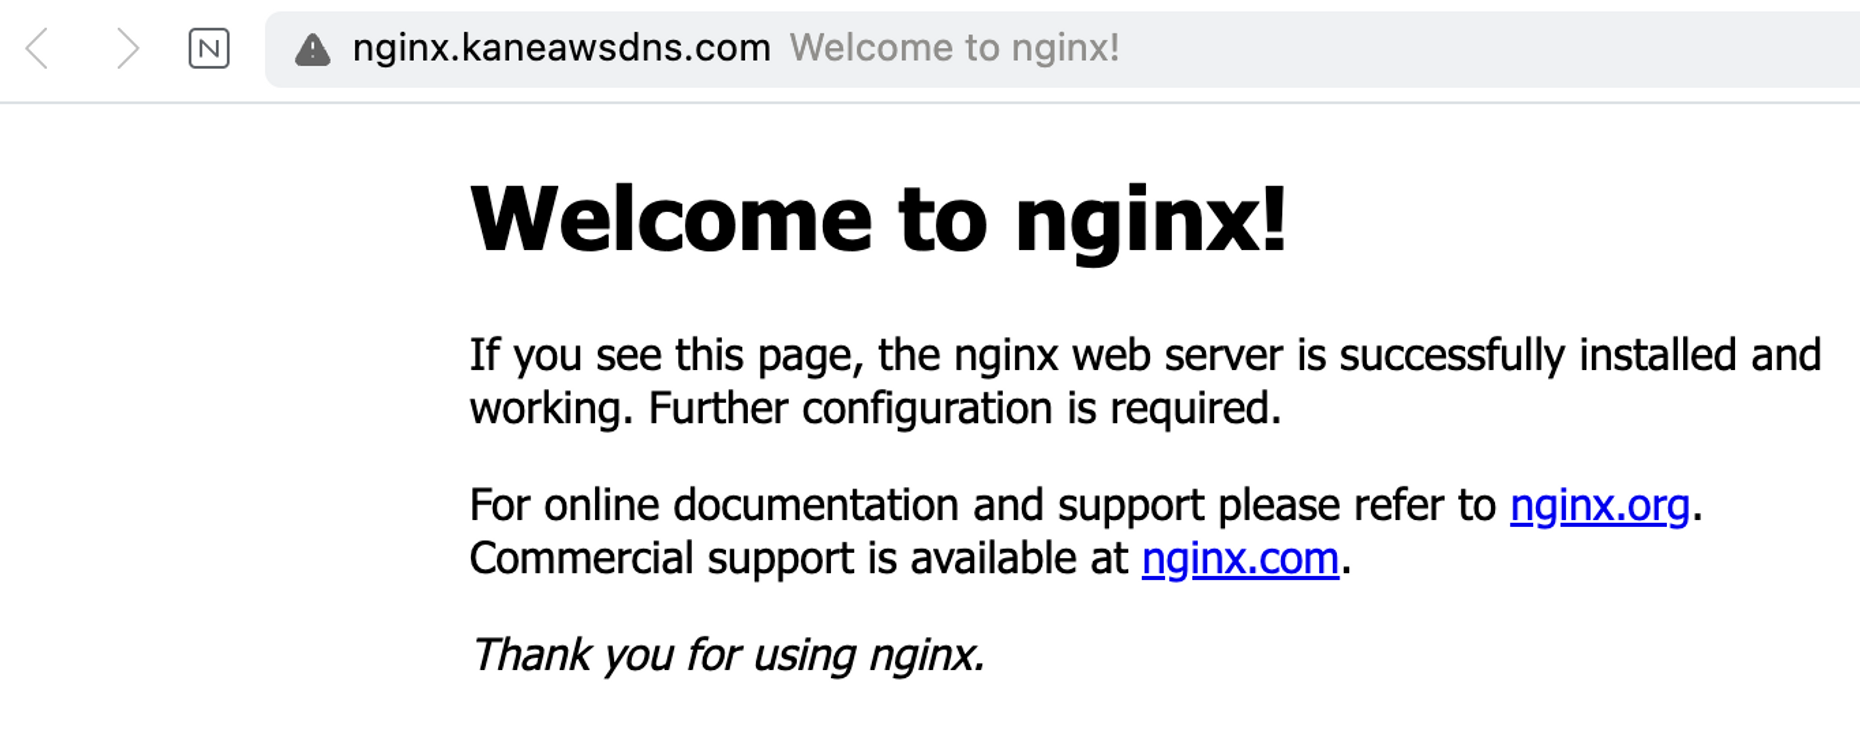
실제 도메인으로 접속한 모습
# 로그는 아래와 같이 /dev/stdout에 저장된다.
$kubectl exec -it deploy/nginx -- ls -l /opt/bitnami/nginx/logs/
total 0
lrwxrwxrwx 1 root root 11 Apr 24 10:13 access.log -> /dev/stdout
lrwxrwxrwx 1 root root 11 Apr 24 10:13 error.log -> /dev/stderr
컨테이너 로그 환경의 로그는 표준 출력 stdout과 표준 에러 stderr로 보내는 것을 권고 - 링크
위와 같이 진행하면 파드의 로그를 파드에 들어가지 않고 확인할 수 있다고 한다. 아래는 관련 도커 파일이다.
RUN ln -sf **/dev/stdout** **/opt/bitnami/nginx/logs/access.log**
RUN ln -sf **/dev/stderr** **/opt/bitnami/nginx/logs/error.log**
# forward request and error logs to docker log collector
RUN ln -sf /dev/stdout /var/log/nginx/access.log \
&& ln -sf /dev/stderr /var/log/nginx/error.log단점은 종료된 파드는 조회 불가하고, 로그파일의 크기에 한계가 있다.(로그 파일의 크기는 바꿔줄 수 있다.) 하지만, 파드의 로그는 별도의 로깅시스템을 이용해서 로깅을 한다.
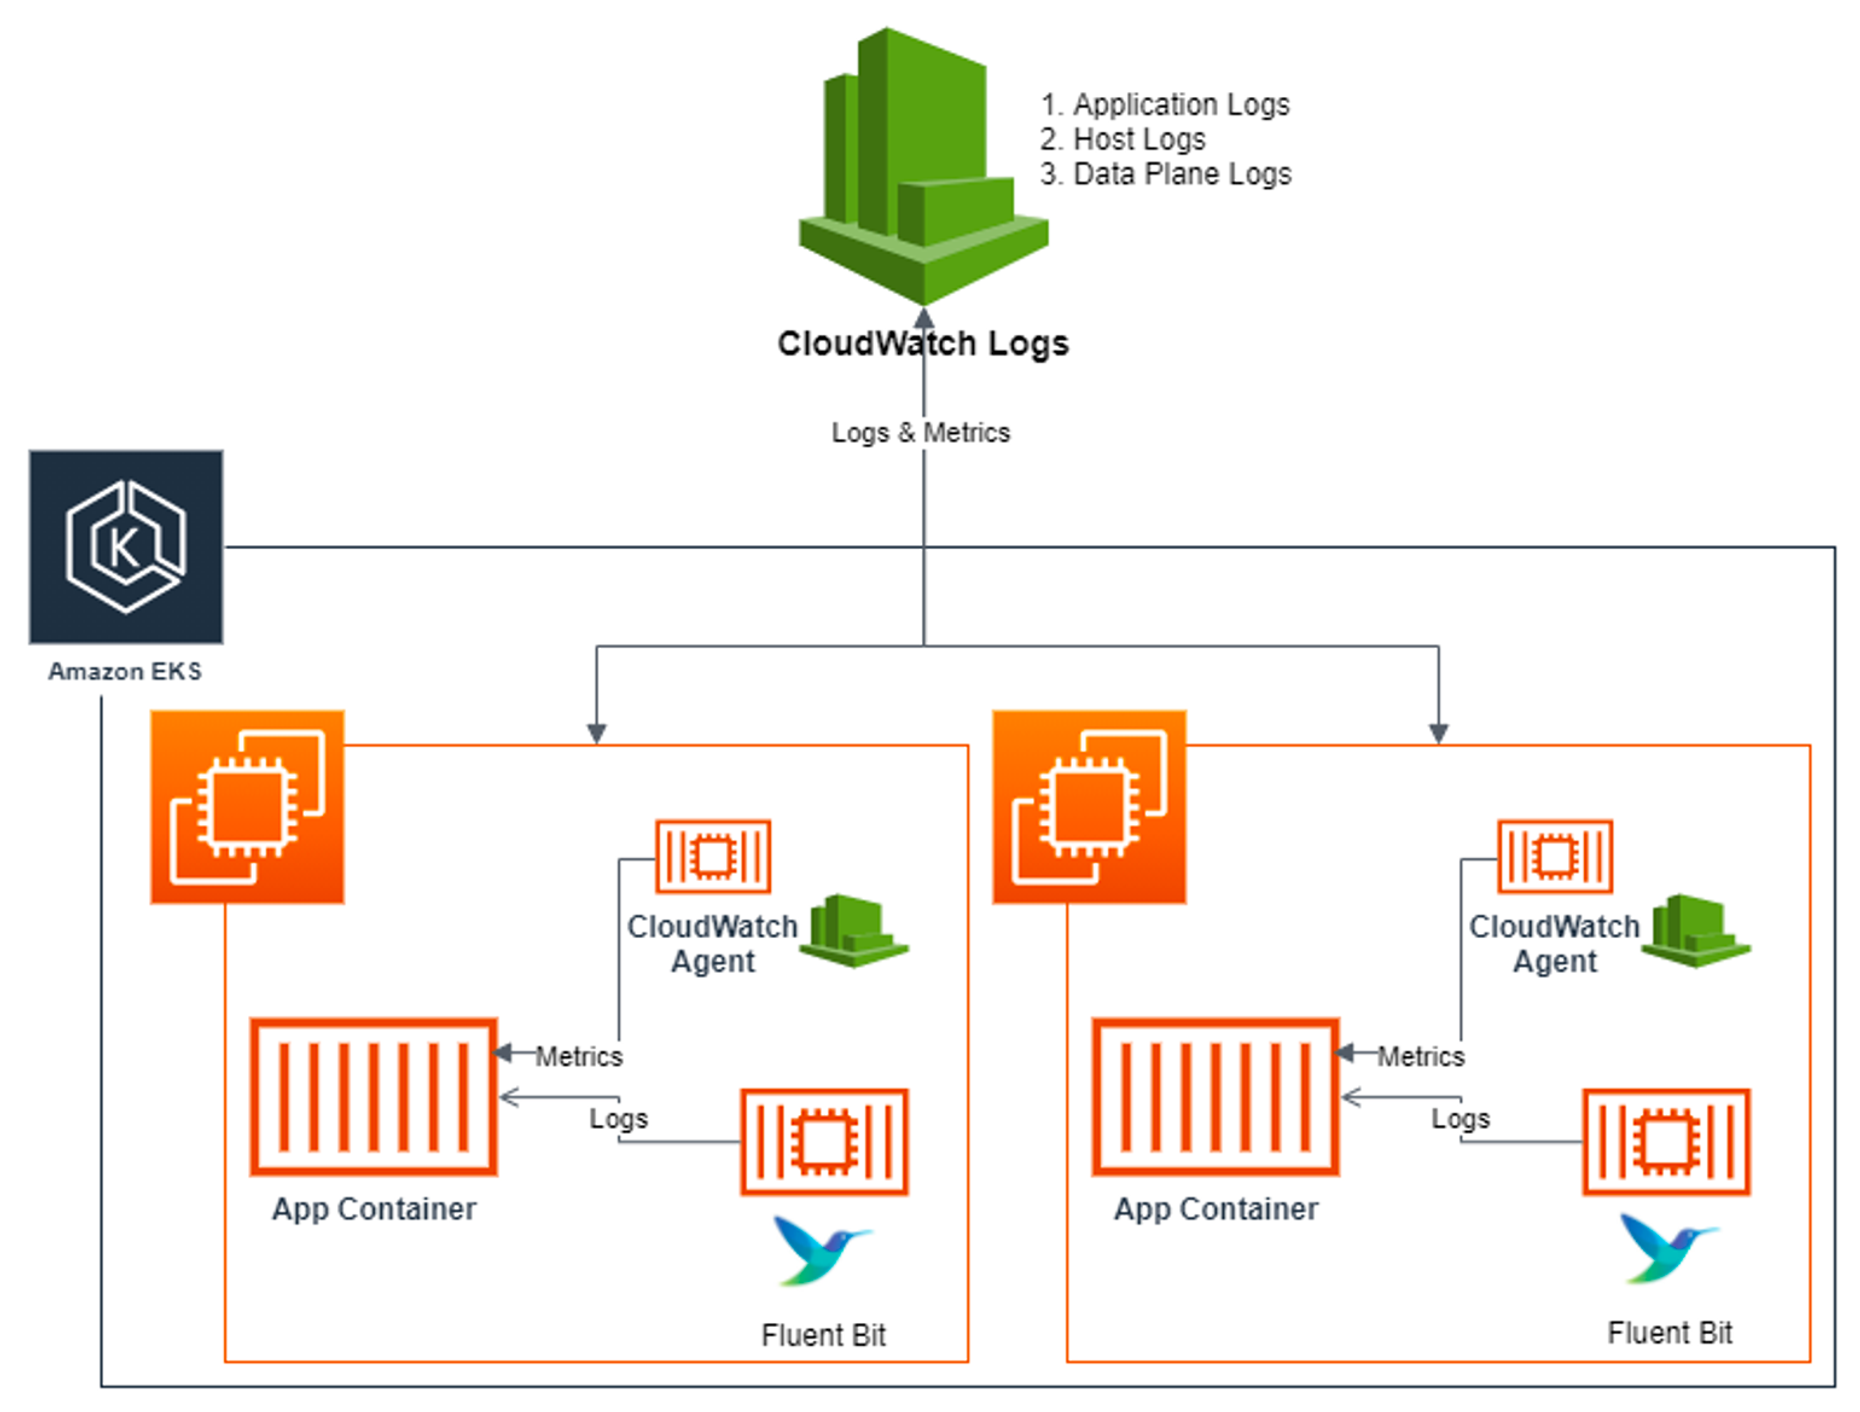
Container Insights metrics in Amazon CloudWatch & Fluent Bit (Logs)
Fluent Bit 는 CloudWatch에서 부족한 로깅데이터를 채워주며 더 유연하고 사용자 정의가 가능하다고 한다.
아래는 아키텍처이다.
for node in $N1 $N2 $N3; do echo ">>>>> $node <<<<<"; ssh ec2-user@$node sudo tree /var/log/containers; echo; done
for node in $N1 $N2 $N3; do echo ">>>>> $node <<<<<"; ssh ec2-user@$node sudo ls -al /var/log/containers; echo; done
#해당 로그를 찾아가서, cat 하면 관련 정보가 다 나온다.
CloudWatch Container Insight는 컨테이너형 애플리케이션 및 마이크로 서비스에 대한 모니터링, 트러블 슈팅 및 알람을 위한 완전 관리형 관측 서비스입니다.
아래는 CloudWatch Container Insight 설치하는 실습코드입니다.
FluentBitHttpServer='On'
FluentBitHttpPort='2020'
FluentBitReadFromHead='Off'
FluentBitReadFromTail='On'

$**curl -s https://raw.githubusercontent.com/aws-samples/amazon-cloudwatch-container-insights/latest/k8s-deployment-manifest-templates/deployment-mode/daemonset/container-insights-monitoring/quickstart/cwagent-fluent-bit-quickstart.yaml | sed 's/{{cluster_name}}/'${CLUSTER_NAME}'/;s/{{region_name}}/'${AWS_DEFAULT_REGION}'/;s/{{http_server_toggle}}/"'${FluentBitHttpServer}'"/;s/{{http_server_port}}/"'${FluentBitHttpPort}'"/;s/{{read_from_head}}/"'${FluentBitReadFromHead}'"/;s/{{read_from_tail}}/"'${FluentBitReadFromTail}'"/' | kubectl apply -f -**

#각 노드에 정상적으로 설치됐는 지 확인
$for node in $N1 $N2 $N3; do echo ">>>>> $node <<<<<"; ssh ec2-user@$node sudo ss -tnlp | grep fluent-bit; echo; done
>>>>> 192.168.1.37 <<<<<
LISTEN 0      128          0.0.0.0:2020       0.0.0.0:*    users:(("fluent-bit",pid=1227,fd=187))

>>>>> 192.168.2.127 <<<<<
LISTEN 0      128          0.0.0.0:2020       0.0.0.0:*    users:(("fluent-bit",pid=2016,fd=193))

>>>>> 192.168.3.97 <<<<<
LISTEN 0      128          0.0.0.0:2020       0.0.0.0:*    users:(("fluent-bit",pid=1834,fd=193))
cluster role 확인
# cloud watch 는 cm, events, nodes에 대한 create 권한도 가진다.
# fluent-bit 는 ns, nodes, pods 에 대한 조회권한만 있다.(get, list, watch)
$kubectl describe clusterrole cloudwatch-agent-role fluent-bit-role                          # 클러스터롤 확인
Name:         cloudwatch-agent-role
Labels:       <none>
Annotations:  <none>
PolicyRule:
  Resources         Non-Resource URLs  Resource Names           Verbs
  ---------         -----------------  --------------           -----
  configmaps        []                 []                       [create]
  events            []                 []                       [create]
  nodes/stats       []                 []                       [create]
  configmaps        []                 [cwagent-clusterleader]  [get update]
  nodes/proxy       []                 []                       [get]
  endpoints         []                 []                       [list watch]
  nodes             []                 []                       [list watch]
  pods              []                 []                       [list watch]
  replicasets.apps  []                 []                       [list watch]
  jobs.batch        []                 []                       [list watch]

Name:         fluent-bit-role
Labels:       <none>
Annotations:  <none>
PolicyRule:
  Resources    Non-Resource URLs  Resource Names  Verbs
  ---------    -----------------  --------------  -----
  namespaces   []                 []              [get list watch]
  nodes/proxy  []                 []              [get list watch]
  nodes        []                 []              [get list watch]
  pods/logs    []                 []              [get list watch]
  pods         []                 []              [get list watch]
               [/metrics]         []              [get]
# cluster role binging은 각각
ServiceAccount  cloudwatch-agent  amazon-cloudwatch
이제 아래에서 관련된 로그를 확인한다.
(cloudwatch, fluent-bit파드의 로그 확인, 각 노드에 fluent-bit 확인)
# 파드 로그 확인
$kubectl -n amazon-cloudwatch logs -l name=cloudwatch-agent -f
2023-05-17T10:49:50Z I! [processors.ec2tagger] ec2tagger: Initial retrieval of tags succeeded
2023-05-17T10:49:50Z I! [processors.ec2tagger] ec2tagger: EC2 tagger has started, finished initial retrieval of tags and Volumes
2023-05-17T10:49:50Z I! [processors.ec2tagger] ec2tagger: Initial retrieval of tags succeeded
2023-05-17T10:49:56Z W! [outputs.cloudwatchlogs] Retried 0 time, going to sleep 126.586058ms before retrying.
...
2023-05-17T10:54:51Z I! [processors.ec2tagger] ec2tagger: Refresh is no longer needed, stop refreshTicker.
2023-05-17T10:55:50Z I! number of namespace to running pod num map[amazon-cloudwatch:6 default:1 kube-system:13]

# 파드 로그 확인
$kubectl -n amazon-cloudwatch logs -l k8s-app=fluent-bit -f
[2023/05/17 10:49:54] [ info] [output:cloudwatch_logs:cloudwatch_logs.2] Creating log stream ip-192-168-2-127.ap-northeast-2.compute.internal.host.messages in log group /aws/containerinsights/myeks/host
[2023/05/17 10:49:54] [ info] [output:cloudwatch_logs:cloudwatch_logs.0] Creating log stream ip-192-168-2-127.ap-northeast-2.compute.internal-application.var.log.containers.fluent-bit-tv2jp_amazon-cloudwatch_fluent-bit-323122d37cdff0e32606fc4c2b4a1e418056daf3880181a2984b2ef802912453.log in log group /aws/containerinsights/myeks/application
[2023/05/17 10:49:54] [ info] [output:cloudwatch_logs:cloudwatch_logs.1] Creating log stream ip-192-168-2-127.ap-northeast-2.compute.internal-dataplane.systemd.kubelet.service in log group /aws/containerinsights/myeks/dataplane
[2023/05/17 10:49:54] [ info] [output:cloudwatch_logs:cloudwatch_logs.2] Created log stream ip-192-168-2-127.ap-northeast-2.compute.internal.host.messages
[2023/05/17 10:49:54] [ info] [output:cloudwatch_logs:cloudwatch_logs.0] Created log stream ip-192-168-2-127.ap-northeast-2.compute.internal-application.var.log.containers.fluent-bit-tv2jp_amazon-cloudwatch_fluent-bit-323122d37cdff0e32606fc4c2b4a1e418056daf3880181a2984b2ef802912453.log
[2023/05/17 10:49:54] [ info] [output:cloudwatch_logs:cloudwatch_logs.1] Created log stream ip-192-168-2-127.ap-northeast-2.compute.internal-dataplane.systemd.kubelet.service
[2023/05/17 10:49:54] [ info] [output:cloudwatch_logs:cloudwatch_logs.0] Creating log stream ip-192-168-2-127.ap-northeast-2.compute.internal-application.var.log.containers.cloudwatch-agent-dqxhl_amazon-cloudwatch_cloudwatch-agent-d1a7d2fe1ff214af72cb368ed9cc4e0ffb5826b7ca6bdac926da943a8cd10c29.log in log group /aws/containerinsights/myeks/application
[2023/05/17 10:49:54] [ info] [output:cloudwatch_logs:cloudwatch_logs.0] Created log stream ip-192-168-2-127.ap-northeast-2.compute.internal-application.var.log.containers.cloudwatch-agent-dqxhl_amazon-cloudwatch_cloudwatch-agent-d1a7d2fe1ff214af72cb368ed9cc4e0ffb5826b7ca6bdac926da943a8cd10c29.log
[2023/05/17 10:50:24] [ info] [output:cloudwatch_logs:cloudwatch_logs.2] Creating log stream ip-192-168-2-127.ap-northeast-2.compute.internal.host.secure in log group /aws/containerinsights/myeks/host
[2023/05/17 10:50:24] [ info] [output:cloudwatch_logs:cloudwatch_logs.2] Created log stream ip-192-168-2-127.ap-northeast-2.compute.internal.host.secure
...
나머지 2개의 노드도 동일
아래는 각 노드의 fluent-bit
# sudo ss tnlp -> TCP 연결을 확인하는 Linux 명령어
$for node in $N1 $N2 $N3; do echo ">>>>> $node <<<<<"; ssh ec2-user@$node sudo ss -tnlp | grep fluent-bit; echo; done
>>>>> 192.168.1.37 <<<<<
LISTEN 0      128          0.0.0.0:2020       0.0.0.0:*    users:(("fluent-bit",pid=1227,fd=187))

>>>>> 192.168.2.127 <<<<<
LISTEN 0      128          0.0.0.0:2020       0.0.0.0:*    users:(("fluent-bit",pid=2016,fd=193))

>>>>> 192.168.3.97 <<<<<
LISTEN 0      128          0.0.0.0:2020       0.0.0.0:*    users:(("fluent-bit",pid=1834,fd=193))
cwagentconfig configmap 확인 Cloudwatch에 대한 설정값은 cwagentconfig에서 확인할 수 있다.
관련 옵션에 대한 문서는 AWS Docs 에서 참고할 수 있다.
$kubectl describe cm cwagentconfig -n amazon-cloudwatch
Name:         cwagentconfig
Namespace:    amazon-cloudwatch
...
{
  "agent": {
    "region": "ap-northeast-2"
  },
  "logs": {
    "metrics_collected": {
      "kubernetes": {
        "cluster_name": "myeks",
        "metrics_collection_interval": 60 # 60초 마다 metrics 수집
      }
    },
    "force_flush_interval": 5 # 로그이벤트에 대한 일괄처리 간격 5초
  }
}
로그를 저장하는 방식확인 HostPath를 이용해서 로그를 저장하며 관련된 내용은 아래의 Volume에서 확인할 수 있다.
$kubectl describe -n amazon-cloudwatch ds cloudwatch-agent
Name:           cloudwatch-agent
Selector:       name=cloudwatch-agent
Node-Selector:  kubernetes.io/os=linux
Labels:         <none>
Annotations:    deprecated.daemonset.template.generation: 1
Desired Number of Nodes Scheduled: 3
Current Number of Nodes Scheduled: 3
Number of Nodes Scheduled with Up-to-date Pods: 3
Number of Nodes Scheduled with Available Pods: 3
Number of Nodes Misscheduled: 0
Pods Status:  3 Running / 0 Waiting / 0 Succeeded / 0 Failed
Pod Template:
  Labels:           name=cloudwatch-agent
  Service Account:  cloudwatch-agent
  Containers:
   cloudwatch-agent:
    Image:      public.ecr.aws/cloudwatch-agent/cloudwatch-agent:1.247359.0b252558
    Port:       <none>
    Host Port:  <none>
    Limits:
      cpu:     200m
      memory:  200Mi
    Requests:
      cpu:     200m
      memory:  200Mi
    Environment:
      HOST_IP:         (v1:status.hostIP)
      HOST_NAME:       (v1:spec.nodeName)
      K8S_NAMESPACE:   (v1:metadata.namespace)
      CI_VERSION:     k8s/1.3.14
    Mounts:
      /dev/disk from devdisk (ro)
      /etc/cwagentconfig from cwagentconfig (rw)
      /rootfs from rootfs (ro)
      /run/containerd/containerd.sock from containerdsock (ro)
      /sys from sys (ro)
      /var/lib/docker from varlibdocker (ro)
      /var/run/docker.sock from dockersock (ro)
  Volumes:
   cwagentconfig:
    Type:      ConfigMap (a volume populated by a ConfigMap)
    Name:      cwagentconfig
    Optional:  false
   rootfs:
    Type:          HostPath (bare host directory volume)
    Path:          /
    HostPathType:
   dockersock:
    Type:          HostPath (bare host directory volume)
    Path:          /var/run/docker.sock
    HostPathType:
   varlibdocker:
    Type:          HostPath (bare host directory volume)
    Path:          /var/lib/docker
    HostPathType:
   containerdsock:
    Type:          HostPath (bare host directory volume)
    Path:          /run/containerd/containerd.sock
    HostPathType:
   sys:
    Type:          HostPath (bare host directory volume)
    Path:          /sys
    HostPathType:
   devdisk:
    Type:          HostPath (bare host directory volume)
    Path:          /dev/disk/
    HostPathType:
Events:
  Type    Reason            Age    From                  Message
  ----    ------            ----   ----                  -------
  Normal  SuccessfulCreate  7m10s  daemonset-controller  Created pod: cloudwatch-agent-dqxhl
  Normal  SuccessfulCreate  7m10s  daemonset-controller  Created pod: cloudwatch-agent-4s2zn
  Normal  SuccessfulCreate  7m10s  daemonset-controller  Created pod: cloudwatch-agent-trg48
# 직접 노드에 접속하여 로그 확인
$ssh ec2-user@$N1 sudo tree /var/log
/var/log
├── amazon
│   └── ssm
│       ├── amazon-ssm-agent.log
│       └── audits
│           └── amazon-ssm-agent-audit-2023-05-17
├── audit
│   └── audit.log
├── aws-routed-eni
│   ├── egress-v4-plugin.log
│   ├── ipamd.log
│   └── plugin.log
├── boot.log
├── btmp
├── chrony
│   ├── measurements.log
│   ├── statistics.log
│   └── tracking.log
├── cloud-init.log
├── cloud-init-output.log
├── containers
│   ├── aws-node-v4rrj_kube-system_aws-node-3f4dccffced176a063625ee6fc7a6f4660a9044b234f091fb4c6223133673ed1.log -> /var/log/pods/kube-system_aws-node-v4rrj_3255b05a-827d-40d8-a6e3-f5af4a8d2d61/aws-node/0.log
│   ├── aws-node-v4rrj_kube-system_aws-vpc-cni-init-7dbade8cc5816e0b5234e1d04aa534d11020abd8364ae0463ea32f5c5c7d4e21.log -> /var/log/pods/kube-system_aws-node-v4rrj_3255b05a-827d-40d8-a6e3-f5af4a8d2d61/aws-vpc-cni-init/0.log
│   ├── cloudwatch-agent-4s2zn_amazon-cloudwatch_cloudwatch-agent-3f5c992074ee5b07f208c260a0729ea166155d34215187ede71d5008693fcfe1.log -> /var/log/pods/amazon-cloudwatch_cloudwatch-agent-4s2zn_0bcce925-7abd-40c9-b32b-66a3d04ee992/cloudwatch-agent/0.log
│   ├── coredns-6777fcd775-xmbs7_kube-system_coredns-4825cfc8c2fb811cb4b2f69653de2a7e4973eeaca4bbb5ae2d4d1468a88bf271.log -> /var/log/pods/kube-system_coredns-6777fcd775-xmbs7_c7bb0ccd-67ee-446d-811f-48b33bcd0f83/coredns/0.log
│   ├── ebs-csi-node-sz9lr_kube-system_ebs-plugin-4aa278cfd8a59348f1975638d50f6f58229fc924cca599c1c5cffd363f803d8f.log -> /var/log/pods/kube-system_ebs-csi-node-sz9lr_415aea18-7e6c-46f5-96f1-35aa791305ec/ebs-plugin/0.log
│   ├── ebs-csi-node-sz9lr_kube-system_liveness-probe-90d51a14e4df2738fe524f74971bc041786290454ad2c5885ff18c53f9a721e9.log -> /var/log/pods/kube-system_ebs-csi-node-sz9lr_415aea18-7e6c-46f5-96f1-35aa791305ec/liveness-probe/0.log
│   ├── ebs-csi-node-sz9lr_kube-system_node-driver-registrar-8ac1e0be8b994741459e73420186d93b72107d71f3155f57d63772fa1b97db24.log -> /var/log/pods/kube-system_ebs-csi-node-sz9lr_415aea18-7e6c-46f5-96f1-35aa791305ec/node-driver-registrar/0.log
│   ├── fluent-bit-bdgtk_amazon-cloudwatch_fluent-bit-6296393c94936a2abbda7ee84890ff12c66f3cd2951252c0d9c15d9e2d3232a6.log -> /var/log/pods/amazon-cloudwatch_fluent-bit-bdgtk_5fc0e8f8-c220-415f-b199-6643c70c22c4/fluent-bit/0.log
│   └── kube-proxy-fswxw_kube-system_kube-proxy-5b8cc3eb0106c283fd78a0cea3710e148a793a31bf32f3a3176724f414dc6761.log -> /var/log/pods/kube-system_kube-proxy-fswxw_bf3b6818-020e-47c8-9c31-40c260c3d0c2/kube-proxy/0.log
├── cron
├── dmesg
├── dmesg.old
├── grubby
├── grubby_prune_debug
├── journal
│   ├── ec2179c4f3e906eda92ce733733bd5d0
│   │   └── system.journal
│   └── ec2466c41de306c0e40b1ac67c61386f
│       ├── system.journal
│       └── user-1000.journal
├── lastlog
├── maillog
├── messages
├── pods
│   ├── amazon-cloudwatch_cloudwatch-agent-4s2zn_0bcce925-7abd-40c9-b32b-66a3d04ee992
│   │   └── cloudwatch-agent
│   │       └── 0.log
│   ├── amazon-cloudwatch_fluent-bit-bdgtk_5fc0e8f8-c220-415f-b199-6643c70c22c4
│   │   └── fluent-bit
│   │       └── 0.log
│   ├── kube-system_aws-node-v4rrj_3255b05a-827d-40d8-a6e3-f5af4a8d2d61
│   │   ├── aws-node
│   │   │   └── 0.log
│   │   └── aws-vpc-cni-init
│   │       └── 0.log
│   ├── kube-system_coredns-6777fcd775-xmbs7_c7bb0ccd-67ee-446d-811f-48b33bcd0f83
│   │   └── coredns
│   │       └── 0.log
│   ├── kube-system_ebs-csi-node-sz9lr_415aea18-7e6c-46f5-96f1-35aa791305ec
│   │   ├── ebs-plugin
│   │   │   └── 0.log
│   │   ├── liveness-probe
│   │   │   └── 0.log
│   │   └── node-driver-registrar
│   │       └── 0.log
│   └── kube-system_kube-proxy-fswxw_bf3b6818-020e-47c8-9c31-40c260c3d0c2
│       └── kube-proxy
│           └── 0.log
├── sa
│   └── sa17
├── secure
├── spooler
├── tallylog
├── wtmp
└── yum.log
아래는 fluent-bit-config map 확인한 모습이다. 관련된 내용은 콘솔의 로그그룹에도 똑같이 존재한다.
$kubectl describe cm fluent-bit-config -n amazon-cloudwatch
Name:         fluent-bit-config
Namespace:    amazon-cloudwatch
Labels:       k8s-app=fluent-bit
Annotations:  <none>

Data
====
fluent-bit.conf:
----
[SERVICE]
    Flush                     5
    Grace                     30
    Log_Level                 info
    Daemon                    off
    Parsers_File              parsers.conf
    HTTP_Server               ${HTTP_SERVER}
    HTTP_Listen               0.0.0.0
    HTTP_Port                 ${HTTP_PORT}
    storage.path              /var/fluent-bit/state/flb-storage/
    storage.sync              normal
    storage.checksum          off
    storage.backlog.mem_limit 5M
# 아래의 콘솔과 일치
@INCLUDE application-log.conf
@INCLUDE dataplane-log.conf
@INCLUDE host-log.conf
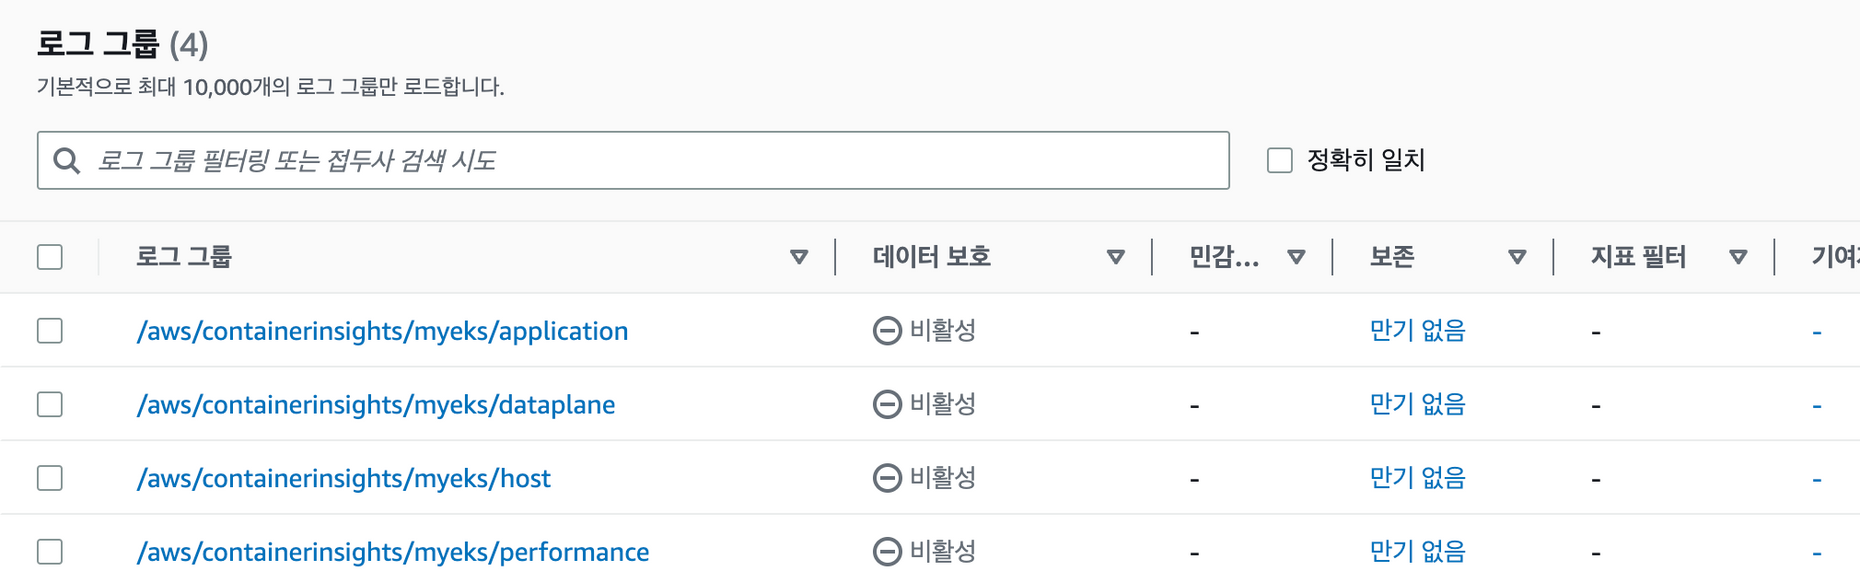
AWS 콘솔 로그그룹에서 확인가능
배포한 Nginx에 부하를 주어, 로그확인
$yum install -y httpd
#아래의 명령어는 ApacheBench (ab) 웹사이트 부하테스트 명령어이다.
## -c = 동시유저, -n = 총 트래픽 -> 500명의 동시유저가 트래픽을 날려 총 3만개의 트래픽을 날림
$ab -c 500 -n 30000 https://nginx.$MyDomain/
This is ApacheBench, Version 2.3 <$Revision: 1903618 $>
...
$kubectl logs deploy/nginx -f
nginx 10:42:49.73
nginx 10:42:49.73 Welcome to the Bitnami nginx container
nginx 10:42:49.74 Subscribe to project updates by watching https://github.com/bitnami/containers
nginx 10:42:49.74 Submit issues and feature requests at https://github.com/bitnami/containers/issues
nginx 10:42:49.74
nginx 10:42:49.74 INFO ==> ** Starting NGINX setup **
...
subject=CN = example.com
Getting Private key
nginx 10:42:50.84 INFO ==> No custom scripts in /docker-entrypoint-initdb.d
nginx 10:42:50.84 INFO ==> Initializing NGINX
realpath: /bitnami/nginx/conf/vhosts: No such file or directory
nginx 10:42:50.86 INFO ==> ** NGINX setup finished! **
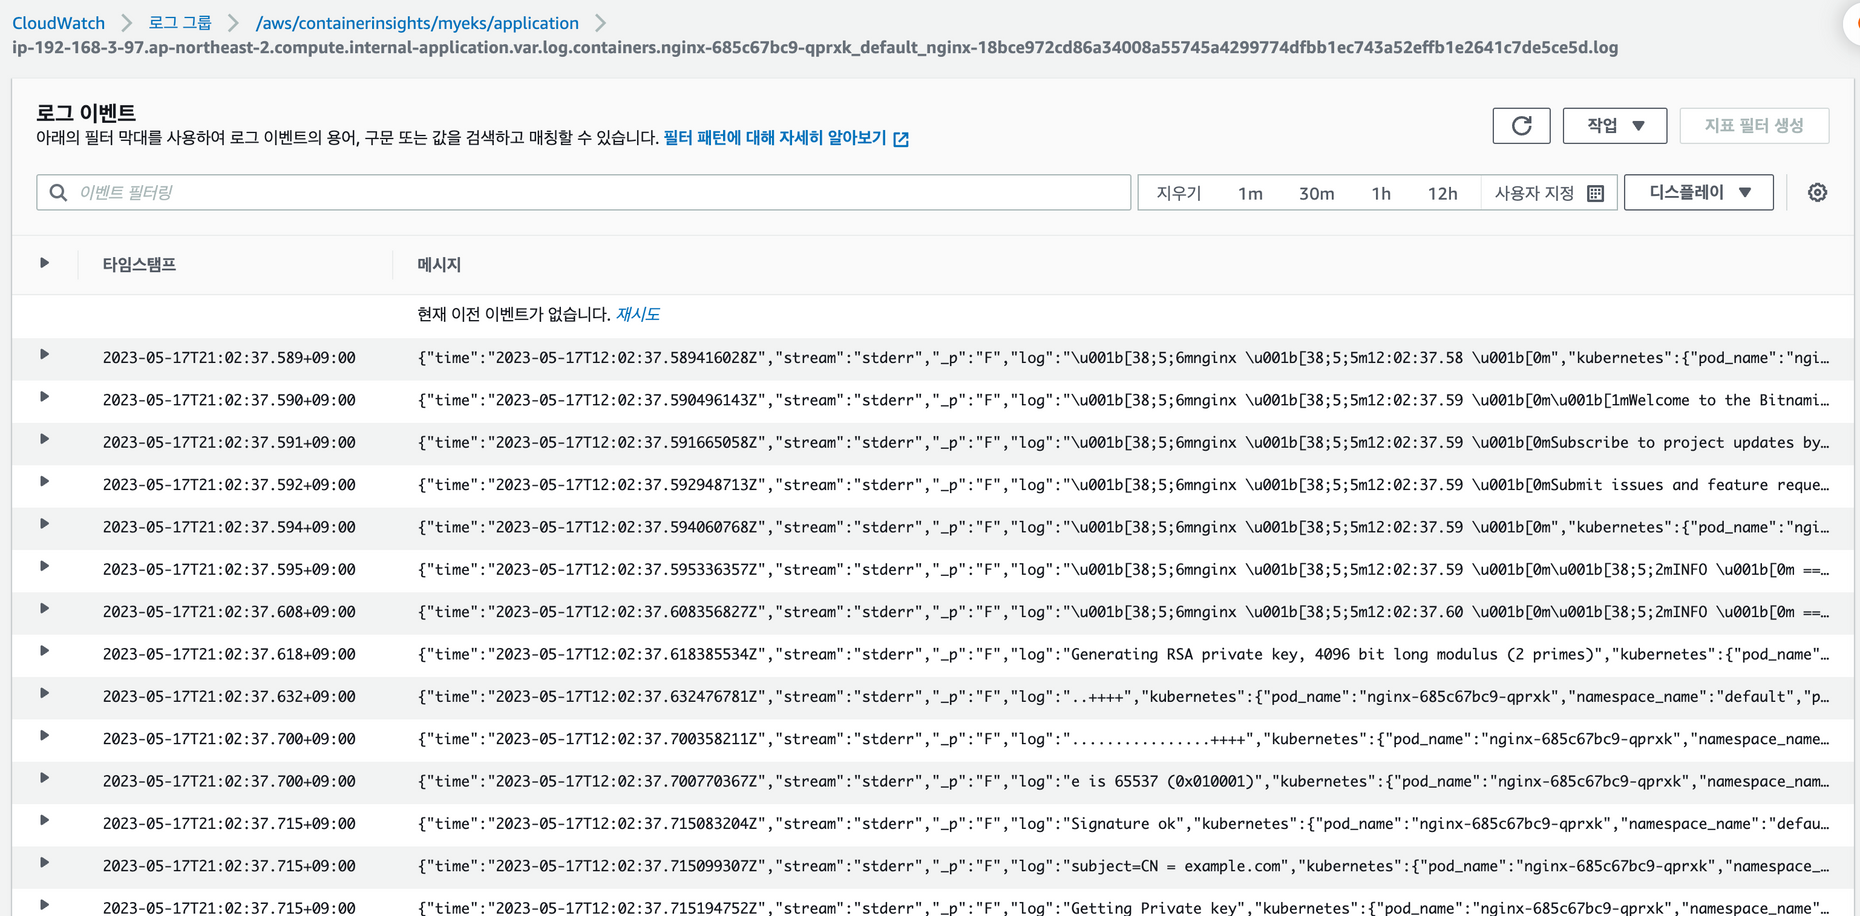
nginx 10:42:50.87 INFO ==> ** Starting NGINX **nginx 로그 확인
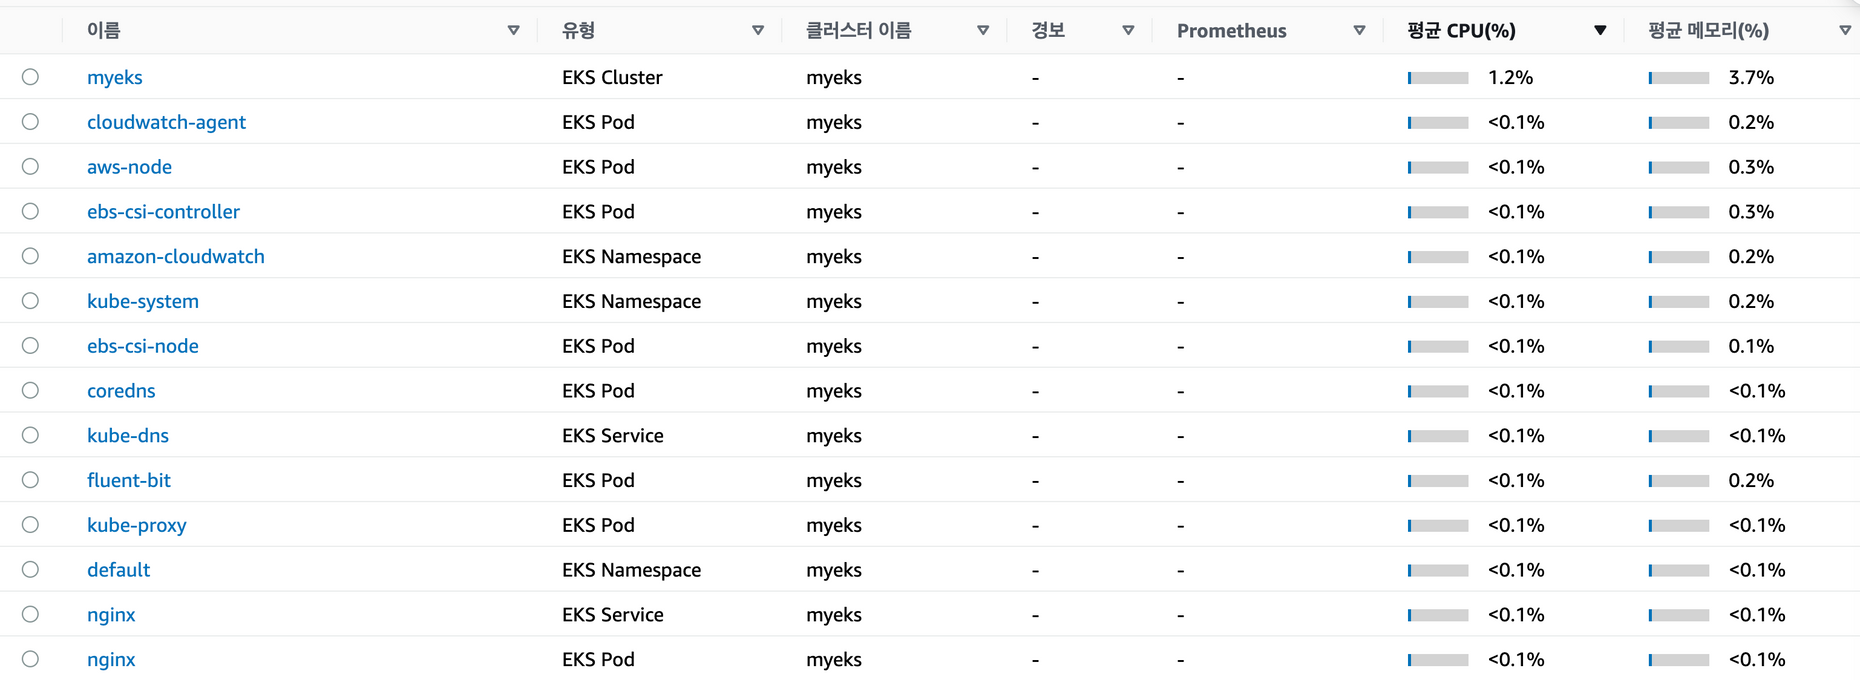
메트릭 확인 : ccontainer map, UI를 통해 전체구조를 한눈에 그려준다.
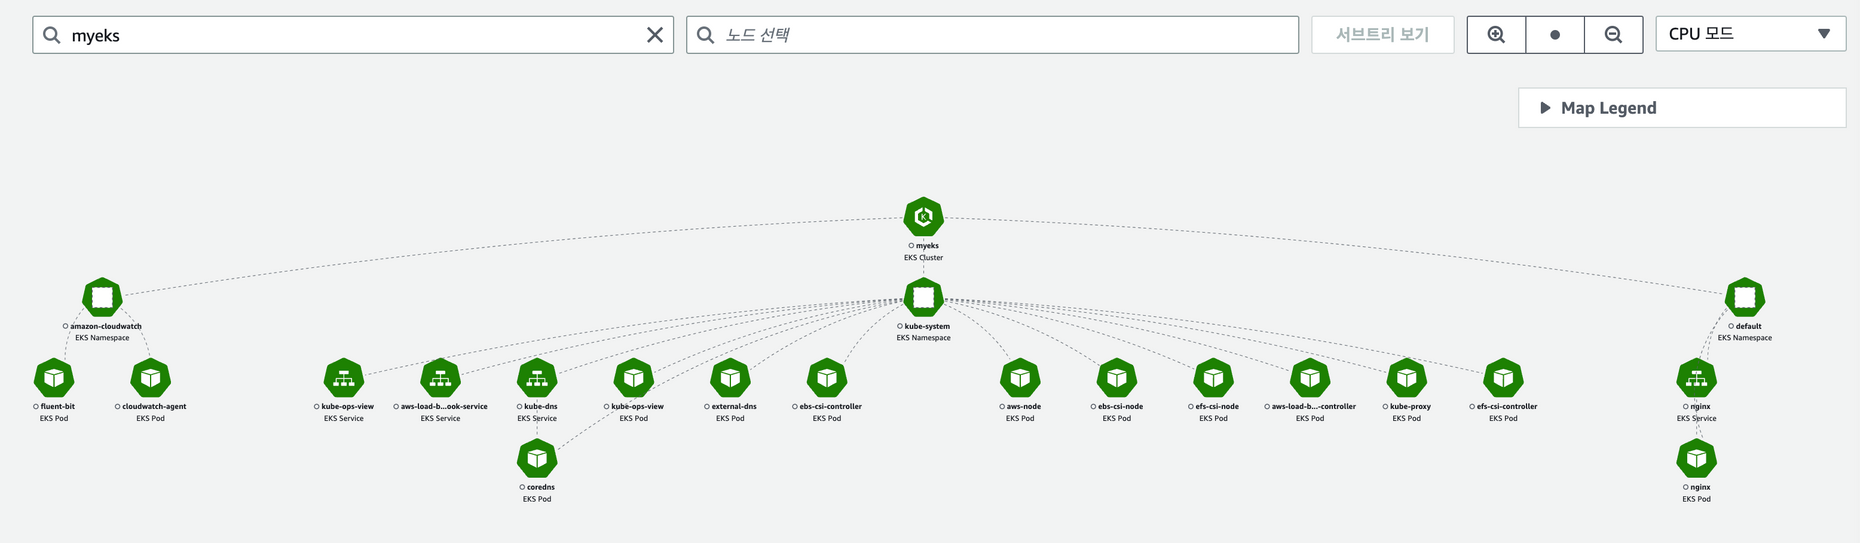
리소스 사용량으로 필터링한 모습이다. 아직까진 리소스를 많이 잡아먹는 애플리케이션이 없다.
Metrics-server & kwatch & botkube
여기에서는 모니터링, 알람과 관련된 툴 3가지에 대해 직접 배포하고 테스트한다.
kubelet으로부터 수집한 리소스 메트릭을 수집 및 집계하는 클러스터 애드온이며 아래의 2가지 기능이 가능하다.
- 노드 및 파드의 리소스 사용량을 모니터링
- 애플리케이션의 성능 저하를 식별
이 정보를 받아 다른 툴을 연결하여 오토스케일링과 같이 파드와 노드의 리소스를 제어할 수 있다.
# 배포
$kubectl apply -f https://github.com/kubernetes-sigs/metrics-server/releases/latest/download/components.yaml
serviceaccount/metrics-server created
clusterrole.rbac.authorization.k8s.io/system:aggregated-metrics-reader created
clusterrole.rbac.authorization.k8s.io/system:metrics-server created
rolebinding.rbac.authorization.k8s.io/metrics-server-auth-reader created
clusterrolebinding.rbac.authorization.k8s.io/metrics-server:system:auth-delegator created
clusterrolebinding.rbac.authorization.k8s.io/system:metrics-server created
service/metrics-server created
deployment.apps/metrics-server created
apiservice.apiregistration.k8s.io/v1beta1.metrics.k8s.io created
# 배포 확인
$kubectl get apiservices |egrep '(AVAILABLE|metrics)'
NAME                                   SERVICE                      AVAILABLE   AGE
v1beta1.metrics.k8s.io                 kube-system/metrics-server   True        31s

$kubectl api-resources | grep metrics
nodes                                          metrics.k8s.io/v1beta1                 false        NodeMetrics
pods                                           metrics.k8s.io/v1beta1                 true         PodMetrics

# 리소스 사용량 확인 1000m = 1 core
$kubectl top node
NAME                                               CPU(cores)   CPU%   MEMORY(bytes)   MEMORY%
ip-192-168-1-37.ap-northeast-2.compute.internal    52m          1%     560Mi           3%
ip-192-168-2-127.ap-northeast-2.compute.internal   51m          1%     632Mi           4%
ip-192-168-3-97.ap-northeast-2.compute.internal    61m          1%     602Mi           4%
$kubectl top pod -A
NAMESPACE           NAME                                  CPU(cores)   MEMORY(bytes)
amazon-cloudwatch   cloudwatch-agent-4s2zn                4m           28Mi
amazon-cloudwatch   cloudwatch-agent-dqxhl                4m           32Mi
amazon-cloudwatch   cloudwatch-agent-trg48                4m           29Mi
amazon-cloudwatch   fluent-bit-bdgtk                      2m           24Mi
amazon-cloudwatch   fluent-bit-tv2jp                      1m           24Mi
amazon-cloudwatch   fluent-bit-vvm4j                      2m           25Mi
default             nginx-685c67bc9-qprxk                 1m           4Mi
kube-system         aws-node-9427n                        3m           38Mi
kube-system         aws-node-q8g52                        3m           37Mi
kube-system         aws-node-v4rrj                        3m           37Mi
kube-system         coredns-6777fcd775-56hnq              2m           13Mi
kube-system         coredns-6777fcd775-xmbs7              2m           13Mi
kube-system         ebs-csi-controller-67658f895c-r6zvw   2m           49Mi
kube-system         ebs-csi-controller-67658f895c-rm4bg   5m           56Mi
kube-system         ebs-csi-node-dc7lw                    2m           21Mi
kube-system         ebs-csi-node-sphnv                    2m           20Mi
kube-system         ebs-csi-node-sz9lr                    2m           21Mi
kube-system         kube-proxy-9tk8k                      3m           10Mi
kube-system         kube-proxy-fswxw                      1m           10Mi
kube-system         kube-proxy-z9669                      1m           9Mi
kube-system         metrics-server-6bf466fbf5-s6ccb       4m           17Mi

$kubectl top pod -n kube-system --sort-by='cpu'
NAME                                  CPU(cores)   MEMORY(bytes)
ebs-csi-controller-67658f895c-rm4bg   5m           56Mi
metrics-server-6bf466fbf5-s6ccb       4m           17Mi
aws-node-q8g52                        3m           37Mi
aws-node-v4rrj                        3m           37Mi
aws-node-9427n                        3m           38Mi
kube-proxy-9tk8k                      3m           10Mi
coredns-6777fcd775-56hnq              2m           13Mi
ebs-csi-node-dc7lw                    2m           21Mi
ebs-csi-node-sphnv                    2m           20Mi
ebs-csi-node-sz9lr                    2m           21Mi
ebs-csi-controller-67658f895c-r6zvw   2m           49Mi
coredns-6777fcd775-xmbs7              2m           13Mi
kwatch
kwatch는 Kubernetes(K8s) 클러스터의 모든 변경 사항을 모니터링하고, 실행 중인 앱의 충돌을 실시간으로 감지하며, 채널(Slack, Discord 등)에 알림을 즉시 게시할 수 있도록 도와줍니다.
아래는 생성과정이다.
별도의 워크스페이스를 생성한 후, 채널 → 설정 → APP 추가 → webhook 검색 → incoming-webhook 추가 → 생성된 URL을 config yaml 파일에 넣으면 된다.
#config map 생성
cat kwatch-config.yaml | yh
apiVersion: v1
kind: Namespace
metadata:
name: kwatch
---
apiVersion: v1
kind: ConfigMap
metadata:
name: kwatch
namespace: kwatch
data:
config.yaml: |
alert:
slack:
webhook: https://hooks.slack.com/services/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
title: -EKS
#text:
pvcMonitor:
enabled: true
interval: 5
threshold: 70
# config map 배포
$k apply -f kwatch-config.yaml
namespace/kwatch created
configmap/kwatch created
#배포
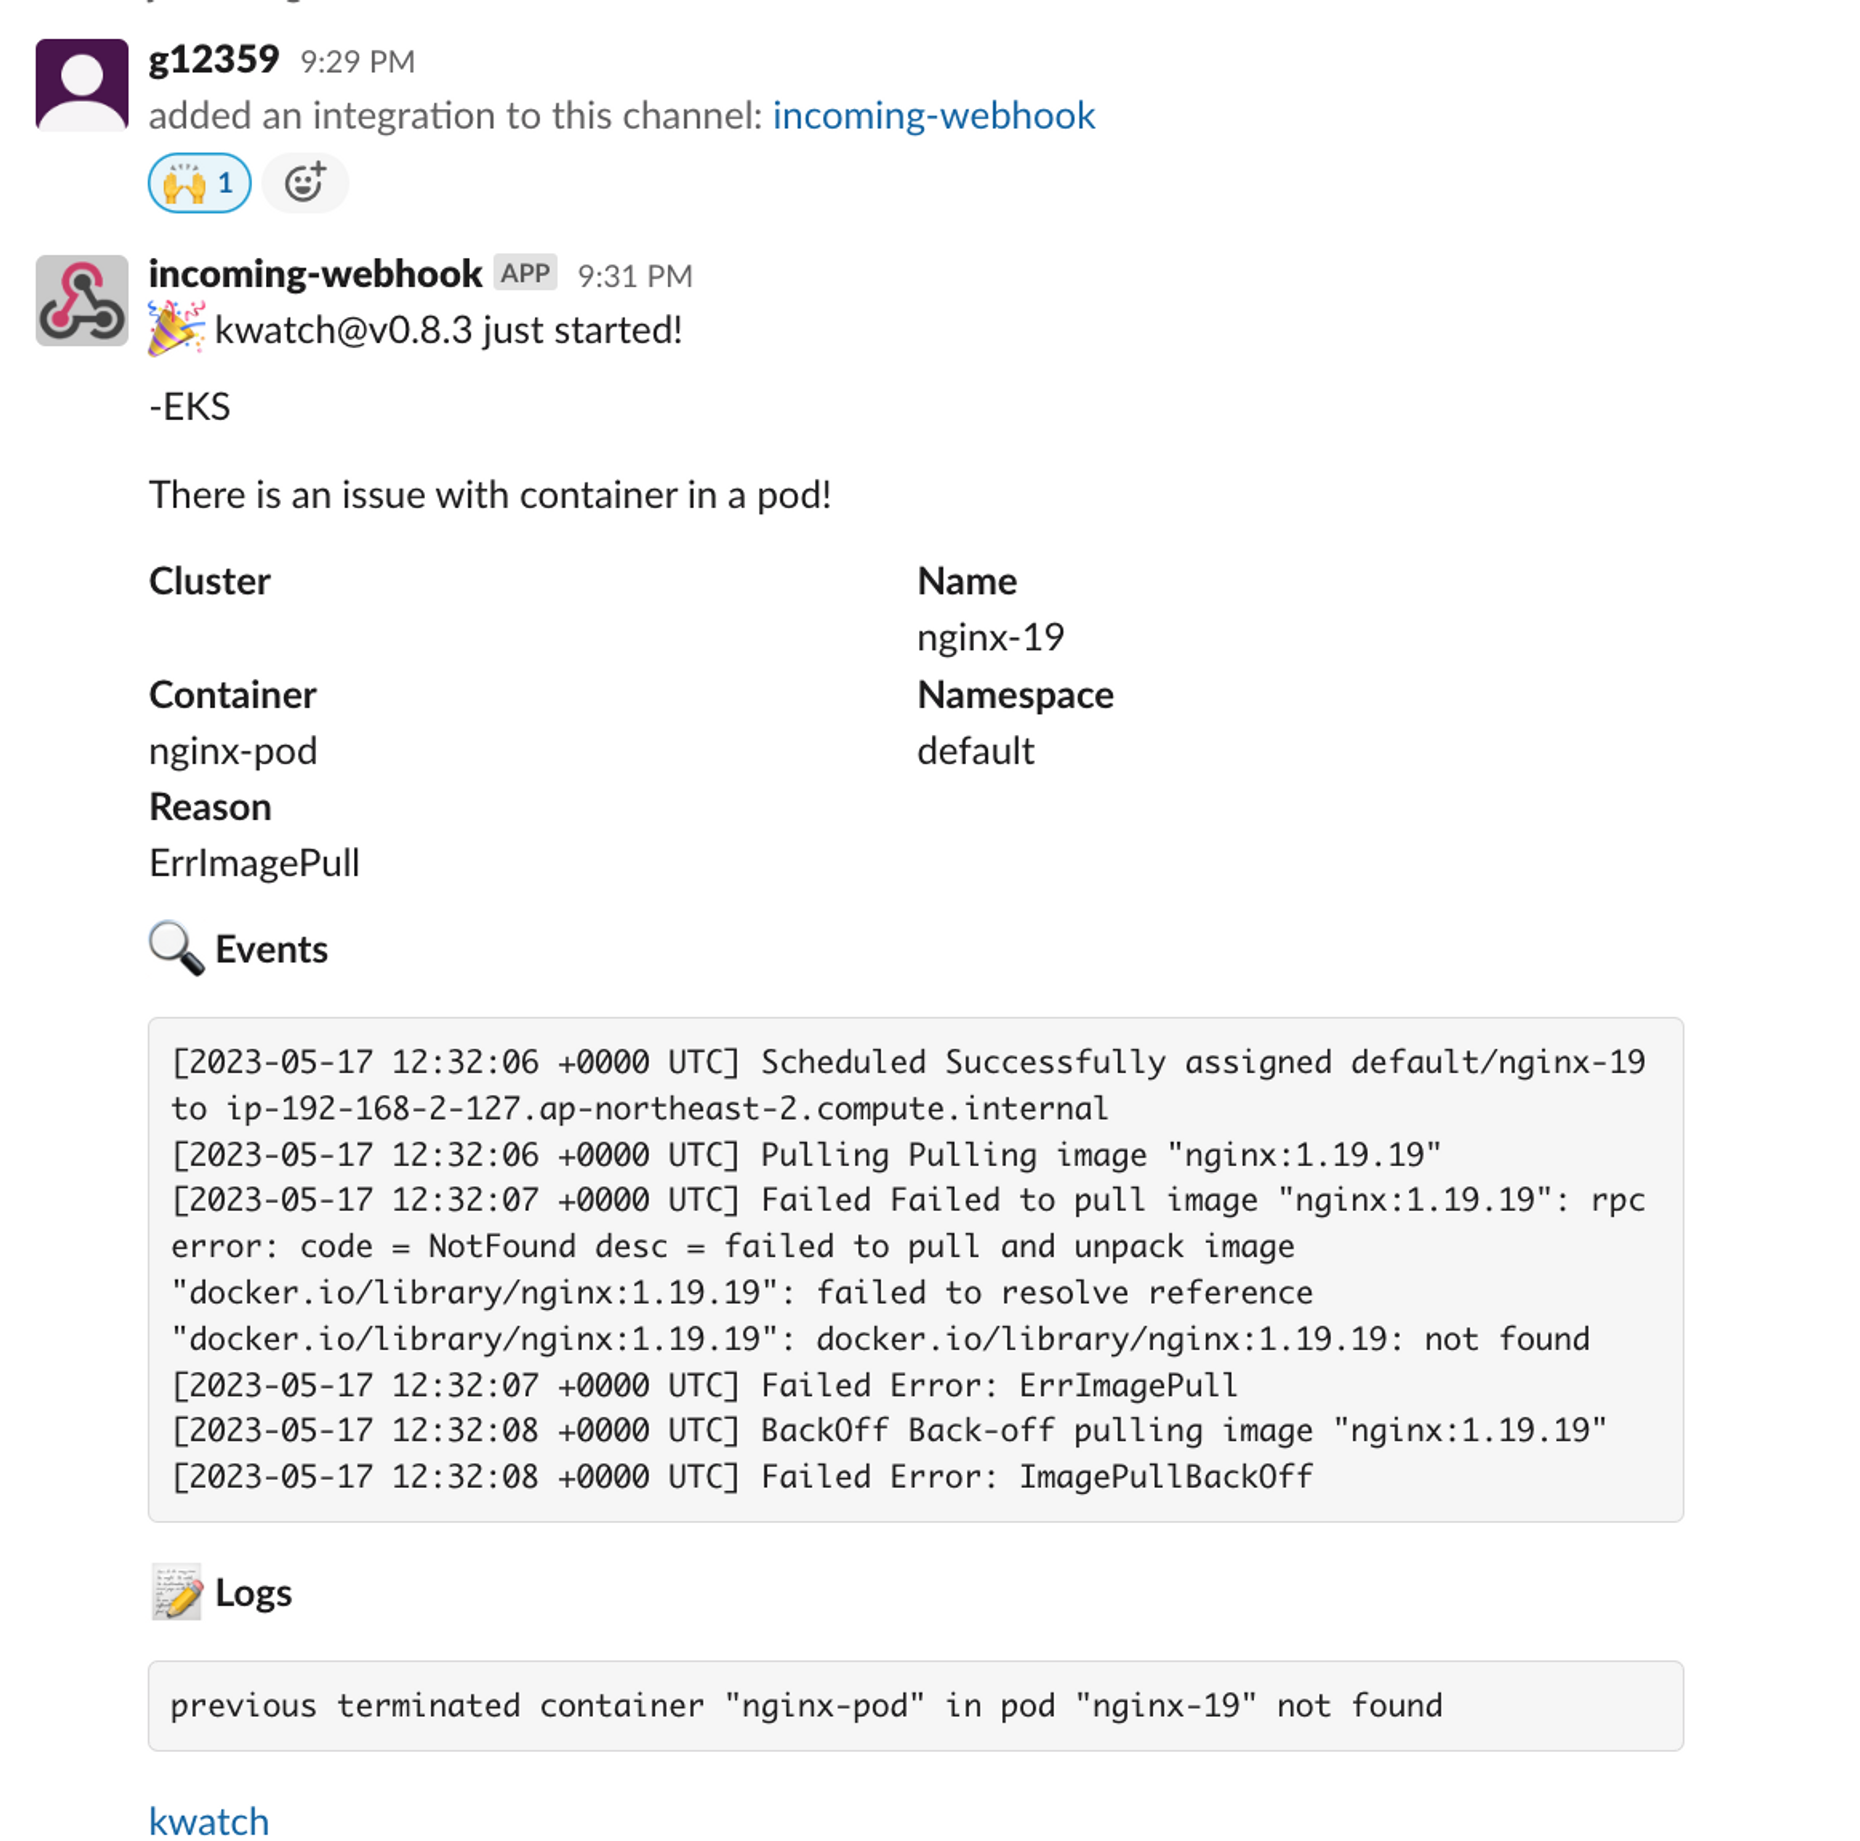
$kubectl apply -f https://raw.githubusercontent.com/abahmed/kwatch/v0.8.3/deploy/deploy.yaml정상적으로 배포되었다면, slack에 메시지가 도착한다.
이제 오류 알람이 정상적으로 오는 지 확인한다.
# 잘못된 이미지 정보의 파드 배포
$kubectl apply -f https://raw.githubusercontent.com/junghoon2/kube-books/main/ch05/nginx-error-pod.yml
pod/nginx-19 created
# 이벤트 로그
$k get events -w
LAST SEEN   TYPE      REASON              OBJECT                       MESSAGE
1s          Normal    Scheduled           pod/nginx-19                 Successfully assigned default/nginx-19 to ip-192-168-2-127.ap-northeast-2.compute.internal
1s          Normal    Pulling             pod/nginx-19                 Pulling image "nginx:1.19.19"
29m         Normal    Scheduled           pod/nginx-685c67bc9-qprxk    Successfully assigned default/nginx-685c67bc9-qprxk to ip-192-168-3-97.ap-northeast-2.compute.internal
29m         Normal    Pulled              pod/nginx-685c67bc9-qprxk    Container image "docker.io/bitnami/nginx:1.24.0-debian-11-r0" already present on machine
29m         Normal    Created             pod/nginx-685c67bc9-qprxk    Created container nginx
29m         Normal    Started             pod/nginx-685c67bc9-qprxk    Started container nginx
30m         Normal    Killing             pod/nginx-685c67bc9-vmwh9    Stopping container nginx
30m         Warning   Unhealthy           pod/nginx-685c67bc9-vmwh9    Readiness probe failed: dial tcp 192.168.3.251:8080: connect: connection refused
29m         Normal    SuccessfulCreate    replicaset/nginx-685c67bc9   Created pod: nginx-685c67bc9-qprxk
29m         Normal    ScalingReplicaSet   deployment/nginx             Scaled up replica set nginx-685c67bc9 to 1
0s          Warning   Failed              pod/nginx-19                 Failed to pull image "nginx:1.19.19": rpc error: code = NotFound desc = failed to pull and unpack image "docker.io/library/nginx:1.19.19": failed to resolve reference "docker.io/library/nginx:1.19.19": docker.io/library/nginx:1.19.19: not found
0s          Warning   Failed              pod/nginx-19                 Error: ErrImagePull
0s          Normal    BackOff             pod/nginx-19                 Back-off pulling image "nginx:1.19.19"
0s          Warning   Failed              pod/nginx-19                 Error: ImagePullBackOff

#모니터링 결과 에러가 발생! 이제 알람이 와야함
Every 2.0s: kubectl get pod                                                                             Wed May 17 21:32:48 2023

NAME                    READY   STATUS         RESTARTS   AGE
nginx-19                0/1     ErrImagePull   0          6s
nginx-685c67bc9-qprxk   1/1     Running        0          30m
정상적으로 알람이 온 것을 확인할 수 있다.
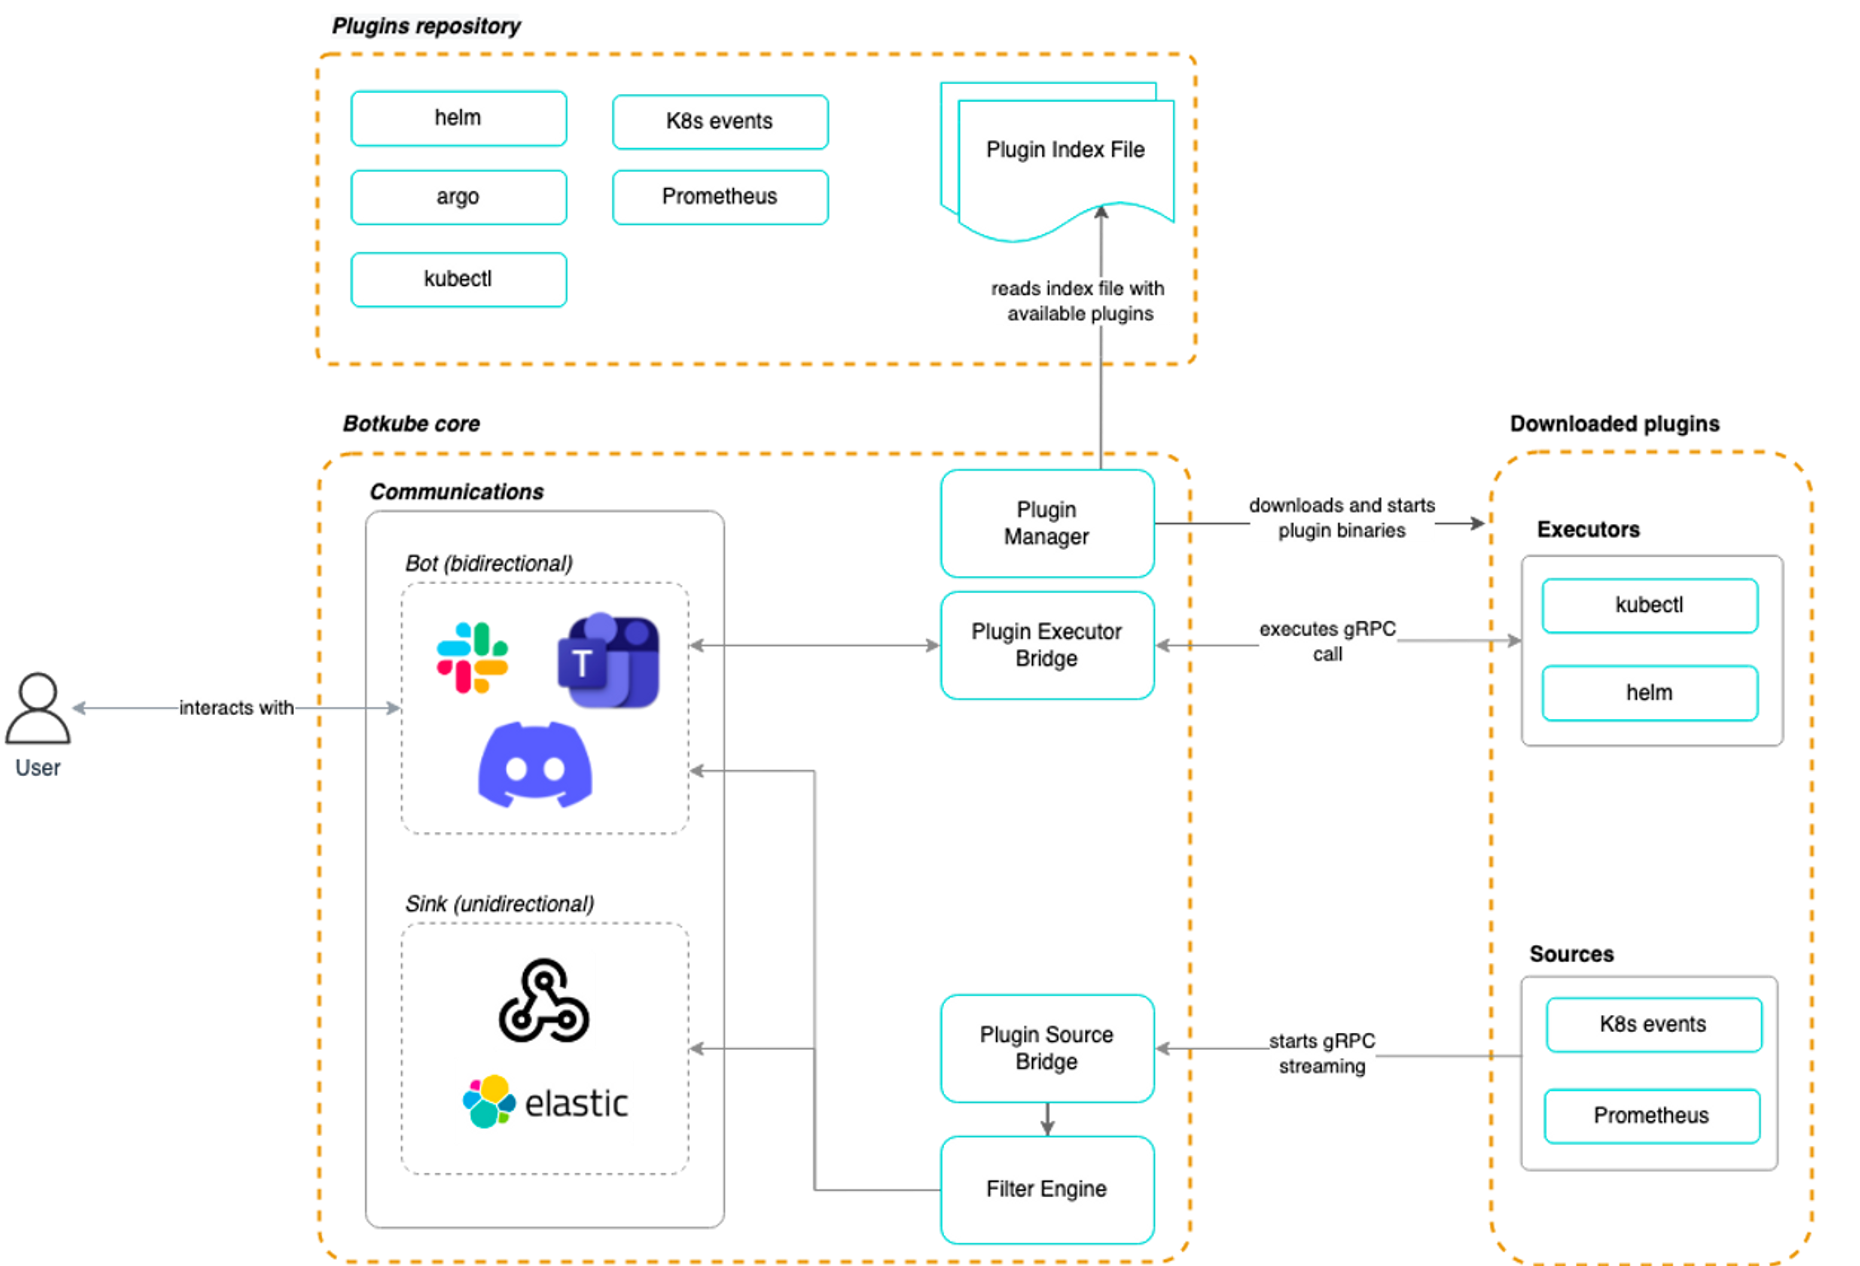
Botkube위와 유사하게, 클러스터를 모니터링하며 채널(Slack, Discord 등)에 알림을 즉시 게시할 수 있도록 도와준다.
아래의 문서를 따라가서 API 토큰을 받은 뒤 Helm 을 통해 배포하면 된다.
슬랙 앱 설정 : SLACKAPIBOT_TOKEN 과 SLACKAPIAPP_TOKEN 생성 - Docs
export SLACK_API_BOT_TOKEN='xoxb-3546114861781-5244848054375-z6NLuaxuXQCoF2EUtdTrIcCI'
export SLACK_API_APP_TOKEN='xapp-1-A057PRTU2SG-5261880598308-6b1160cf0c7eabb676bc5a941380455dd8960b6723e0a5487987842c5ae7f701'
아래는 Helm 배포
# repo 추가
helm repo add botkube https://charts.botkube.io
helm repo update
# 변수 지정
export ALLOW_KUBECTL=true
export ALLOW_HELM=true
export SLACK_CHANNEL_NAME=webhook3

#
cat <<EOT > botkube-values.yaml
actions:
  'describe-created-resource': # kubectl describe
    enabled: true
  'show-logs-on-error': # kubectl logs
    enabled: true

executors:
  k8s-default-tools:
    botkube/helm:
      enabled: true
    botkube/kubectl:
      enabled: true
EOT

# 설치
helm install --version **v1.0.0** botkube --namespace botkube --create-namespace \
--set communications.default-group.socketSlack.enabled=true \
--set communications.default-group.socketSlack.channels.default.name=${SLACK_CHANNEL_NAME} \
--set communications.default-group.socketSlack.appToken=${SLACK_API_APP_TOKEN} \
--set communications.default-group.socketSlack.botToken=${SLACK_API_BOT_TOKEN} \
--set settings.clusterName=${CLUSTER_NAME} \
--set 'executors.k8s-default-tools.botkube/kubectl.enabled'=${ALLOW_KUBECTL} \
--set 'executors.k8s-default-tools.botkube/helm.enabled'=${ALLOW_HELM} \
-f **botkube-values.yaml** botkube/botkube

# 삭제
**$helm uninstall botkube --namespace botkube**Docs에서 사용과 관련된 내용을 자세히 확인할 수 있다.
helm으로 삭제! helm uninstall botkube --namespace botkube
프로메테우스-스택
프로메테우스는 CNCF 프로젝트 중 하나로 오픈소스 모니터링 시스템이다. 다른 모니터링 시스템과 구별되는 특징은 아래와 같다.
- 다차원 데이터 모델
- PromQL 쿼리
- 단일 서버 노드
- HTTP Pull model
- Pushing time series (push gate way )
- 타겟 확인(서비스 검색 or 정적)
- 다양한 모드의 대시보드 및 그래프 지원
- Federation 을 사용해서, 현재 프로메테우스 서버로 다른 프로메테우스 서버에서 저장된 시계열을 스크랩할 수 있다.
Federation 을 통해 다중 클러스터 환경에서 여러 클라이언트 프로메테우스 서버에 저장된 데이터를 가져오고 실시간 경고처리가 가능하지만, 이 방식은 대용량 전용 볼륨 필요, 장애시 데이터 복구 힘듬, 데이터증가로 인한 중앙 프로메테우스 서버의 부하가 발생할 수 있다. 그렇기에 Thanos를 사용하여 이런 문제를 처리할 수 있다.
Thanos는 Prometheus 고가용성 및 Long-Term 스토리지 기능을 제공한다. 또한 Thanos를 사용하면 여러 Prometheus 대상의 데이터를 집계하고 단일 쿼리 엔드 포인트에서 쿼리 할 수 있다. Prometheus 에서 발생할 수 있는 메트릭 중복을 자동으로 처리 할 수 있다.
아래는 Thanos에 대한 아키텍처이다.
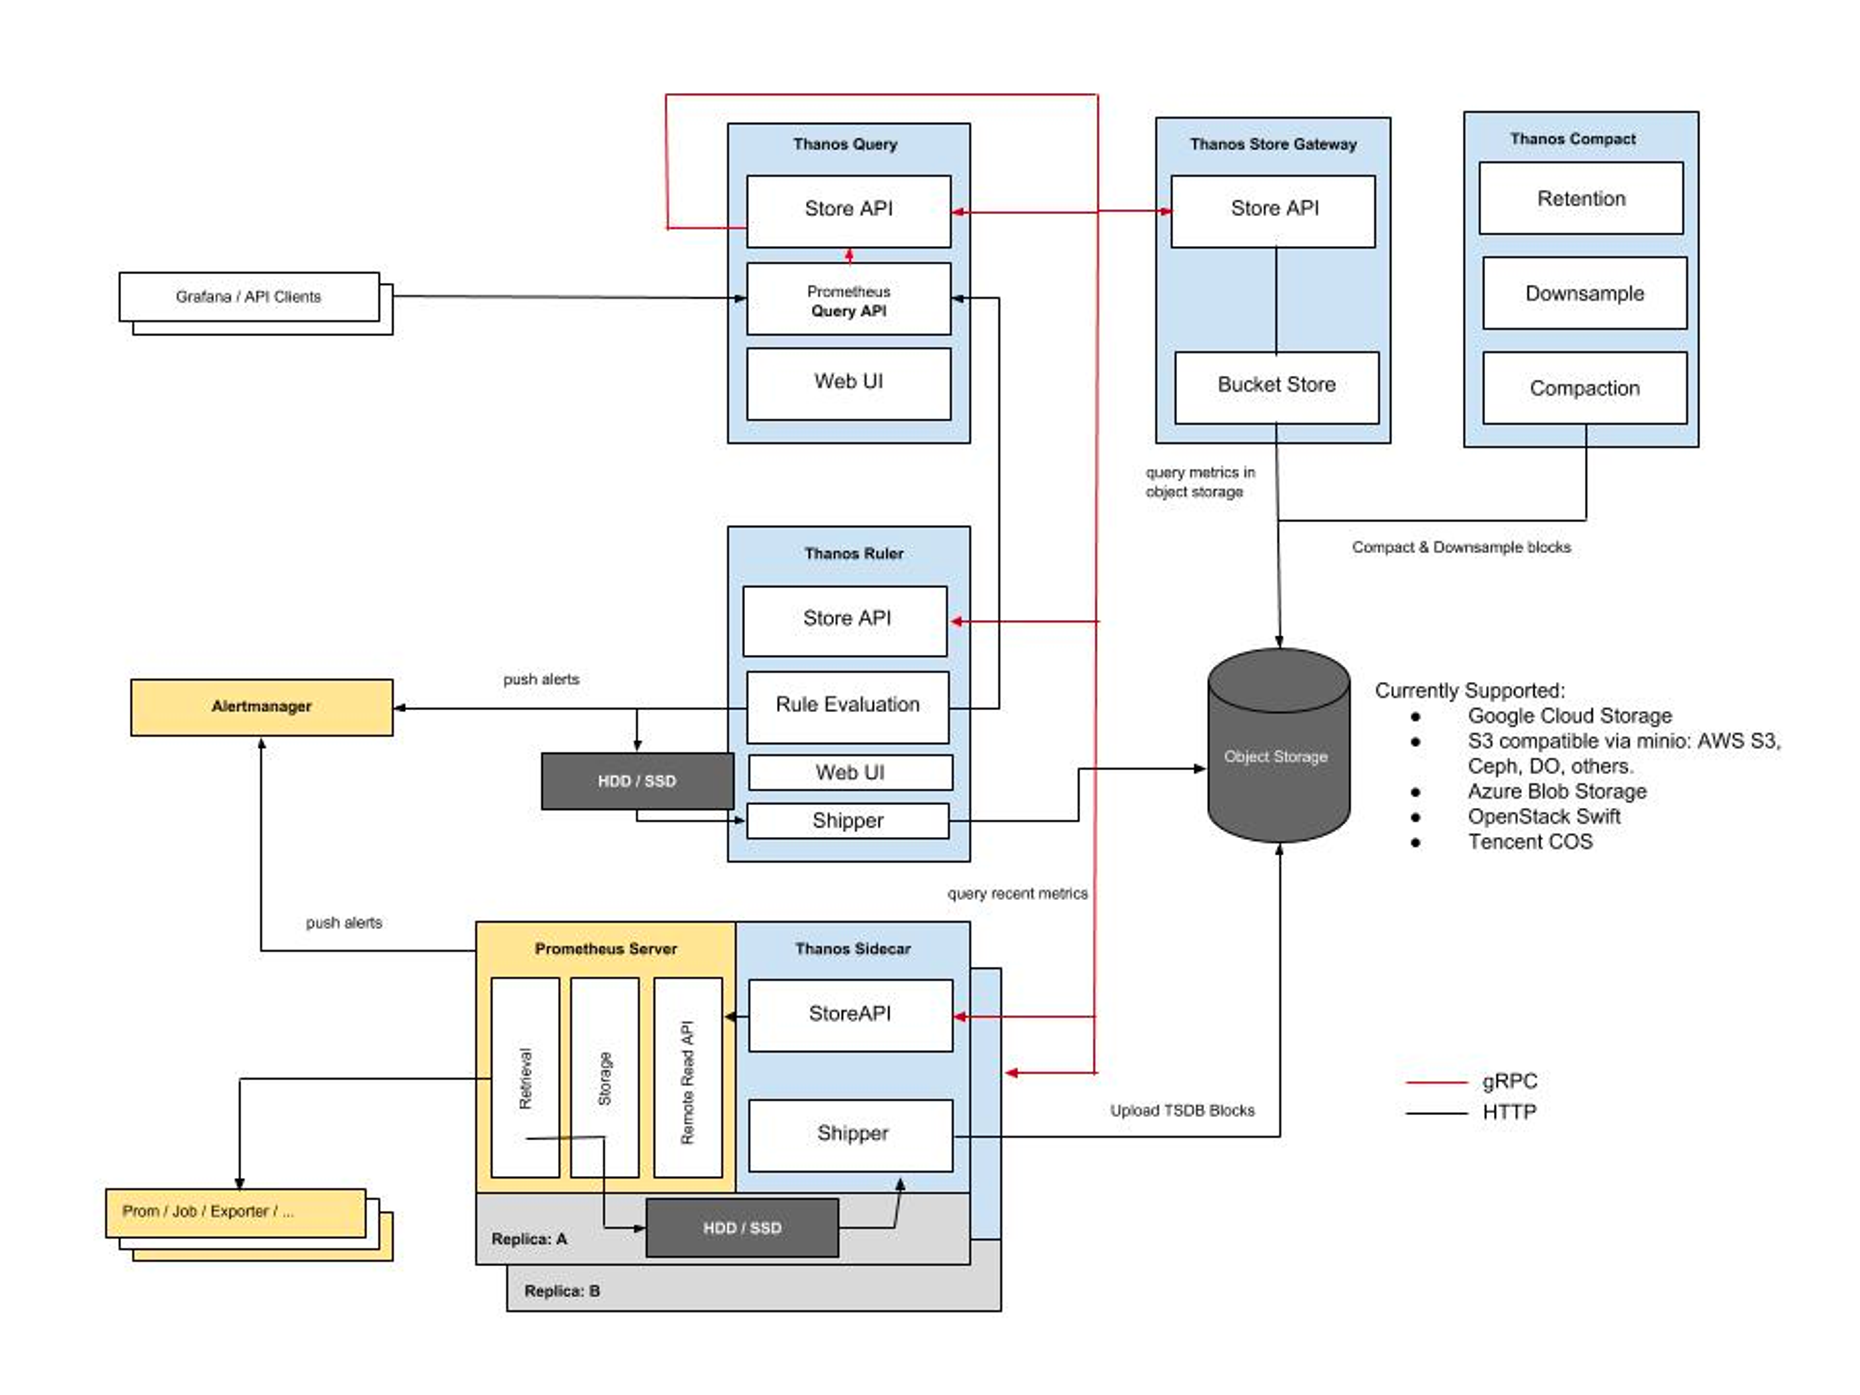
아래는 프로메테우스 스택과 관련된 아키텍처이며, 프로메테우스에 대한 자세한 정보는 GitHub에서 확인할 수 있다.
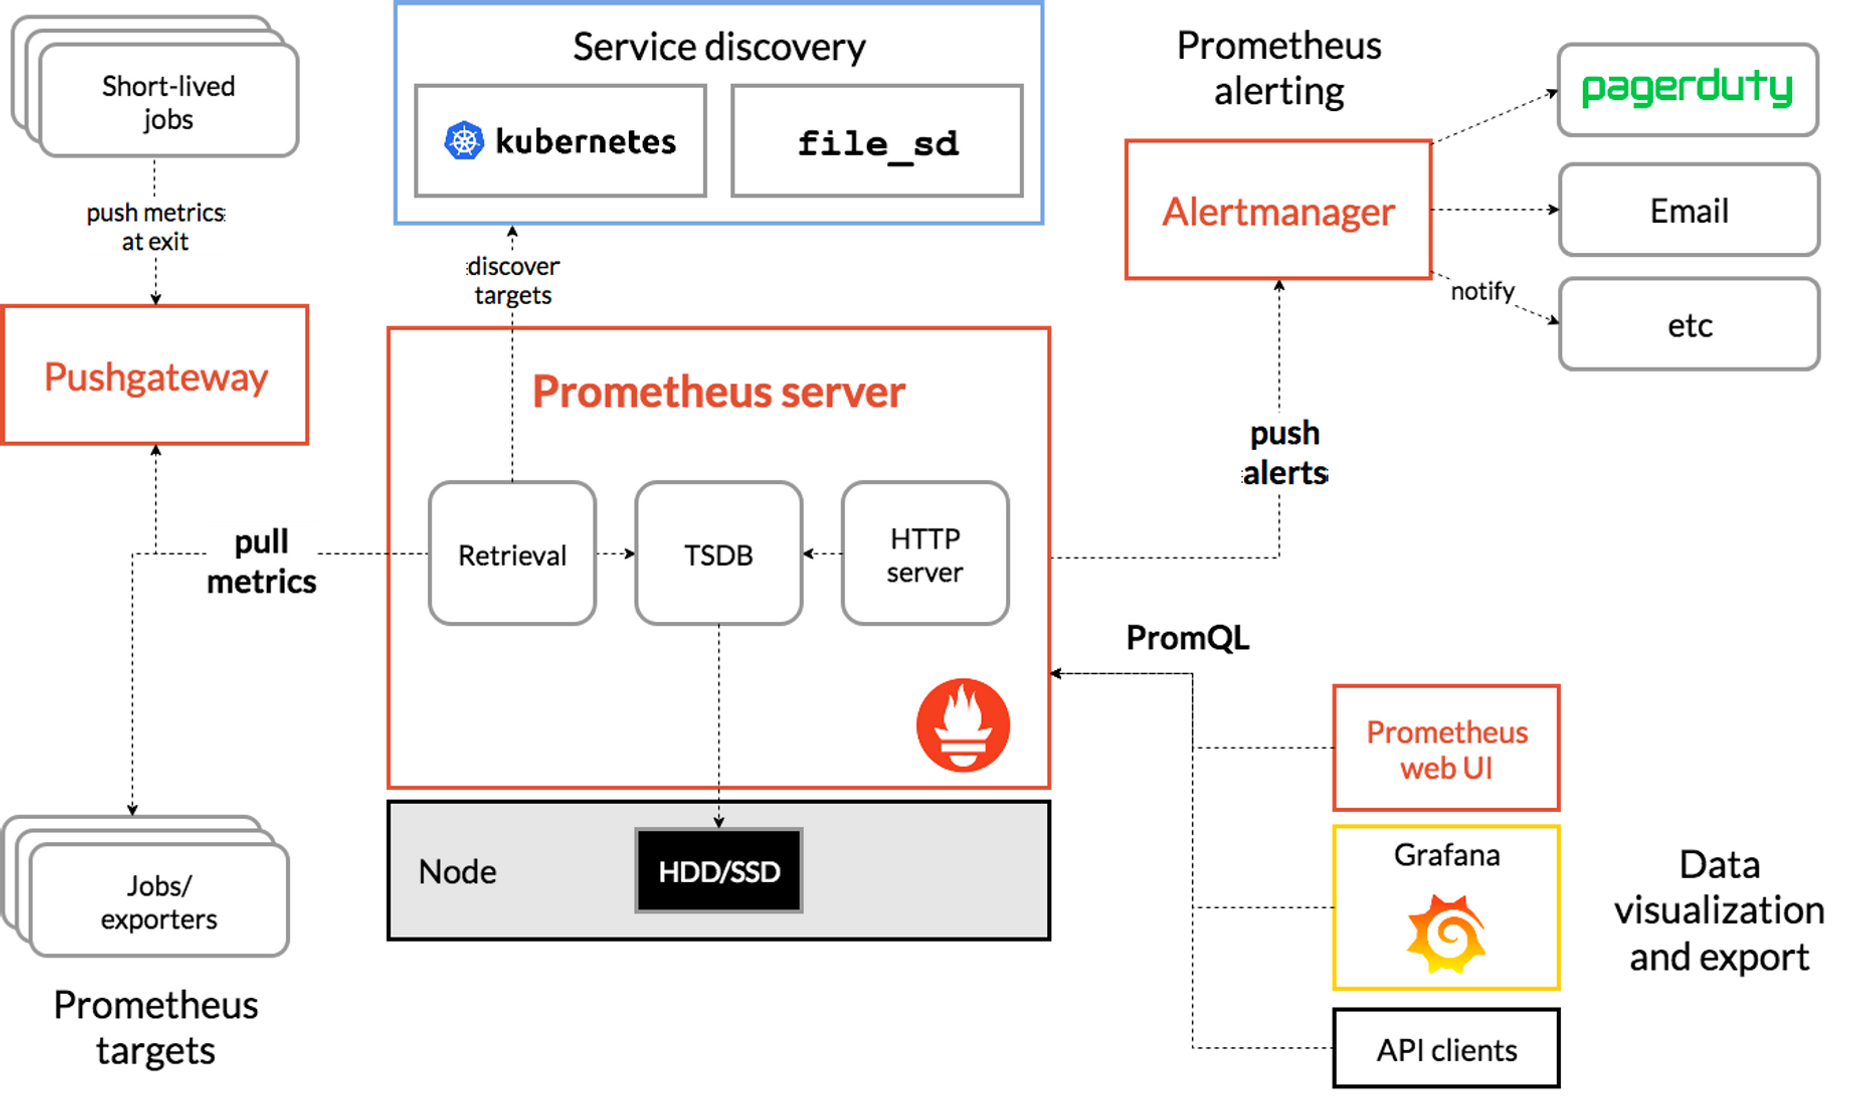
이제 관련 실습을 진행했다.
아래는 helm으로 배포하는 명령어이다.
$CERT_ARN=aws acm list-certificates --query 'CertificateSummaryList[].CertificateArn[]' --output text
$echo $CERT_ARN
arn:aws:acm:ap-northeast-2:871103481195:certificate/..
$helm repo add prometheus-community https://prometheus-community.github.io/helm-charts
"prometheus-community" has been added to your repositories
cat <<EOT > monitor-values.yaml
**prometheus**:
  prometheusSpec:
    podMonitorSelectorNilUsesHelmValues: false
    serviceMonitorSelectorNilUsesHelmValues: false
    retention: 5d
    retentionSize: "10GiB"

  ingress:
    enabled: true
    ingressClassName: alb
    hosts:
      - prometheus.$MyDomain
    paths:
      - /*
    annotations:
      alb.ingress.kubernetes.io/scheme: internet-facing
      alb.ingress.kubernetes.io/target-type: ip
      alb.ingress.kubernetes.io/listen-ports: '[{"HTTPS":443}, {"HTTP":80}]'
      alb.ingress.kubernetes.io/certificate-arn: $CERT_ARN
      alb.ingress.kubernetes.io/success-codes: 200-399
      **alb.ingress.kubernetes.io/load-balancer-name: myeks-ingress-alb
      alb.ingress.kubernetes.io/group.name: study
      alb.ingress.kubernetes.io/ssl-redirect: '443'**

**grafana**:
  defaultDashboardsTimezone: Asia/Seoul
  adminPassword: prom-operator

  ingress:
    enabled: true
    ingressClassName: alb
    hosts:
      - grafana.$MyDomain
    paths:
      - /*
    annotations:
      alb.ingress.kubernetes.io/scheme: internet-facing
      alb.ingress.kubernetes.io/target-type: ip
      alb.ingress.kubernetes.io/listen-ports: '[{"HTTPS":443}, {"HTTP":80}]'
      alb.ingress.kubernetes.io/certificate-arn: $CERT_ARN
      alb.ingress.kubernetes.io/success-codes: 200-399
      **alb.ingress.kubernetes.io/load-balancer-name: myeks-ingress-alb
      alb.ingress.kubernetes.io/group.name: study
      alb.ingress.kubernetes.io/ssl-redirect: '443'

defaultRules:
  create: false
kubeControllerManager:
  enabled: false
kubeEtcd:
  enabled: false
kubeScheduler:
  enabled: false**
alertmanager:
  enabled: false

# alertmanager:
#   ingress:
#     enabled: true
#     ingressClassName: alb
#     hosts:
#       - alertmanager.$MyDomain
#     paths:
#       - /*
#     annotations:
#       alb.ingress.kubernetes.io/scheme: internet-facing
#       alb.ingress.kubernetes.io/target-type: ip
#       alb.ingress.kubernetes.io/listen-ports: '[{"HTTPS":443}, {"HTTP":80}]'
#       alb.ingress.kubernetes.io/certificate-arn: $CERT_ARN
#       alb.ingress.kubernetes.io/success-codes: 200-399
#       alb.ingress.kubernetes.io/load-balancer-name: myeks-ingress-alb
#       alb.ingress.kubernetes.io/group.name: study
#       alb.ingress.kubernetes.io/ssl-redirect: '443'
EOT
# 배포
$helm install kube-prometheus-stack prometheus-community/kube-prometheus-stack --version 45.27.2 \
> --set prometheus.prometheusSpec.scrapeInterval='15s' --set prometheus.prometheusSpec.evaluationInterval='15s' \
> -f monitor-values.yaml --namespace monitoring

NAME: kube-prometheus-stack
LAST DEPLOYED: Thu May 18 21:23:45 2023
NAMESPACE: monitoring
STATUS: deployed
REVISION: 1
NOTES:
kube-prometheus-stack has been installed. Check its status by running:
  kubectl --namespace monitoring get pods -l "release=kube-prometheus-stack"

Visit https://github.com/prometheus-operator/kube-prometheus for instructions on how to create & configure Alertmanager and Prometheus instances using the Operator.

# 배포 확인
$kubectl get prometheus,servicemonitors -n monitoring
NAME                                                                VERSION   DESIRED   READY   RECONCILED   AVAILABLE   AGE
prometheus.monitoring.coreos.com/kube-prometheus-stack-prometheus   v2.42.0   1         1       True         True        119s

NAME                                                                                  AGE
servicemonitor.monitoring.coreos.com/kube-prometheus-stack-apiserver                  119s
servicemonitor.monitoring.coreos.com/kube-prometheus-stack-coredns                    119s
servicemonitor.monitoring.coreos.com/kube-prometheus-stack-grafana                    119s
servicemonitor.monitoring.coreos.com/kube-prometheus-stack-kube-proxy                 119s
servicemonitor.monitoring.coreos.com/kube-prometheus-stack-kube-state-metrics         119s
servicemonitor.monitoring.coreos.com/kube-prometheus-stack-kubelet                    119s
servicemonitor.monitoring.coreos.com/kube-prometheus-stack-operator                   119s
servicemonitor.monitoring.coreos.com/kube-prometheus-stack-prometheus                 119s
servicemonitor.monitoring.coreos.com/kube-prometheus-stack-prometheus-node-exporter   119s
$kubectl get crd | grep monitoring
alertmanagerconfigs.monitoring.coreos.com    2023-05-18T12:23:42Z
alertmanagers.monitoring.coreos.com          2023-05-18T12:23:43Z
podmonitors.monitoring.coreos.com            2023-05-18T12:23:43Z
probes.monitoring.coreos.com                 2023-05-18T12:23:43Z
prometheuses.monitoring.coreos.com           2023-05-18T12:23:44Z
prometheusrules.monitoring.coreos.com        2023-05-18T12:23:44Z
servicemonitors.monitoring.coreos.com        2023-05-18T12:23:44Z
thanosrulers.monitoring.coreos.com           2023-05-18T12:23:44Z

# 관련 리소스 확인
## 그라파나, 프로메테우스에 대한 리소스를 확인할 수 있다.
$kubectl get pod,pvc,svc,ingress -n monitoring                                           Thu May 18 21:25:23 2023

NAME                                                            READY   STATUS    RESTARTS   AGE
pod/kube-prometheus-stack-grafana-846b5c46f9-9l86n              3/3     Running   0          79s
pod/kube-prometheus-stack-kube-state-metrics-5d6578867c-phkwd   1/1     Running   0          79s
pod/kube-prometheus-stack-operator-74d474b47b-wk6bg             1/1     Running   0          79s
pod/kube-prometheus-stack-prometheus-node-exporter-78z6k        1/1     Running   0          79s
pod/kube-prometheus-stack-prometheus-node-exporter-dzx2g        1/1     Running   0          79s
pod/kube-prometheus-stack-prometheus-node-exporter-frwsh        1/1     Running   0	     79s
pod/prometheus-kube-prometheus-stack-prometheus-0               2/2     Running   0          74s

NAME                                                     TYPE        CLUSTER-IP       EXTERNAL-IP   PORT(S)    AGE
service/kube-prometheus-stack-grafana                    ClusterIP   10.100.168.56    <none>        80/TCP     79s
service/kube-prometheus-stack-kube-state-metrics         ClusterIP   10.100.103.103   <none>        8080/TCP   79s
service/kube-prometheus-stack-operator                   ClusterIP   10.100.239.101   <none>        443/TCP    79s
service/kube-prometheus-stack-prometheus                 ClusterIP   10.100.9.3       <none>        9090/TCP   79s
service/kube-prometheus-stack-prometheus-node-exporter   ClusterIP   10.100.244.218   <none>        9100/TCP   79s
service/prometheus-operated                              ClusterIP   None             <none>        9090/TCP   74s

NAME                                                         CLASS   HOSTS                       ADDRESS
                                   PORTS   AGE
ingress.networking.k8s.io/kube-prometheus-stack-grafana      alb     grafana.kaneawsdns.com      myeks-ingress-alb-61132493.
ap-northeast-2.elb.amazonaws.com   80	   79s
ingress.networking.k8s.io/kube-prometheus-stack-prometheus   alb     prometheus.kaneawsdns.com   myeks-ingress-alb-61132493.
ap-northeast-2.elb.amazonaws.com   80	   79s
HTTPS 규칙 확인
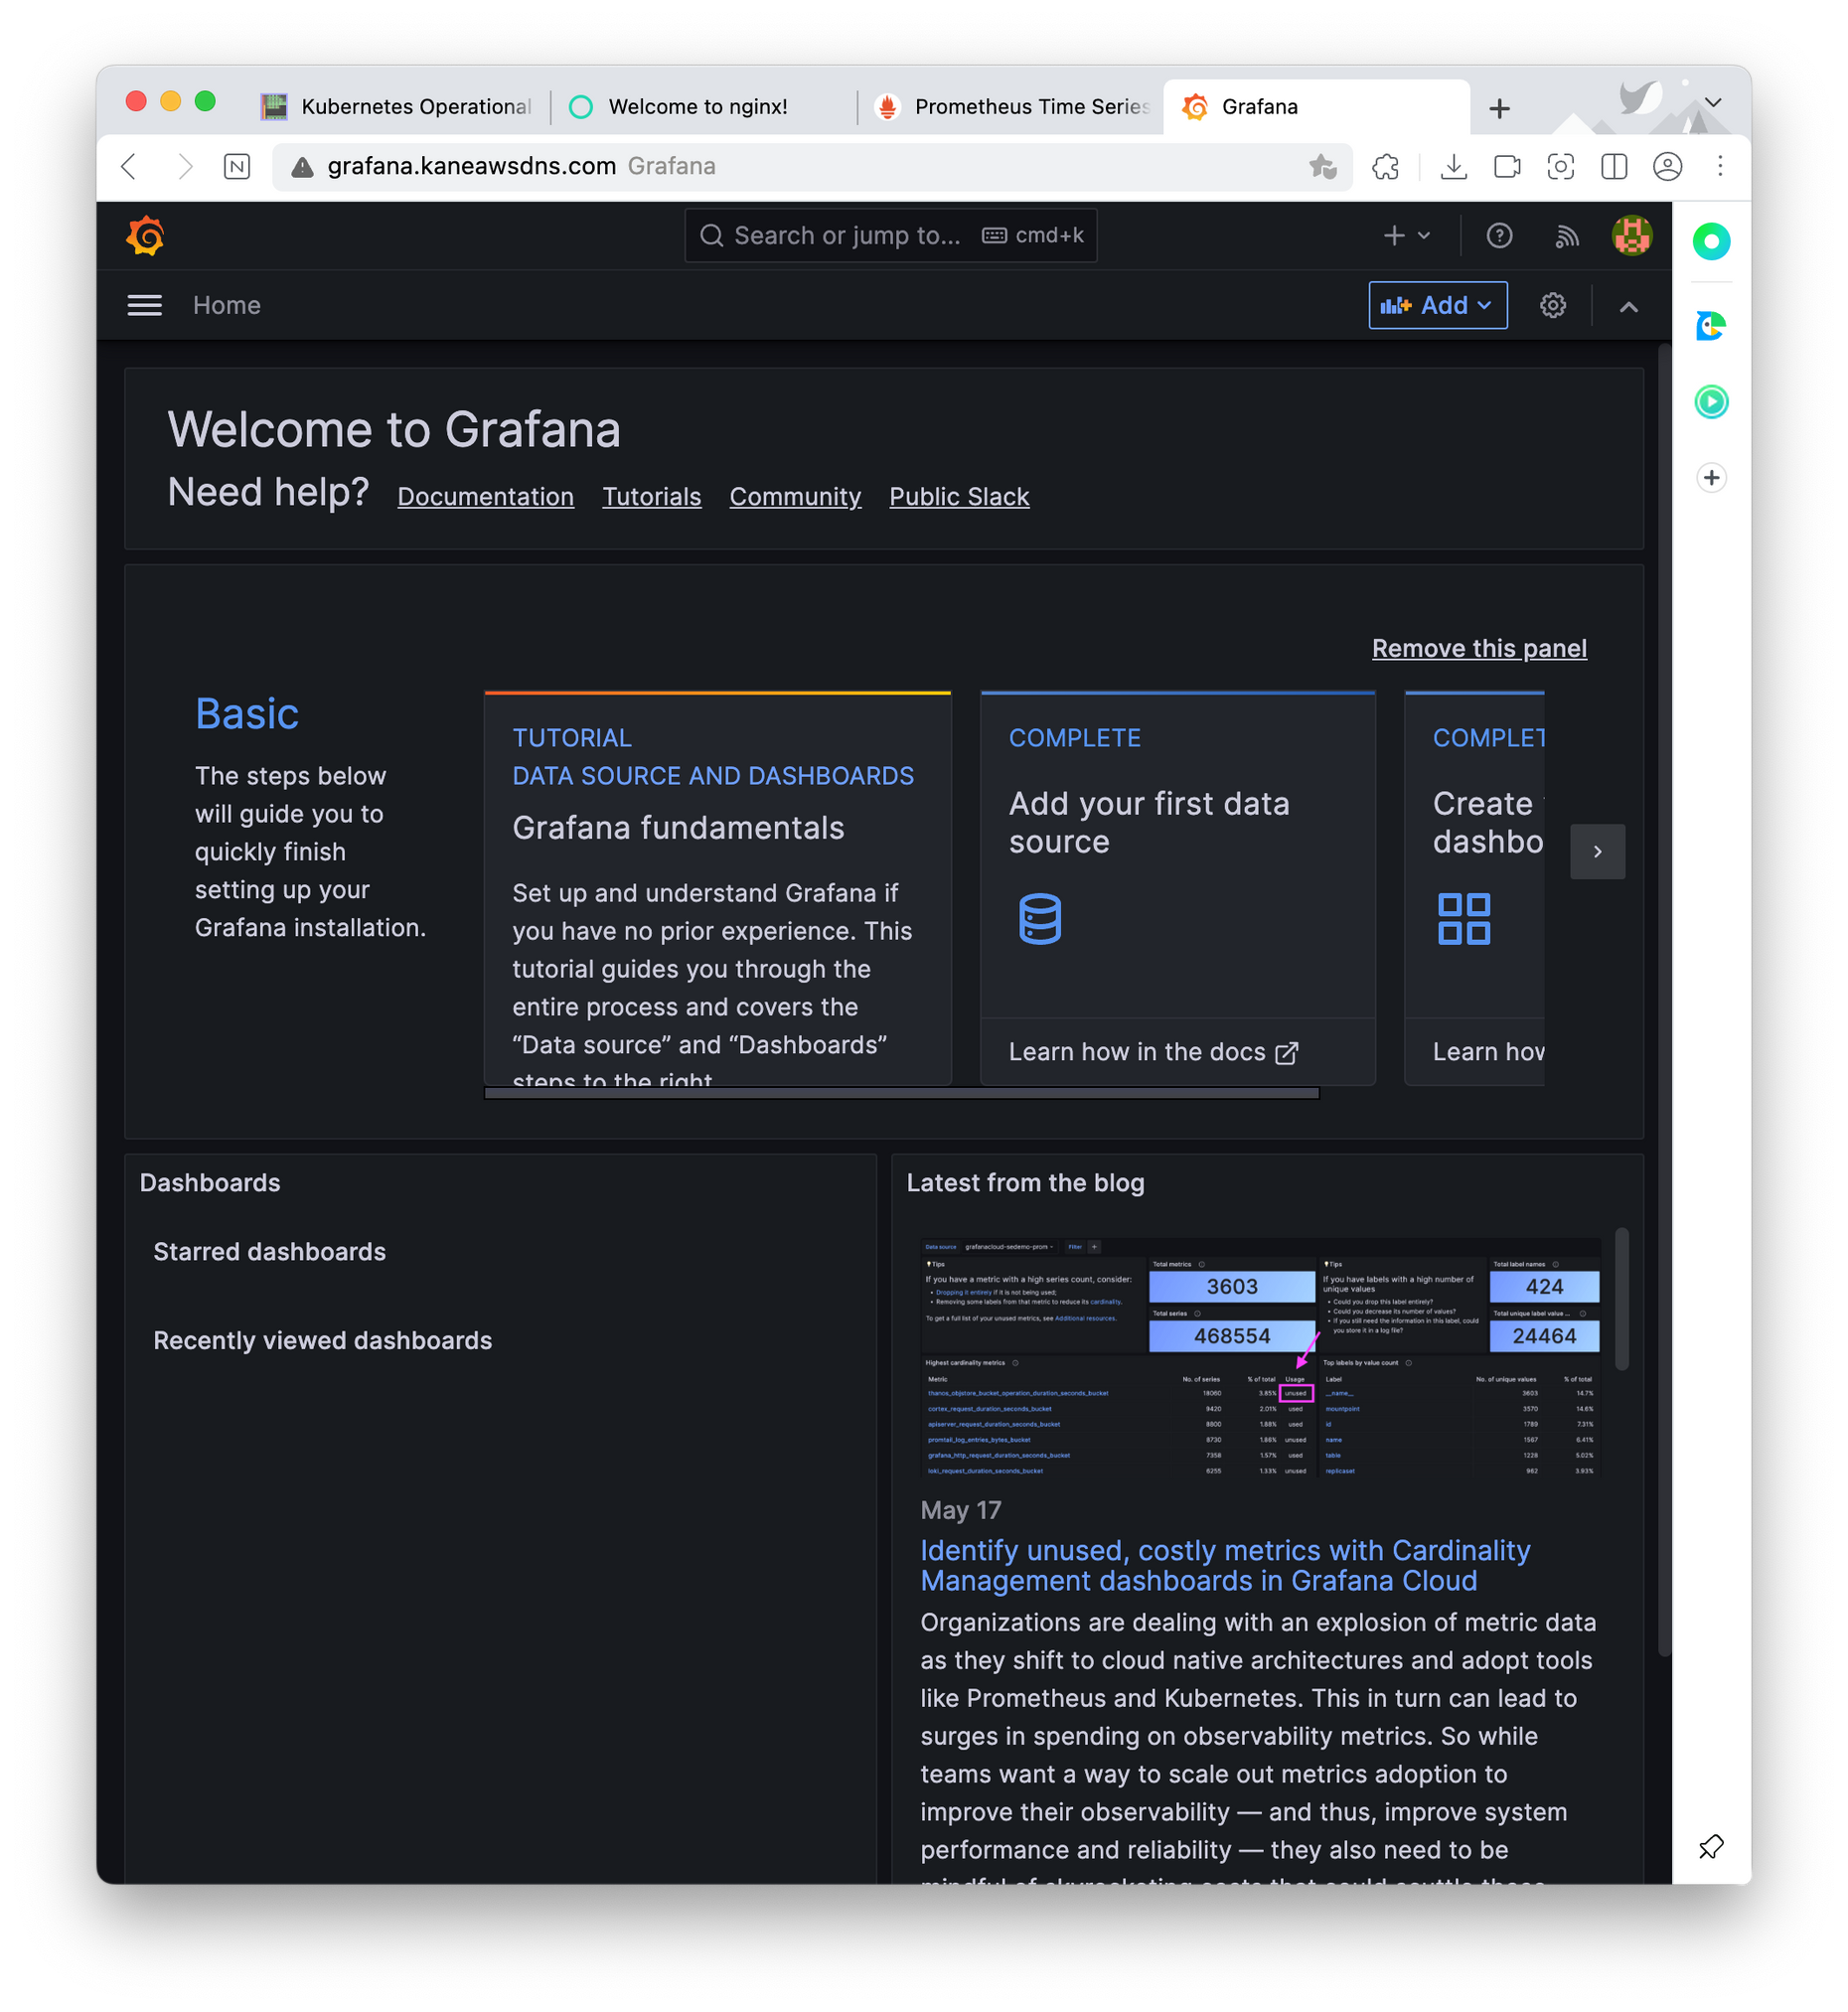
아래의 규칙대로 접속하여 그라파나와 프로메테우스에 접근할 수 있다.
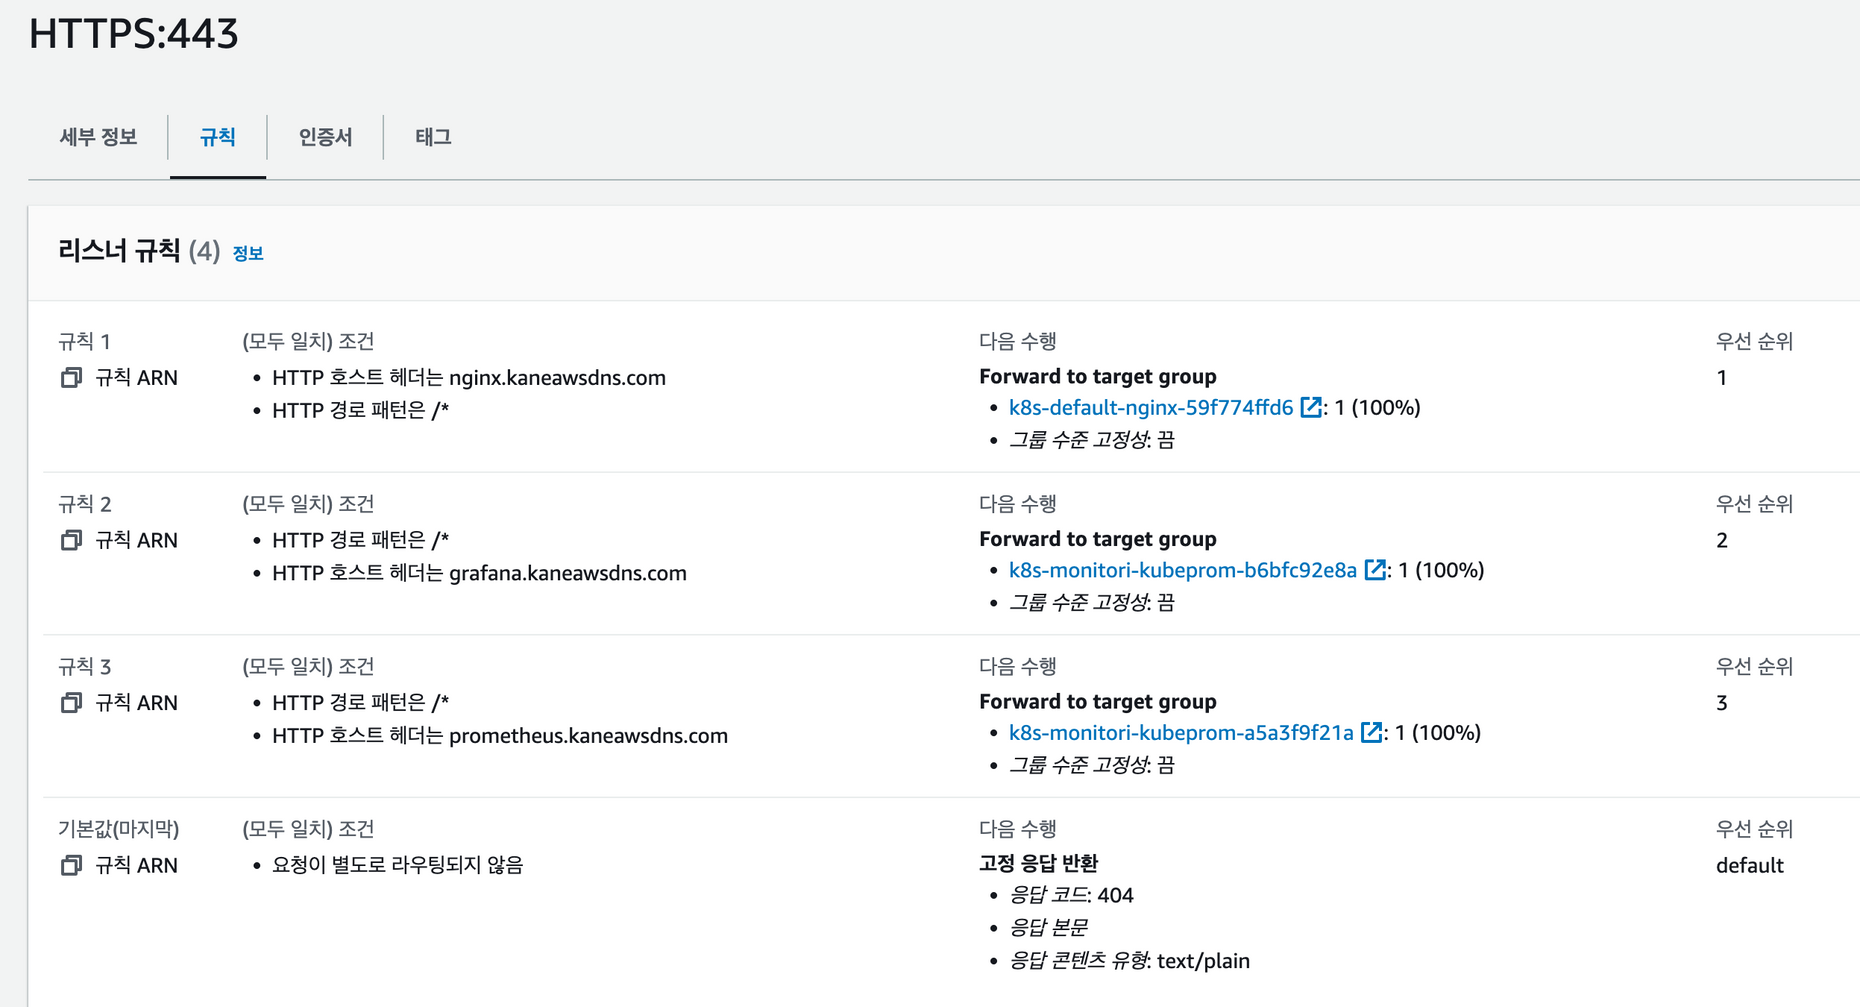
그라파나의 경우 위의, values.yaml 파일에서 비밀번호를 확인할 수 있고, 계정은 admin입니다.
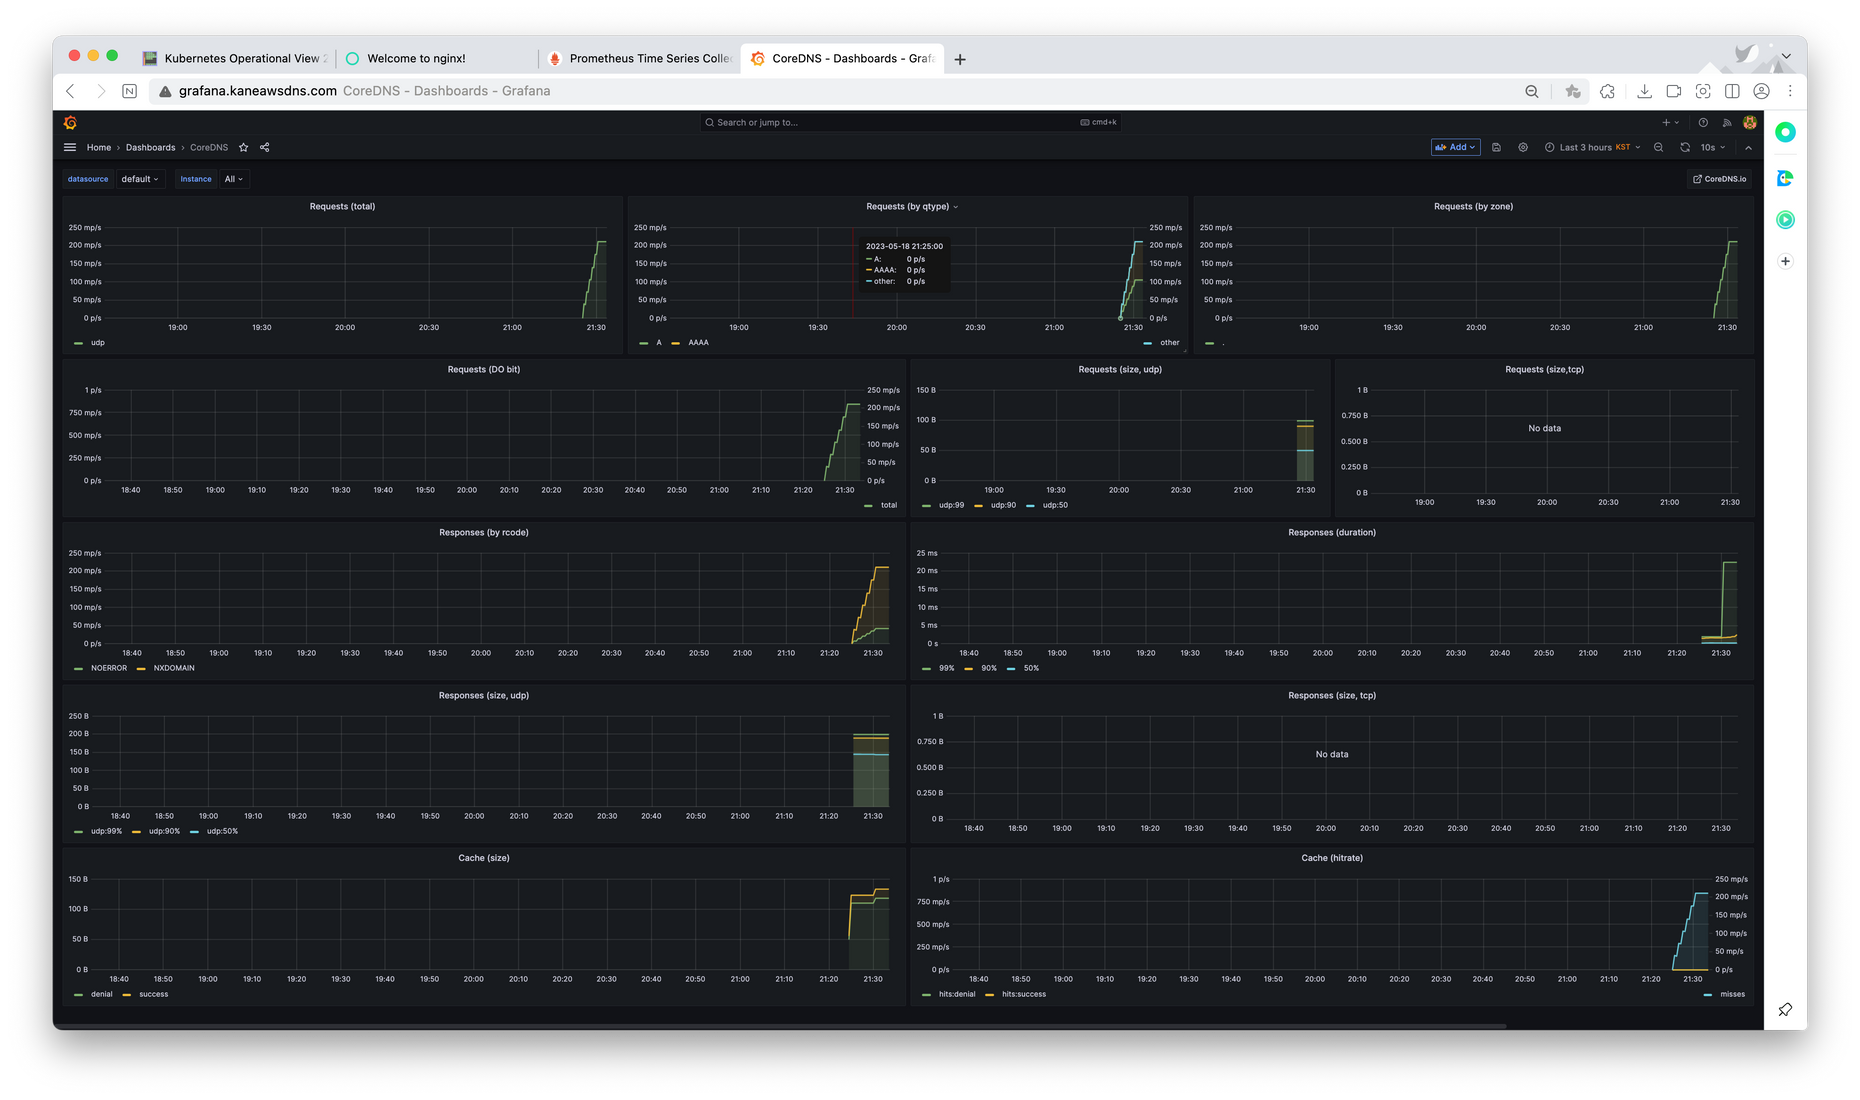
아래는 웹사이트 접속화면이다.
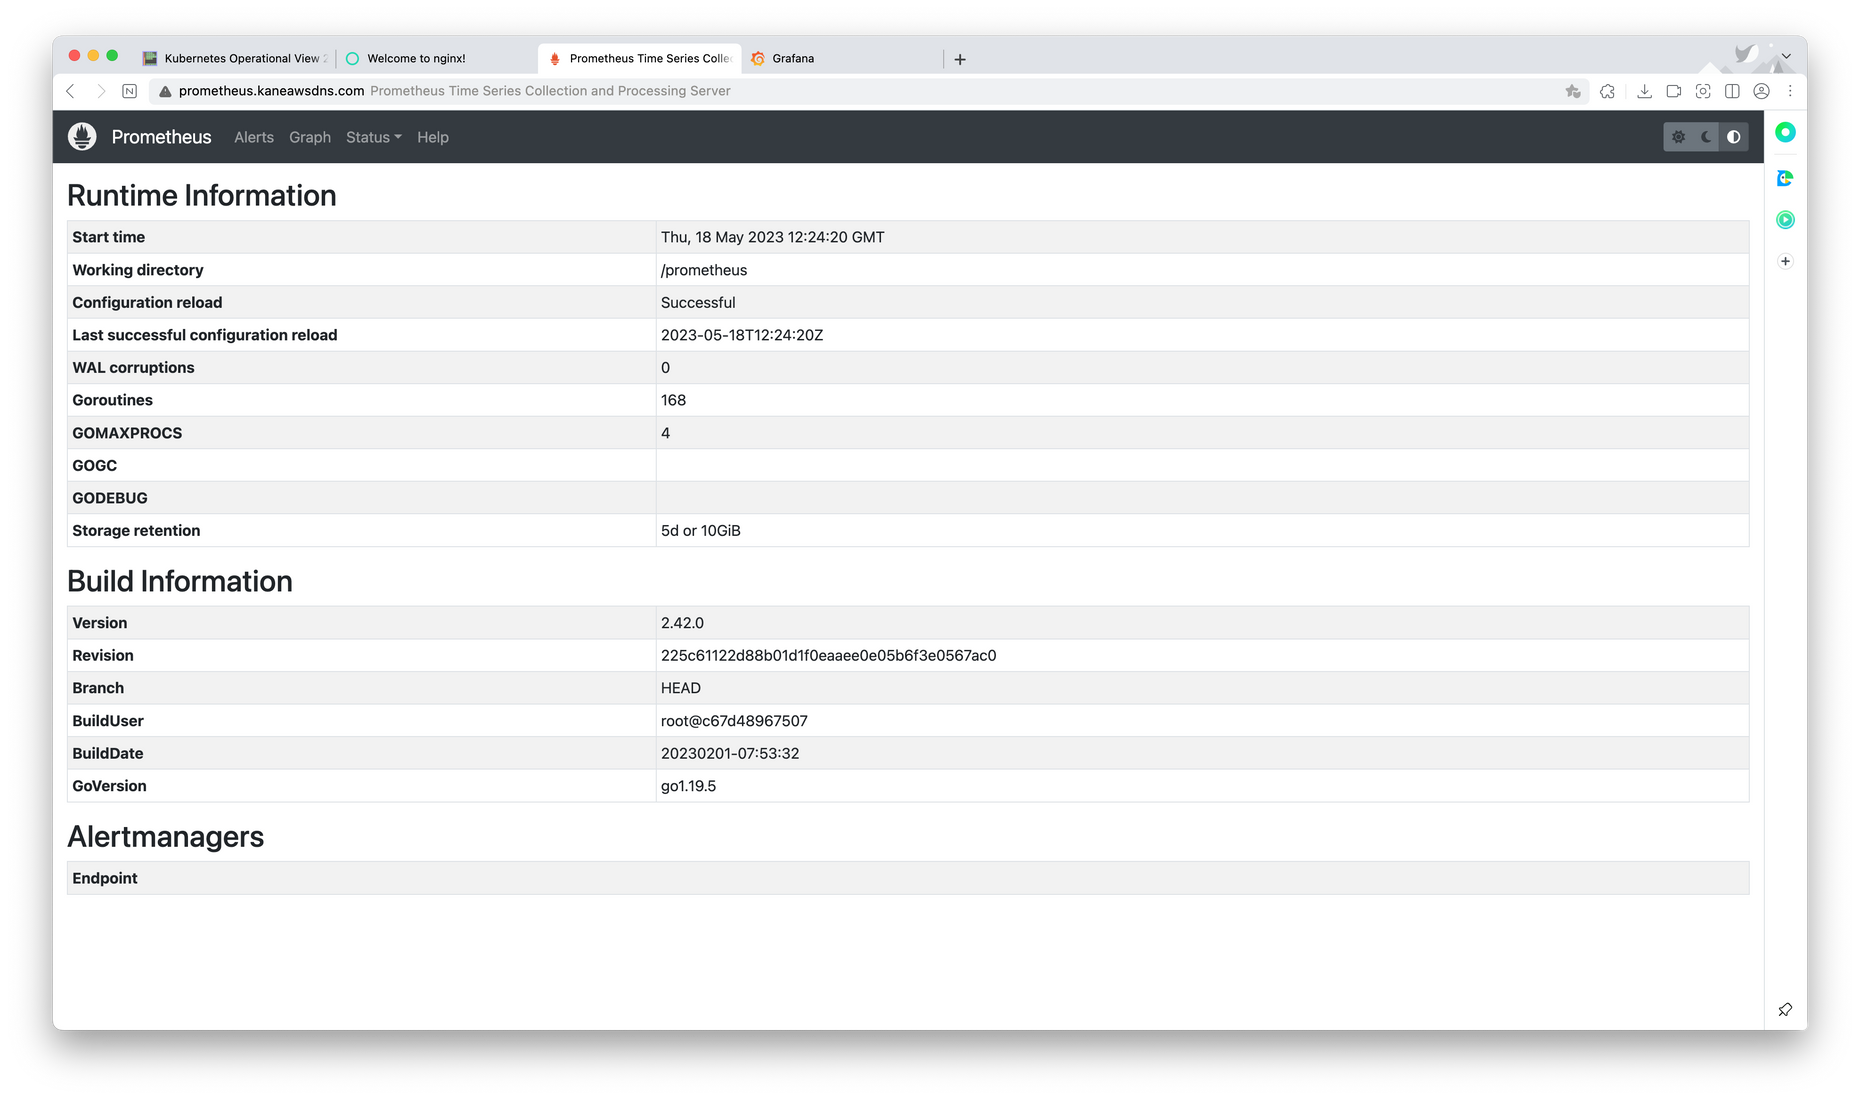
이후 사진들은 core dns에 대한 정보 모습이다.
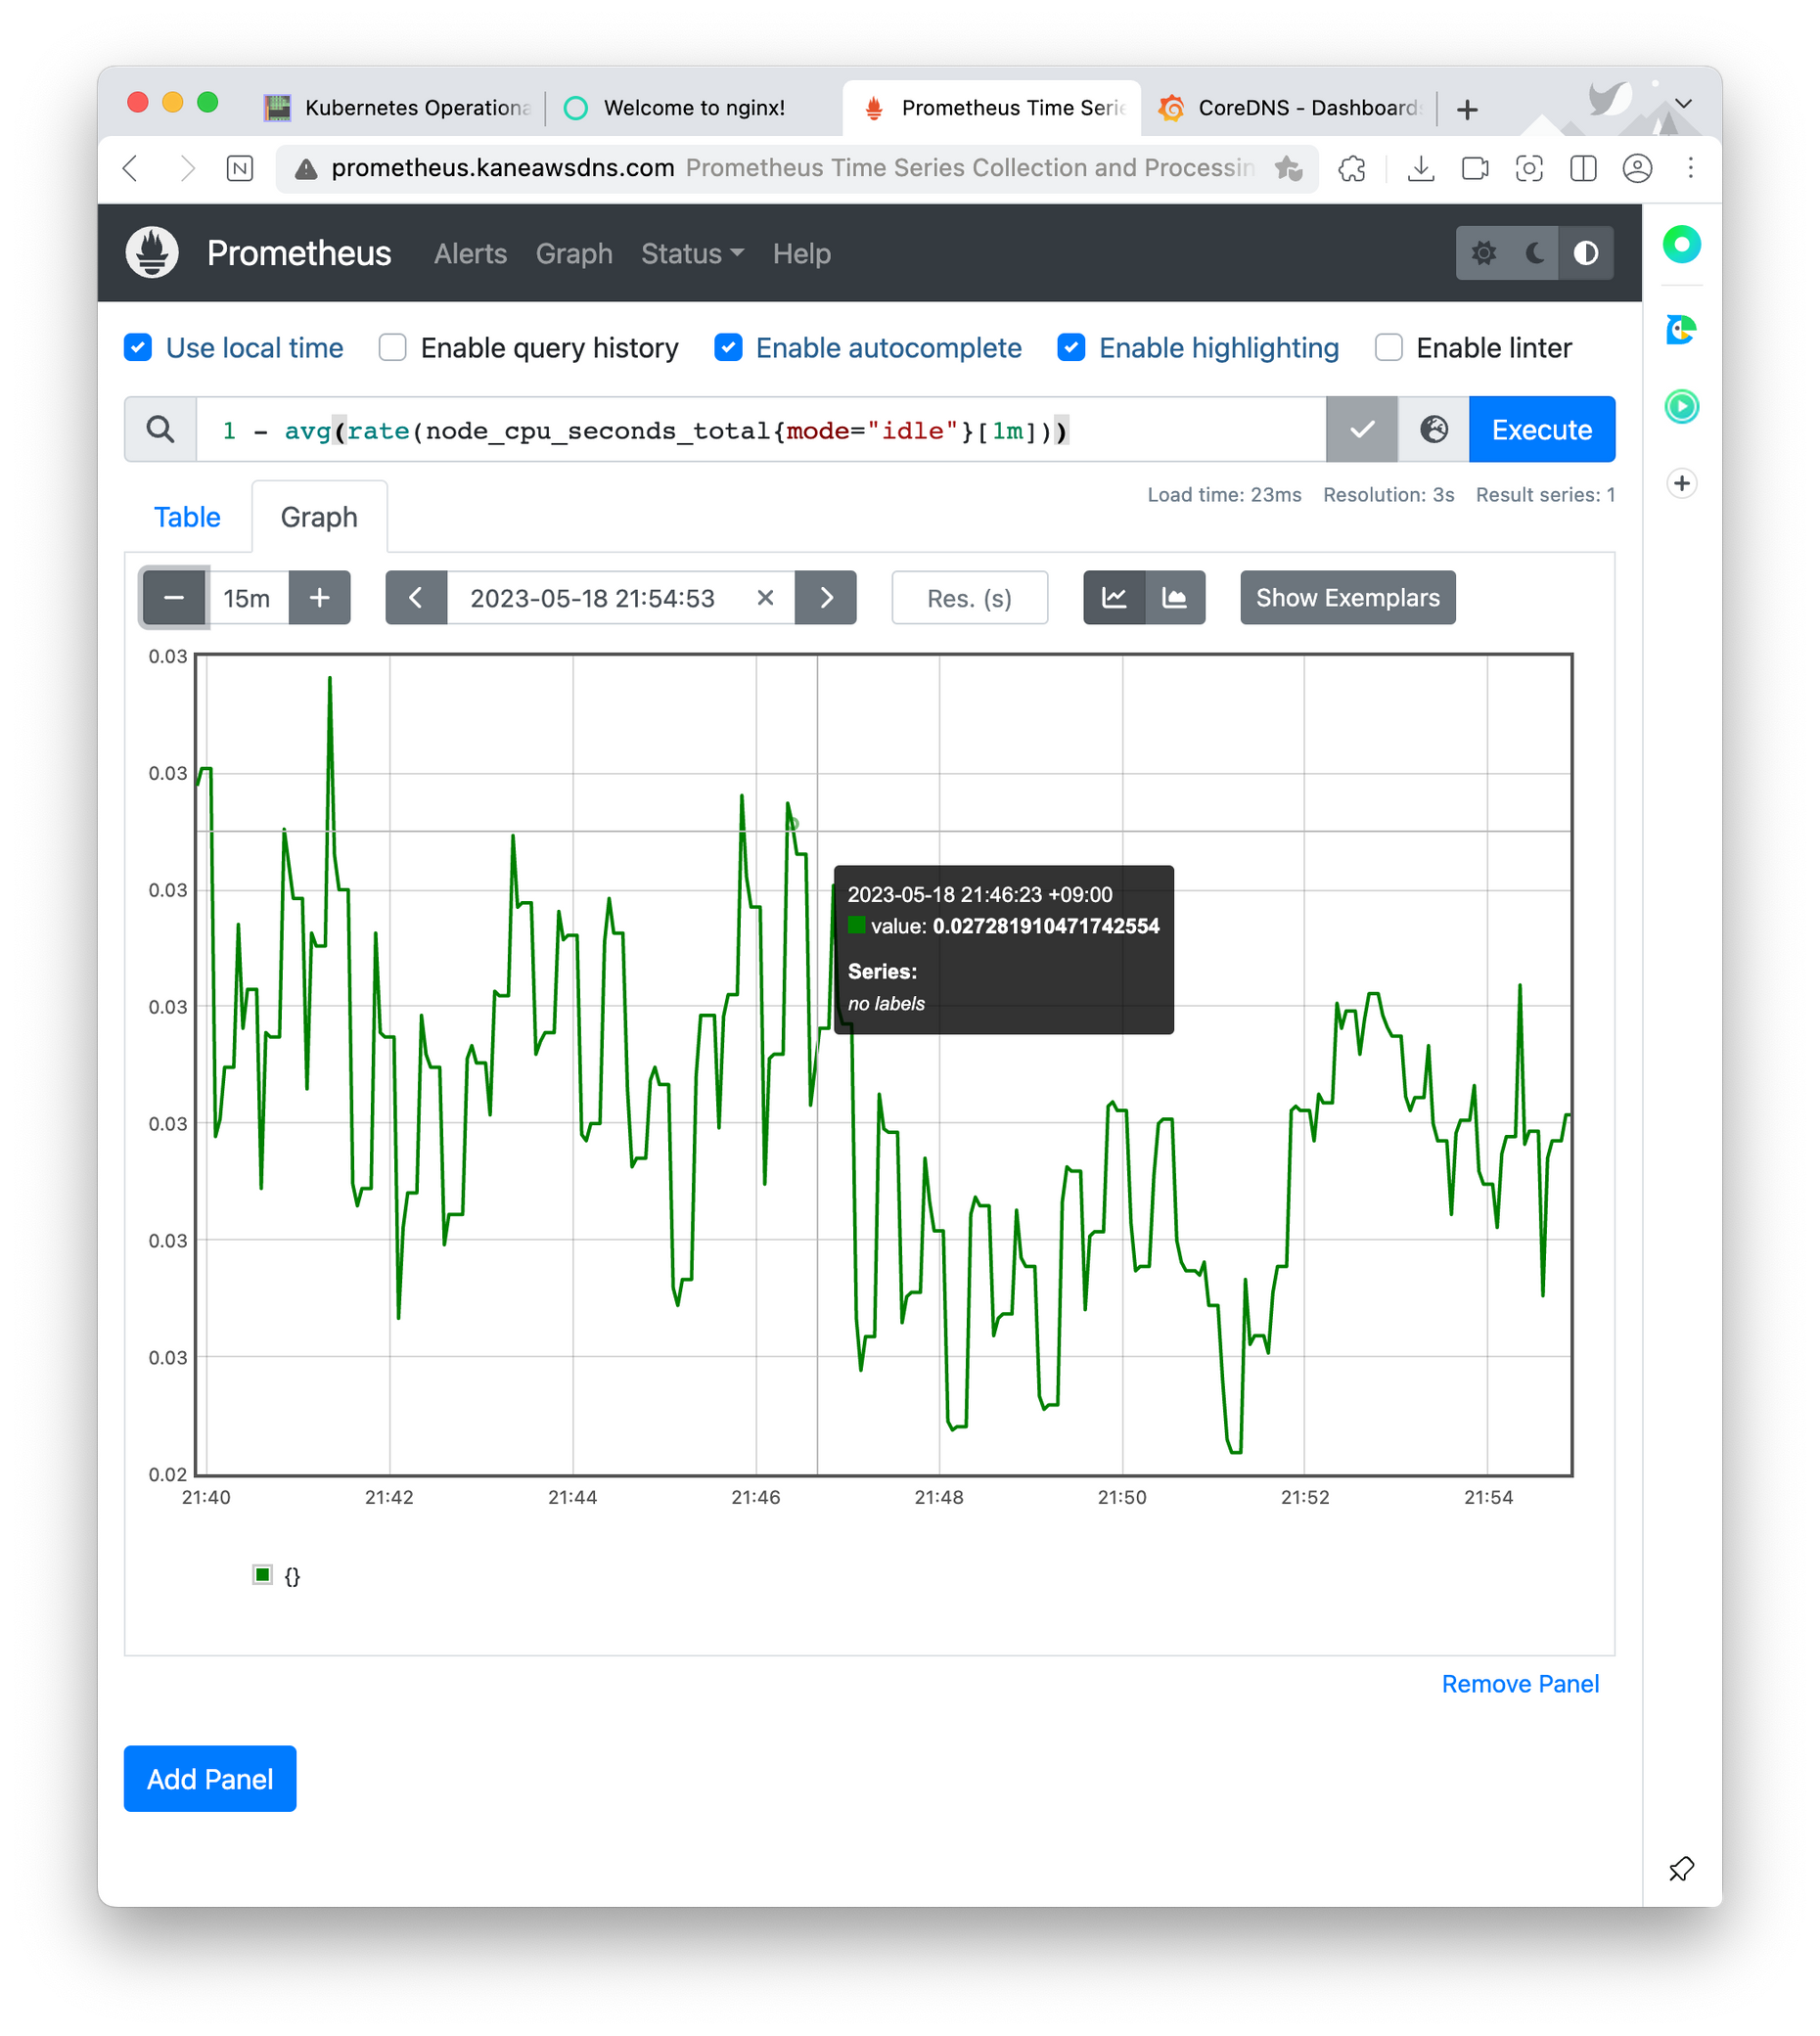
아래는 프로메테우스에 대한 정보
$kubectl get svc,ep -n monitoring kube-prometheus-stack-prometheus-node-exporter
NAME                                                     TYPE        CLUSTER-IP       EXTERNAL-IP   PORT(S)    AGE
service/kube-prometheus-stack-prometheus-node-exporter   ClusterIP   10.100.244.218   <none>        9100/TCP   12m
NAME                                                       ENDPOINTS                                                AGE
endpoints/kube-prometheus-stack-prometheus-node-exporter   192.168.1.181:9100,192.168.2.39:9100,192.168.3.43:9100   12m

$kubectl get ingress -n monitoring kube-prometheus-stack-prometheus
NAME                               CLASS   HOSTS                       ADDRESS                                                       PORTS   AGE
kube-prometheus-stack-prometheus   alb     prometheus.kaneawsdns.com   myeks-ingress-alb-61132493.ap-northeast-2.elb.amazonaws.com   80      13m
$kubectl describe ingress -n monitoring kube-prometheus-stack-prometheus
Name:             kube-prometheus-stack-prometheus
Labels:           app=kube-prometheus-stack-prometheus
                  app.kubernetes.io/instance=kube-prometheus-stack
                  app.kubernetes.io/managed-by=Helm
                  app.kubernetes.io/part-of=kube-prometheus-stack
                  app.kubernetes.io/version=45.27.2
                  chart=kube-prometheus-stack-45.27.2
                  heritage=Helm
                  release=kube-prometheus-stack
Namespace:        monitoring
Address:          myeks-ingress-alb-61132493.ap-northeast-2.elb.amazonaws.com
Ingress Class:    alb
Default backend:  <default>
Rules:
  Host                       Path  Backends
  ----                       ----  --------
  prometheus.kaneawsdns.com
                             /*   kube-prometheus-stack-prometheus:9090 (192.168.3.236:9090)
Annotations:                 alb.ingress.kubernetes.io/certificate-arn: arn:aws:acm:ap-northeast-2:871103481195:certificate/caddaf14-7069-44a8-9fc3-ec13047ef5a1
                             alb.ingress.kubernetes.io/group.name: study
                             alb.ingress.kubernetes.io/listen-ports: [{"HTTPS":443}, {"HTTP":80}]
                             alb.ingress.kubernetes.io/load-balancer-name: myeks-ingress-alb
                             alb.ingress.kubernetes.io/scheme: internet-facing
                             alb.ingress.kubernetes.io/ssl-redirect: 443
                             alb.ingress.kubernetes.io/success-codes: 200-399
                             alb.ingress.kubernetes.io/target-type: ip
                             meta.helm.sh/release-name: kube-prometheus-stack
                             meta.helm.sh/release-namespace: monitoring
Events:
  Type    Reason                  Age   From     Message
  ----    ------                  ----  ----     -------
  Normal  SuccessfullyReconciled  13m   ingress  Successfully reconciled
아래는 수많은 매트릭들 9100 port에서 확인가능하다.
ssh ec2-user@$N1 curl -s localhost:9100/metrics
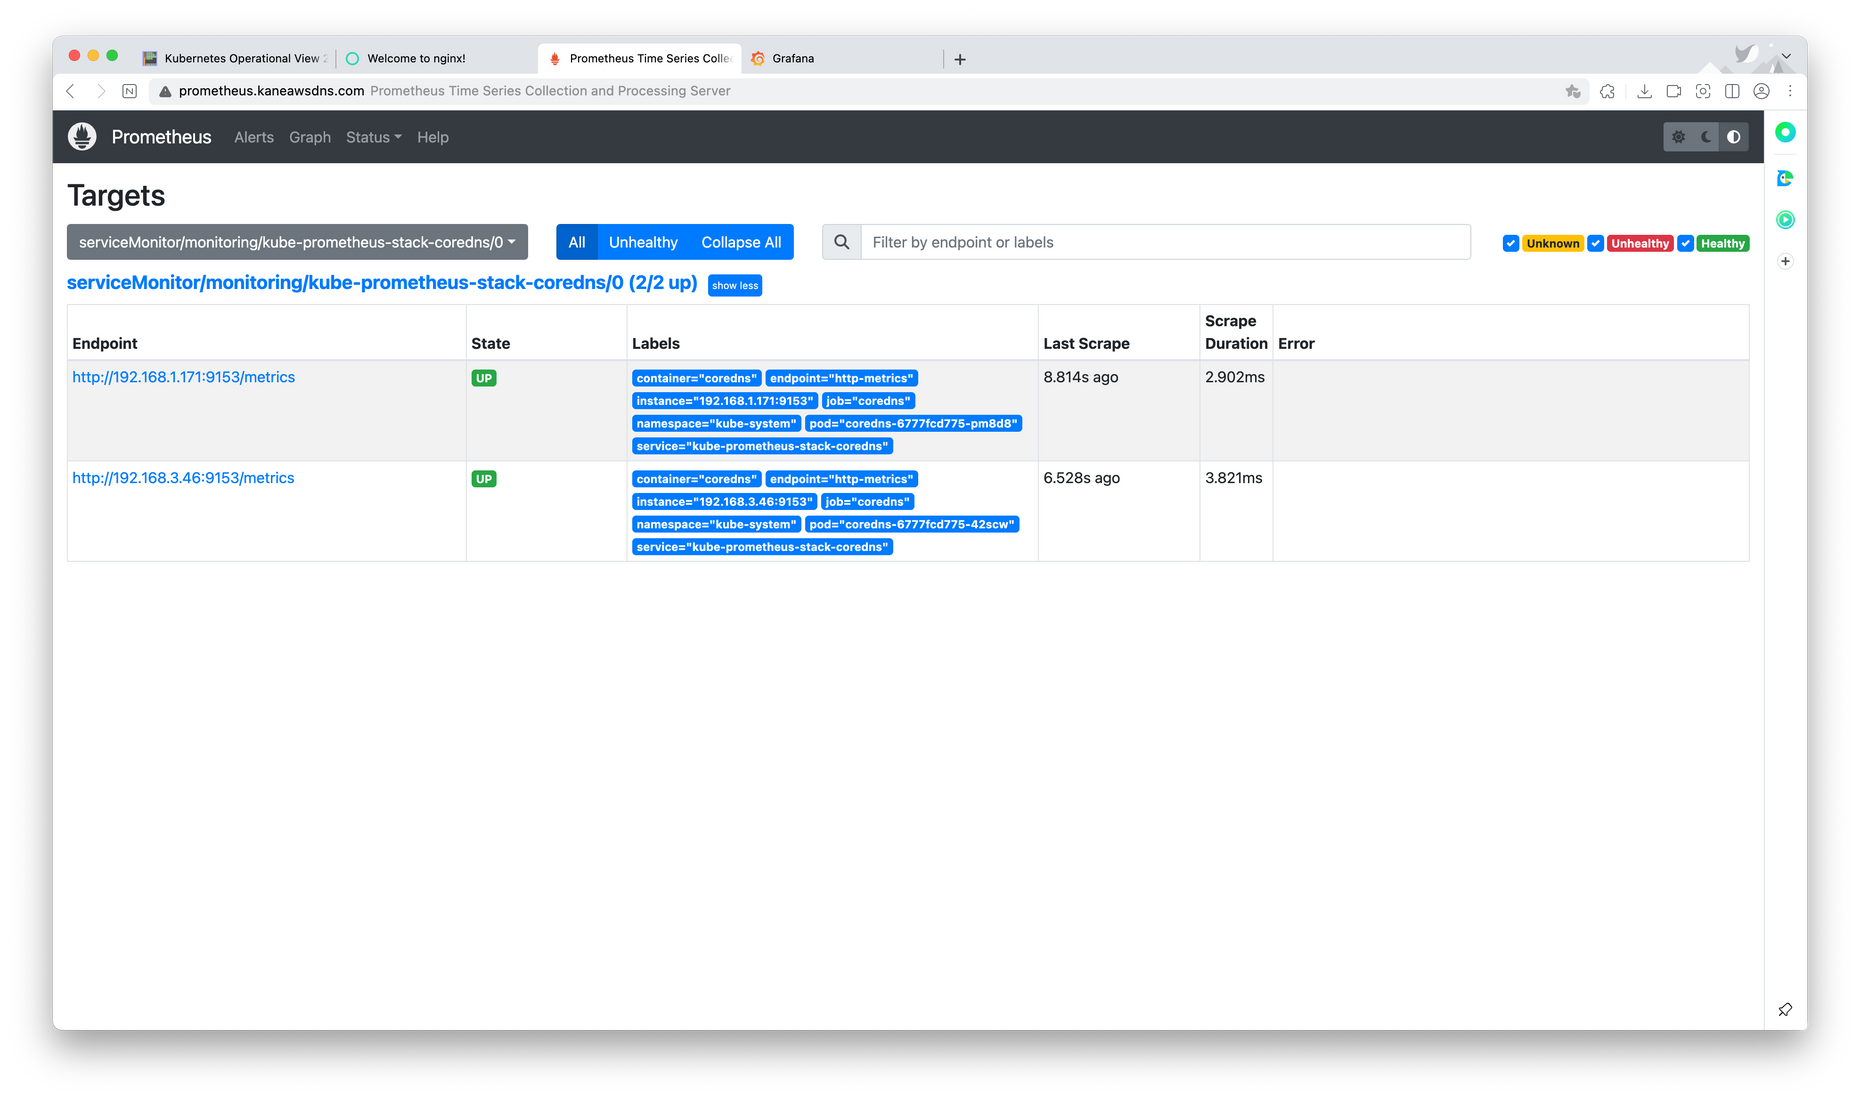
아래는 프로메테우스의 타겟그룹을 확인
#아래는 프로메테우스의 타겟그룹을 확인
$curl -s http://192.168.1.181:10249/metrics | tail -n 5
rest_client_response_size_bytes_bucket{host="0122641b7b2835e8936049a66cb8332a.gr7.ap-northeast-2.eks.amazonaws.com",verb="POST",le="4.194304e+06"} 1
rest_client_response_size_bytes_bucket{host="0122641b7b2835e8936049a66cb8332a.gr7.ap-northeast-2.eks.amazonaws.com",verb="POST",le="1.6777216e+07"} 1
rest_client_response_size_bytes_bucket{host="0122641b7b2835e8936049a66cb8332a.gr7.ap-northeast-2.eks.amazonaws.com",verb="POST",le="+Inf"} 1
rest_client_response_size_bytes_sum{host="0122641b7b2835e8936049a66cb8332a.gr7.ap-northeast-2.eks.amazonaws.com",verb="POST"} 626
rest_client_response_size_bytes_count{host="0122641b7b2835e8936049a66cb8332a.gr7.ap-northeast-2.eks.amazonaws.com",verb="POST"} 1
## 아래의 명령어는 한 단계 아래의 apiserver endpoint를 찾기위한 과정
# 엔드포인트 확인
$k get ep -A | grep stack
kube-system   kube-prometheus-stack-coredns                    192.168.1.171:9153,192.168.3.46:9153                                    20m
kube-system   kube-prometheus-stack-kube-proxy                 192.168.1.181:10249,192.168.2.39:10249,192.168.3.43:10249               20m
kube-system   kube-prometheus-stack-kubelet                    192.168.1.181:10250,192.168.2.39:10250,192.168.3.43:10250 + 6 more...   20m
monitoring    kube-prometheus-stack-grafana                    192.168.1.15:3000                                                       20m
monitoring    kube-prometheus-stack-kube-state-metrics         192.168.2.198:8080                                                      20m
monitoring    kube-prometheus-stack-operator                   192.168.2.244:10250                                                     20m
monitoring    kube-prometheus-stack-prometheus                 192.168.3.236:9090                                                      20m
monitoring    kube-prometheus-stack-prometheus-node-exporter   192.168.1.181:9100,192.168.2.39:9100,192.168.3.43:9100
$k get po -A -o wide | grep 192.168.1
kube-system   aws-node-fbjck                                              1/1     Running   0          112m   192.168.1.181   ip-192-168-1-181.ap-northeast-2.compute.internal   <none>           <none>
kube-system   coredns-6777fcd775-pm8d8                                    1/1     Running   0          110m   192.168.1.171   ip-192-168-1-181.ap-northeast-2.compute.internal   <none>           <none>
kube-system   ebs-csi-node-v7gqf                                          3/3     Running   0          108m   192.168.1.154   ip-192-168-1-181.ap-northeast-2.compute.internal   <none>           <none>
kube-system   efs-csi-controller-6f64dcc5dc-db9j8                         3/3     Running   0          37m    192.168.1.181   ip-192-168-1-181.ap-northeast-2.compute.internal   <none>           <none>
kube-system   efs-csi-node-rlfjg                                          3/3     Running   0          37m    192.168.1.181   ip-192-168-1-181.ap-northeast-2.compute.internal   <none>           <none>
kube-system   kube-ops-view-558d87b798-6l6sf                              1/1     Running   0          39m    192.168.1.47    ip-192-168-1-181.ap-northeast-2.compute.internal   <none>           <none>
kube-system   kube-proxy-kwmhh                                            1/1     Running   0          111m   192.168.1.181   ip-192-168-1-181.ap-northeast-2.compute.internal   <none>           <none>
monitoring    kube-prometheus-stack-grafana-846b5c46f9-9l86n              3/3     Running   0          25m    192.168.1.15    ip-192-168-1-181.ap-northeast-2.compute.internal   <none>           <none>
monitoring    kube-prometheus-stack-prometheus-node-exporter-frwsh        1/1     Running   0          25m    192.168.1.181   ip-192-168-1-181.ap-northeast-2.compute.internal   <none>           <none>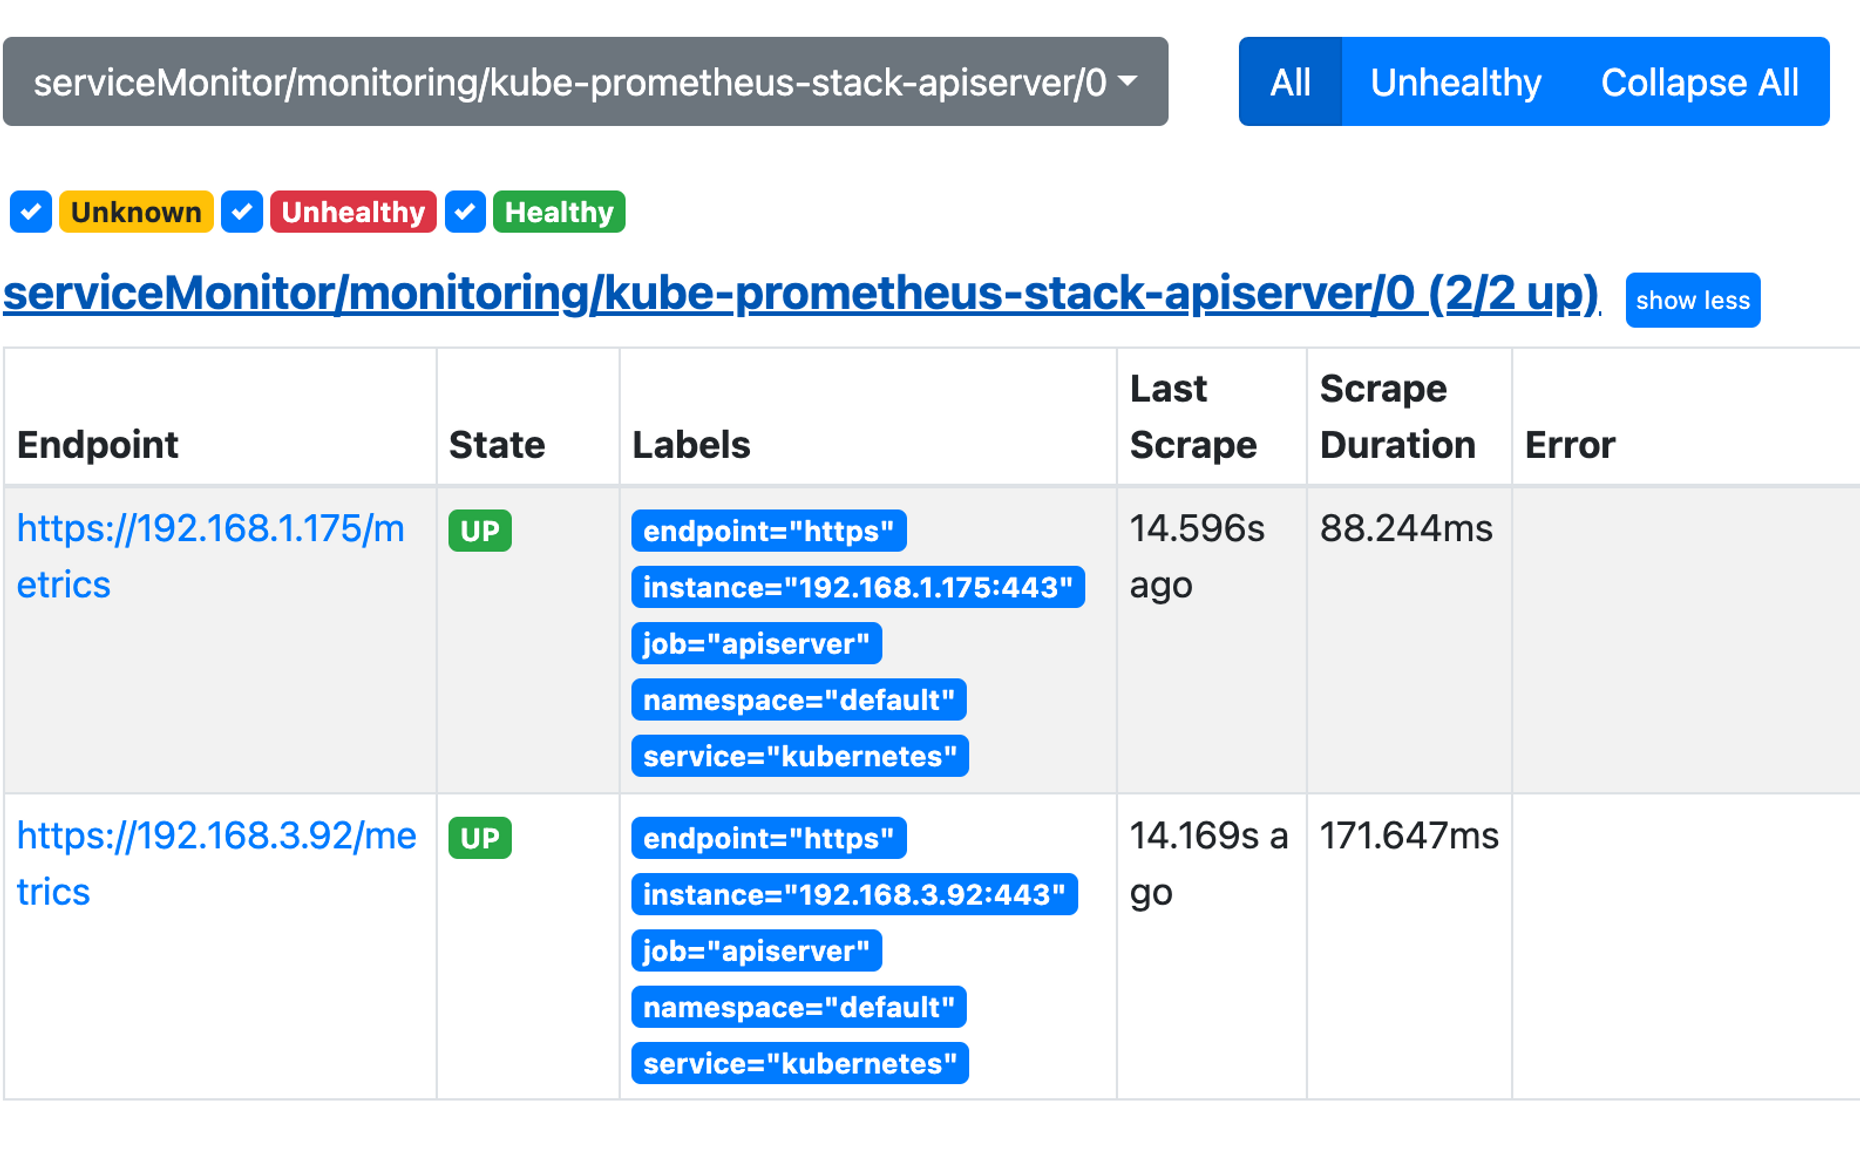
그라파나 Grafana
그라파나는 데이터를 시각화해주는 툴로, 직접 데이터를 제공해주진 않는다. 보통 프로메테우스와 그라파나를 연동시켜 사용한다.
아래는 그라파나를 배포하는 명령어입니다.
$cat <<EOF | kubectl create -f -
> apiVersion: monitoring.coreos.com/v1
> kind: PodMonitor
> metadata:
>   name: aws-cni-metrics
>   namespace: kube-system
> spec:
>   jobLabel: k8s-app
>   namespaceSelector:
>     matchNames:
>     - kube-system
>   podMetricsEndpoints:
>   - interval: 30s
>     path: /metrics
>     port: metrics
>   selector:
>     matchLabels:
>       k8s-app: aws-node
> EOF
podmonitor.monitoring.coreos.com/aws-cni-metrics created
$kubectl get podmonitor -n kube-system
NAME              AGE
aws-cni-metrics   48s
$cat <<EOT > ~/nginx_metric-values.yaml
> metrics:
>   enabled: true
>
>   service:
>     port: 9113
>
>   serviceMonitor:
>     enabled: true
>     namespace: monitoring
>     interval: 10s
> EOT

# 배포
$helm upgrade nginx bitnami/nginx --reuse-values -f nginx_metric-values.yaml
Release "nginx" has been upgraded. Happy Helming!
NAME: nginx
LAST DEPLOYED: Thu May 18 22:01:32 2023
NAMESPACE: default
STATUS: deployed
REVISION: 2
TEST SUITE: None
NOTES:
CHART NAME: nginx
CHART VERSION: 14.2.1
APP VERSION: 1.24.0

** Please be patient while the chart is being deployed **
NGINX can be accessed through the following DNS name from within your cluster:

    nginx.default.svc.cluster.local (port 80)

To access NGINX from outside the cluster, follow the steps below:

1. Get the NGINX URL and associate its hostname to your cluster external IP:

   export CLUSTER_IP=$(minikube ip) # On Minikube. Use: `kubectl cluster-info` on others K8s clusters
   echo "NGINX URL: http://nginx.kaneawsdns.com"
   echo "$CLUSTER_IP  nginx.kaneawsdns.com" | sudo tee -a /etc/hosts

# 배포 결과 확인
$kubectl get pod,svc,ep
NAME                         READY   STATUS              RESTARTS   AGE
pod/nginx-685c67bc9-bv9xr    1/1     Running             0          48m
pod/nginx-85fc957979-695lk   0/2     ContainerCreating   0          1s

NAME                 TYPE        CLUSTER-IP      EXTERNAL-IP   PORT(S)                       AGE
service/kubernetes   ClusterIP   10.100.0.1      <none>        443/TCP                       135m
service/nginx        NodePort    10.100.192.11   <none>        80:30443/TCP,9113:31223/TCP   48m

NAME                   ENDPOINTS                            AGE
endpoints/kubernetes   192.168.1.175:443,192.168.3.92:443   135m
endpoints/nginx        192.168.2.93:8080                    48m
$kubectl get servicemonitor -n monitoring nginx
NAME    AGE
nginx   2s
$kubectl get servicemonitor -n monitoring nginx -o json | jq
{
  "apiVersion": "monitoring.coreos.com/v1",
  "kind": "ServiceMonitor",
  "metadata": {
    "annotations": {
      "meta.helm.sh/release-name": "nginx",
      "meta.helm.sh/release-namespace": "default"
    },
    "creationTimestamp": "2023-05-18T13:01:33Z",
    "generation": 1,
    "labels": {
      "app.kubernetes.io/instance": "nginx",
      "app.kubernetes.io/managed-by": "Helm",
      "app.kubernetes.io/name": "nginx",
      "helm.sh/chart": "nginx-14.2.1"
    },
    "name": "nginx",
    "namespace": "monitoring",
    "resourceVersion": "30382",
    "uid": "d7da1d26-5f4e-4ab2-b980-2f45f274b667"
  },
  "spec": {
    "endpoints": [
      {
        "interval": "10s",
        "path": "/metrics",
        "port": "metrics"
      }
    ],
    "jobLabel": "",
    "namespaceSelector": {
      "matchNames": [
        "default"
      ]
    },
    "selector": {
      "matchLabels": {
        "app.kubernetes.io/instance": "nginx",
        "app.kubernetes.io/name": "nginx"
      }
    }
  }
}
이제 관련 메트릭을 확인해보는 실습이다.
# 메트릭 확인 >> 프로메테우스에서 Target 확인
$NGINXIP=$(kubectl get pod -l app.kubernetes.io/instance=nginx -o jsonpath={.items[0].status.podIP})
$curl -s http://$NGINXIP:9113/metrics # nginx_connections_active Y 값 확인해보기
$curl -s http://$NGINXIP:9113/metrics | grep ^nginx_connections_active
$NGINXIP=$(kubectl get pod -l app.kubernetes.io/instance=nginx -o jsonpath={.items[0].status.podIP})
$curl -s http://$NGINXIP:9113/metrics | grep ^nginx_connections_active
nginx_connections_active 1
$NGINXIP=$(kubectl get pod -l app.kubernetes.io/instance=nginx -o jsonpath={.items[0].status.podIP})
$curl -s http://$NGINXIP:9113/metrics # nginx_connections_active Y 값 확인해보기
# HELP nginx_connections_accepted Accepted client connections
# TYPE nginx_connections_accepted counter
nginx_connections_accepted 32
# HELP nginx_connections_active Active client connections
# TYPE nginx_connections_active gauge
nginx_connections_active 1
# HELP nginx_connections_handled Handled client connections
# TYPE nginx_connections_handled counter
nginx_connections_handled 32
# HELP nginx_connections_reading Connections where NGINX is reading the request header
# TYPE nginx_connections_reading gauge
nginx_connections_reading 0
# HELP nginx_connections_waiting Idle client connections
# TYPE nginx_connections_waiting gauge
nginx_connections_waiting 0
# HELP nginx_connections_writing Connections where NGINX is writing the response back to the client
# TYPE nginx_connections_writing gauge
nginx_connections_writing 1
# HELP nginx_http_requests_total Total http requests
# TYPE nginx_http_requests_total counter
nginx_http_requests_total 28
# HELP nginx_up Status of the last metric scrape
# TYPE nginx_up gauge
nginx_up 1
# HELP nginxexporter_build_info Exporter build information
# TYPE nginxexporter_build_info gauge
nginxexporter_build_info{arch="linux/amd64",commit="e4a6810d4f0b776f7fde37fea1d84e4c7284b72a",date="2022-09-07T21:09:51Z",dirty="false",go="go1.19",version="0.11.0"} 1

# 파드 개수 확인
$kubectl get pod -l app.kubernetes.io/instance=nginx
NAME                     READY   STATUS    RESTARTS   AGE
nginx-85fc957979-695lk   2/2     Running   0          111s
$kubectl describe pod -l app.kubernetes.io/instance=nginx
Name:             nginx-85fc957979-695lk
Namespace:        default
Priority:         0
Service Account:  default
Node:             ip-192-168-1-181.ap-northeast-2.compute.internal/192.168.1.181
Start Time:       Thu, 18 May 2023 22:01:33 +0900
Labels:           app.kubernetes.io/instance=nginx
                  app.kubernetes.io/managed-by=Helm
                  app.kubernetes.io/name=nginx
                  helm.sh/chart=nginx-14.2.1
                  pod-template-hash=85fc957979
Annotations:      kubernetes.io/psp: eks.privileged
Status:           Running
IP:               192.168.1.232
IPs:
  IP:           192.168.1.232
Controlled By:  ReplicaSet/nginx-85fc957979
Containers:
  nginx:
    Container ID:   containerd://11ddc2b099deb1833034d0fe5e71c311f9aaaaa8919e11f7a181692df8131838
    Image:          docker.io/bitnami/nginx:1.24.0-debian-11-r0
    Image ID:       docker.io/bitnami/nginx@sha256:002741bc8e88e7758001dfecffd05fcc5dc182db850e08161c488de27404f5be
    Port:           8080/TCP
    Host Port:      0/TCP
    State:          Running
      Started:      Thu, 18 May 2023 22:01:39 +0900
    Ready:          True
    Restart Count:  0
    Liveness:       tcp-socket :http delay=30s timeout=5s period=10s #success=1 #failure=6
    Readiness:      tcp-socket :http delay=5s timeout=3s period=5s #success=1 #failure=3
    Environment:
      BITNAMI_DEBUG:           false
      NGINX_HTTP_PORT_NUMBER:  8080
    Mounts:                    <none>
  metrics:
    Container ID:  containerd://e42daca6fc8edcd7410b44c1343c366df92d536235465d5522f3f7a5f3347d74
    Image:         docker.io/bitnami/nginx-exporter:0.11.0-debian-11-r74
    Image ID:      docker.io/bitnami/nginx-exporter@sha256:ec05a98e16d8b04f554d02ed87033dd99596ac827ce9ad793bbe570f2372ce5e
    Port:          9113/TCP
    Host Port:     0/TCP
    Command:
      /usr/bin/exporter
      -nginx.scrape-uri
      http://127.0.0.1:8080/status
    State:          Running
      Started:      Thu, 18 May 2023 22:01:44 +0900
    Ready:          True
    Restart Count:  0
    Liveness:       http-get http://:metrics/metrics delay=15s timeout=5s period=10s #success=1 #failure=3
    Readiness:      http-get http://:metrics/metrics delay=5s timeout=1s period=10s #success=1 #failure=3
    Environment:    <none>
    Mounts:         <none>
Conditions:
  Type              Status
  Initialized       True
  Ready             True
  ContainersReady   True
  PodScheduled      True
Volumes:            <none>
QoS Class:          BestEffort
Node-Selectors:     <none>
Tolerations:        node.kubernetes.io/not-ready:NoExecute op=Exists for 300s
                    node.kubernetes.io/unreachable:NoExecute op=Exists for 300s
Events:
  Type    Reason     Age   From               Message
  ----    ------     ----  ----               -------
  Normal  Scheduled  112s  default-scheduler  Successfully assigned default/nginx-85fc957979-695lk to ip-192-168-1-181.ap-northeast-2.compute.internal
  Normal  Pulling    112s  kubelet            Pulling image "docker.io/bitnami/nginx:1.24.0-debian-11-r0"
  Normal  Pulled     106s  kubelet            Successfully pulled image "docker.io/bitnami/nginx:1.24.0-debian-11-r0" in 5.357183997s
  Normal  Created    106s  kubelet            Created container nginx
  Normal  Started    106s  kubelet            Started container nginx
  Normal  Pulling    106s  kubelet            Pulling image "docker.io/bitnami/nginx-exporter:0.11.0-debian-11-r74"
  Normal  Pulled     101s  kubelet            Successfully pulled image "docker.io/bitnami/nginx-exporter:0.11.0-debian-11-r74" in 5.400426806s
  Normal  Created    101s  kubelet            Created container metrics
  Normal  Started    101s  kubelet            Started container metrics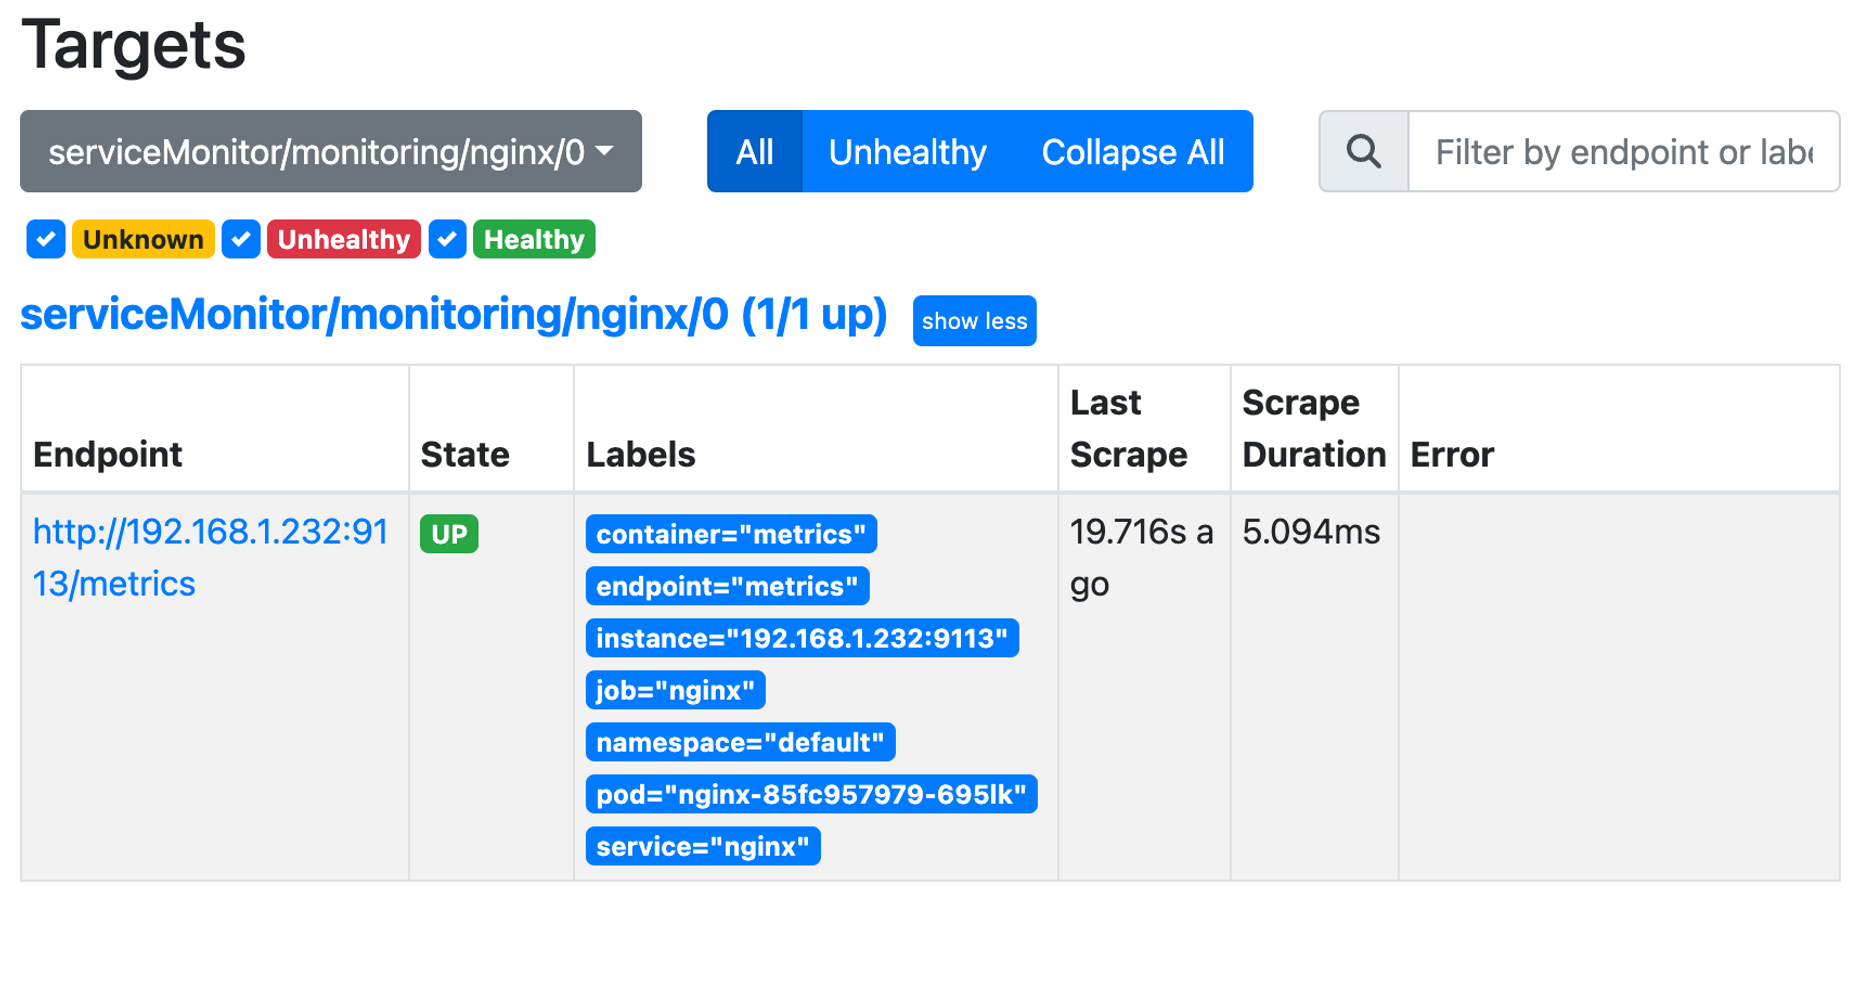
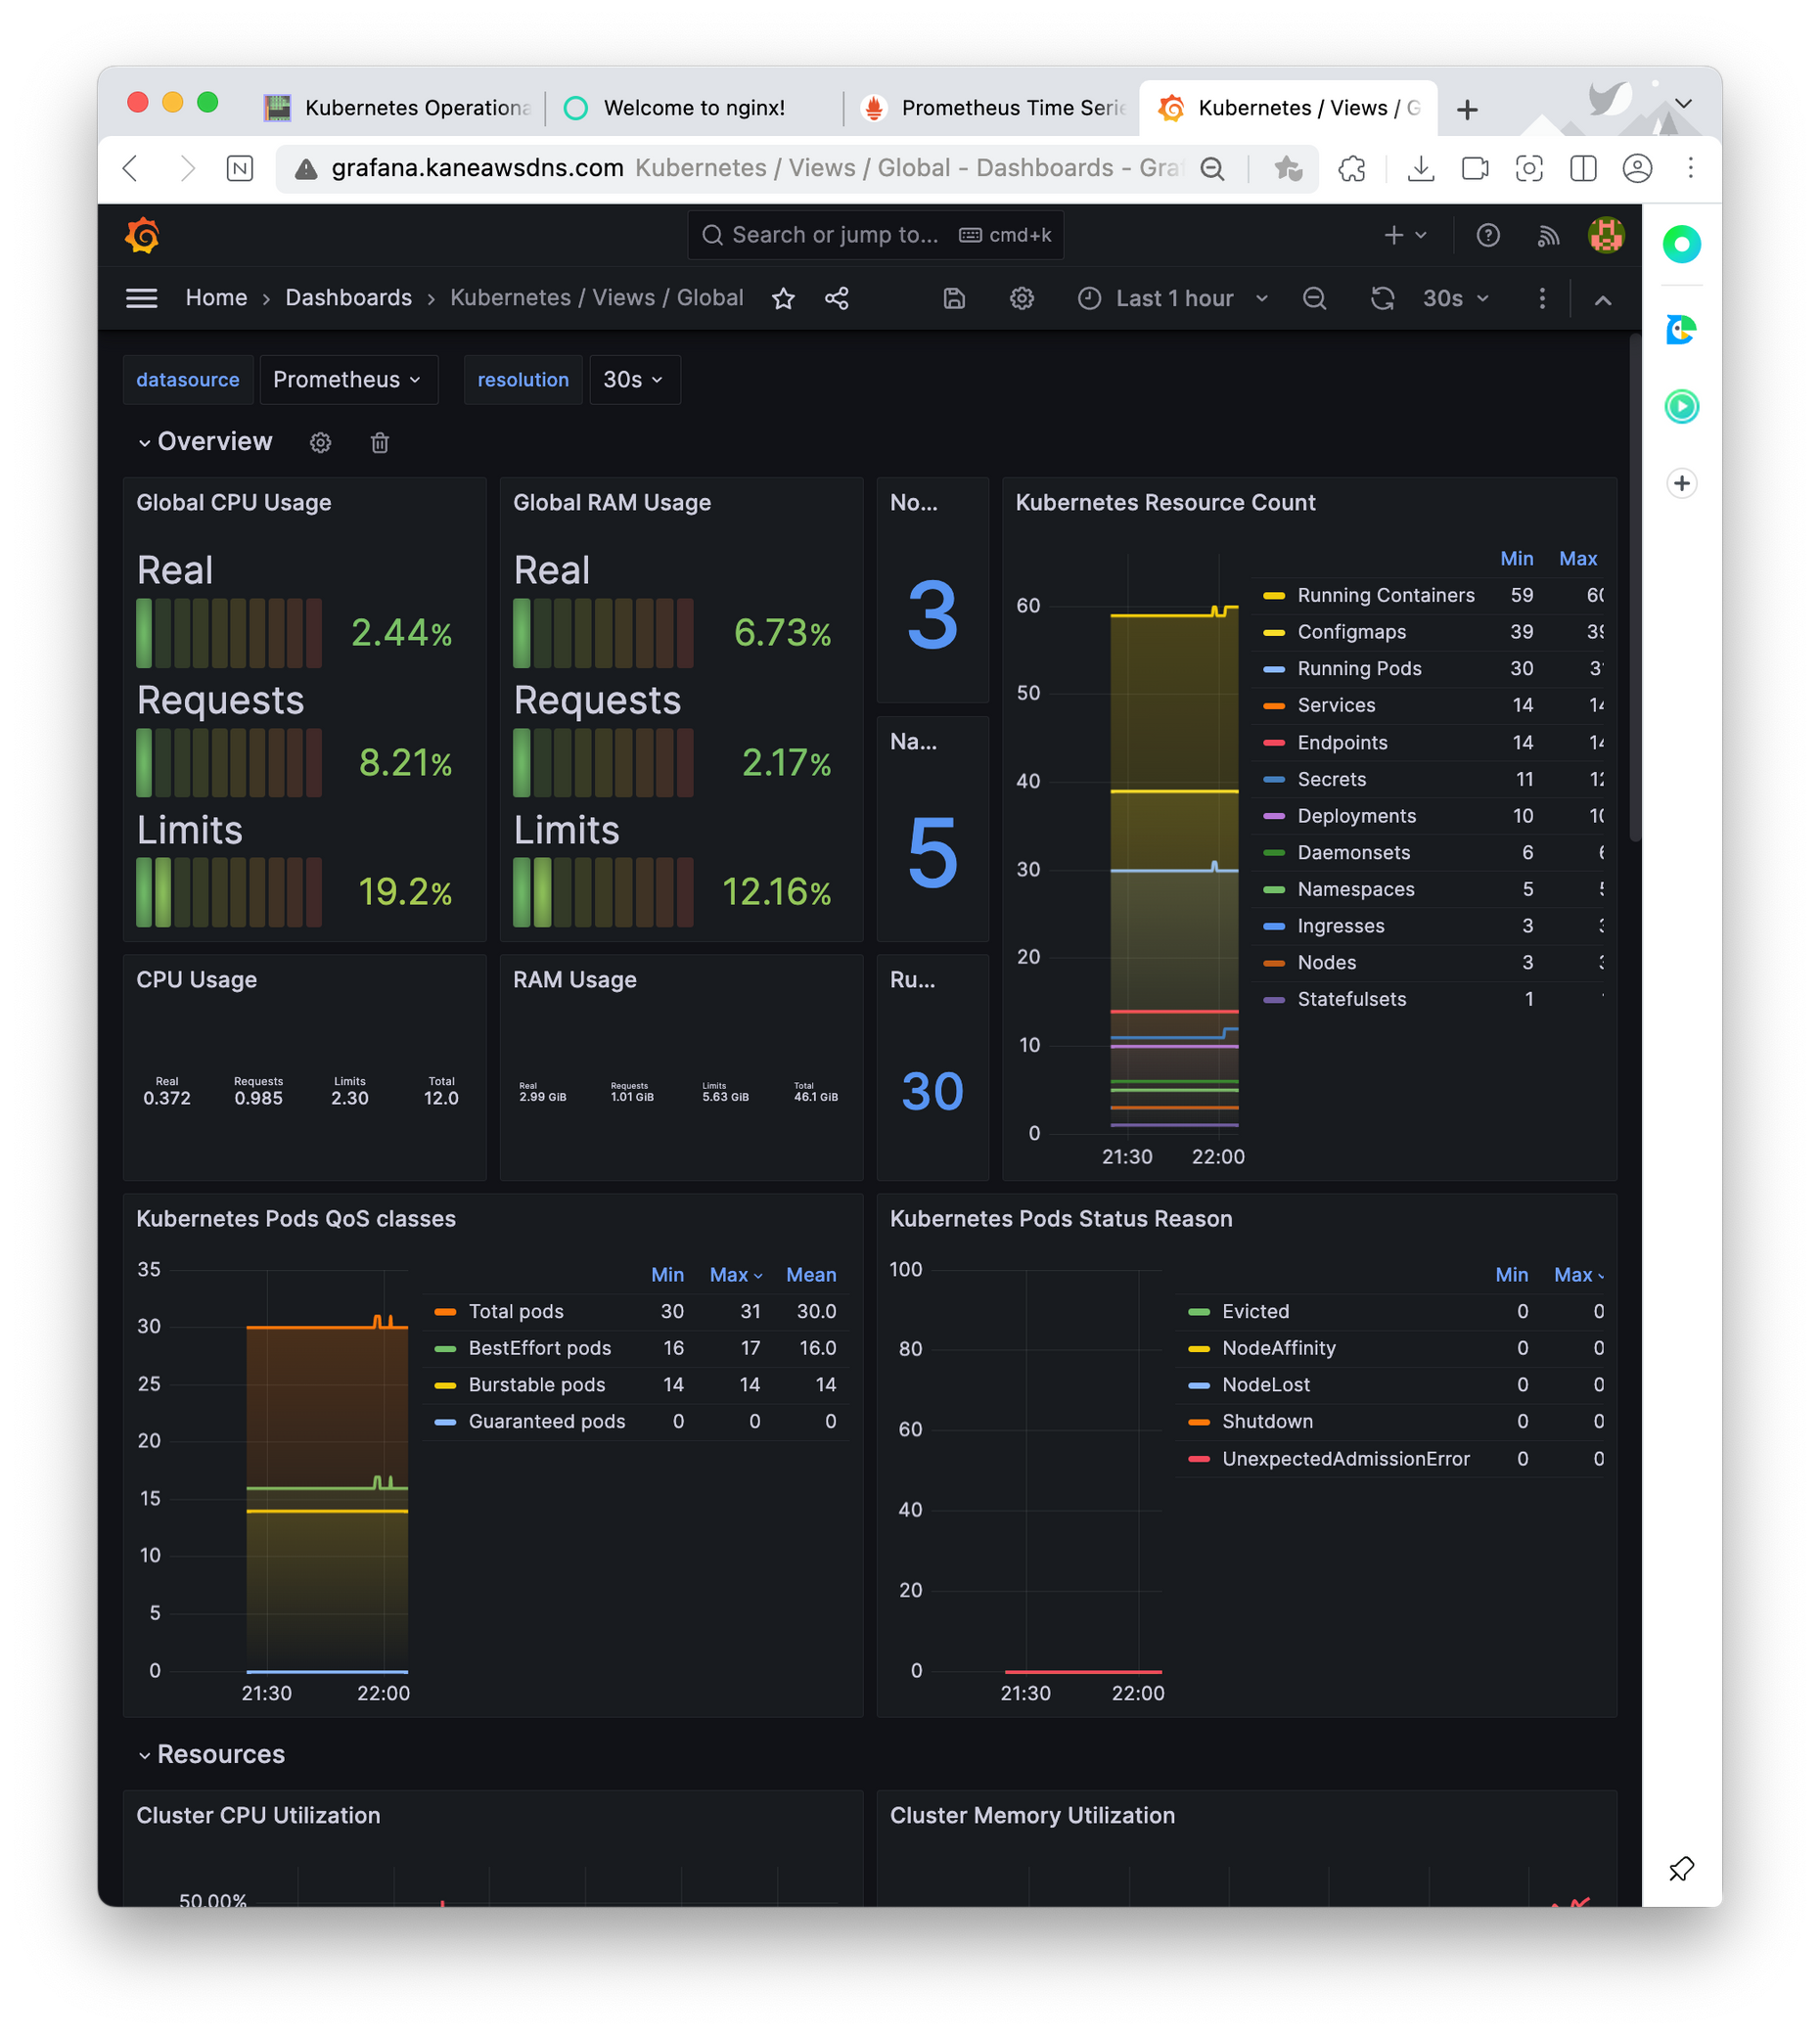
아래는 대시보드와 관련된 사진이다. 가시다님이 추천해주신 대시보드는 링크를 따라서 확인할 수 있다.
아래는 프로메테우스에 대한 대시보드
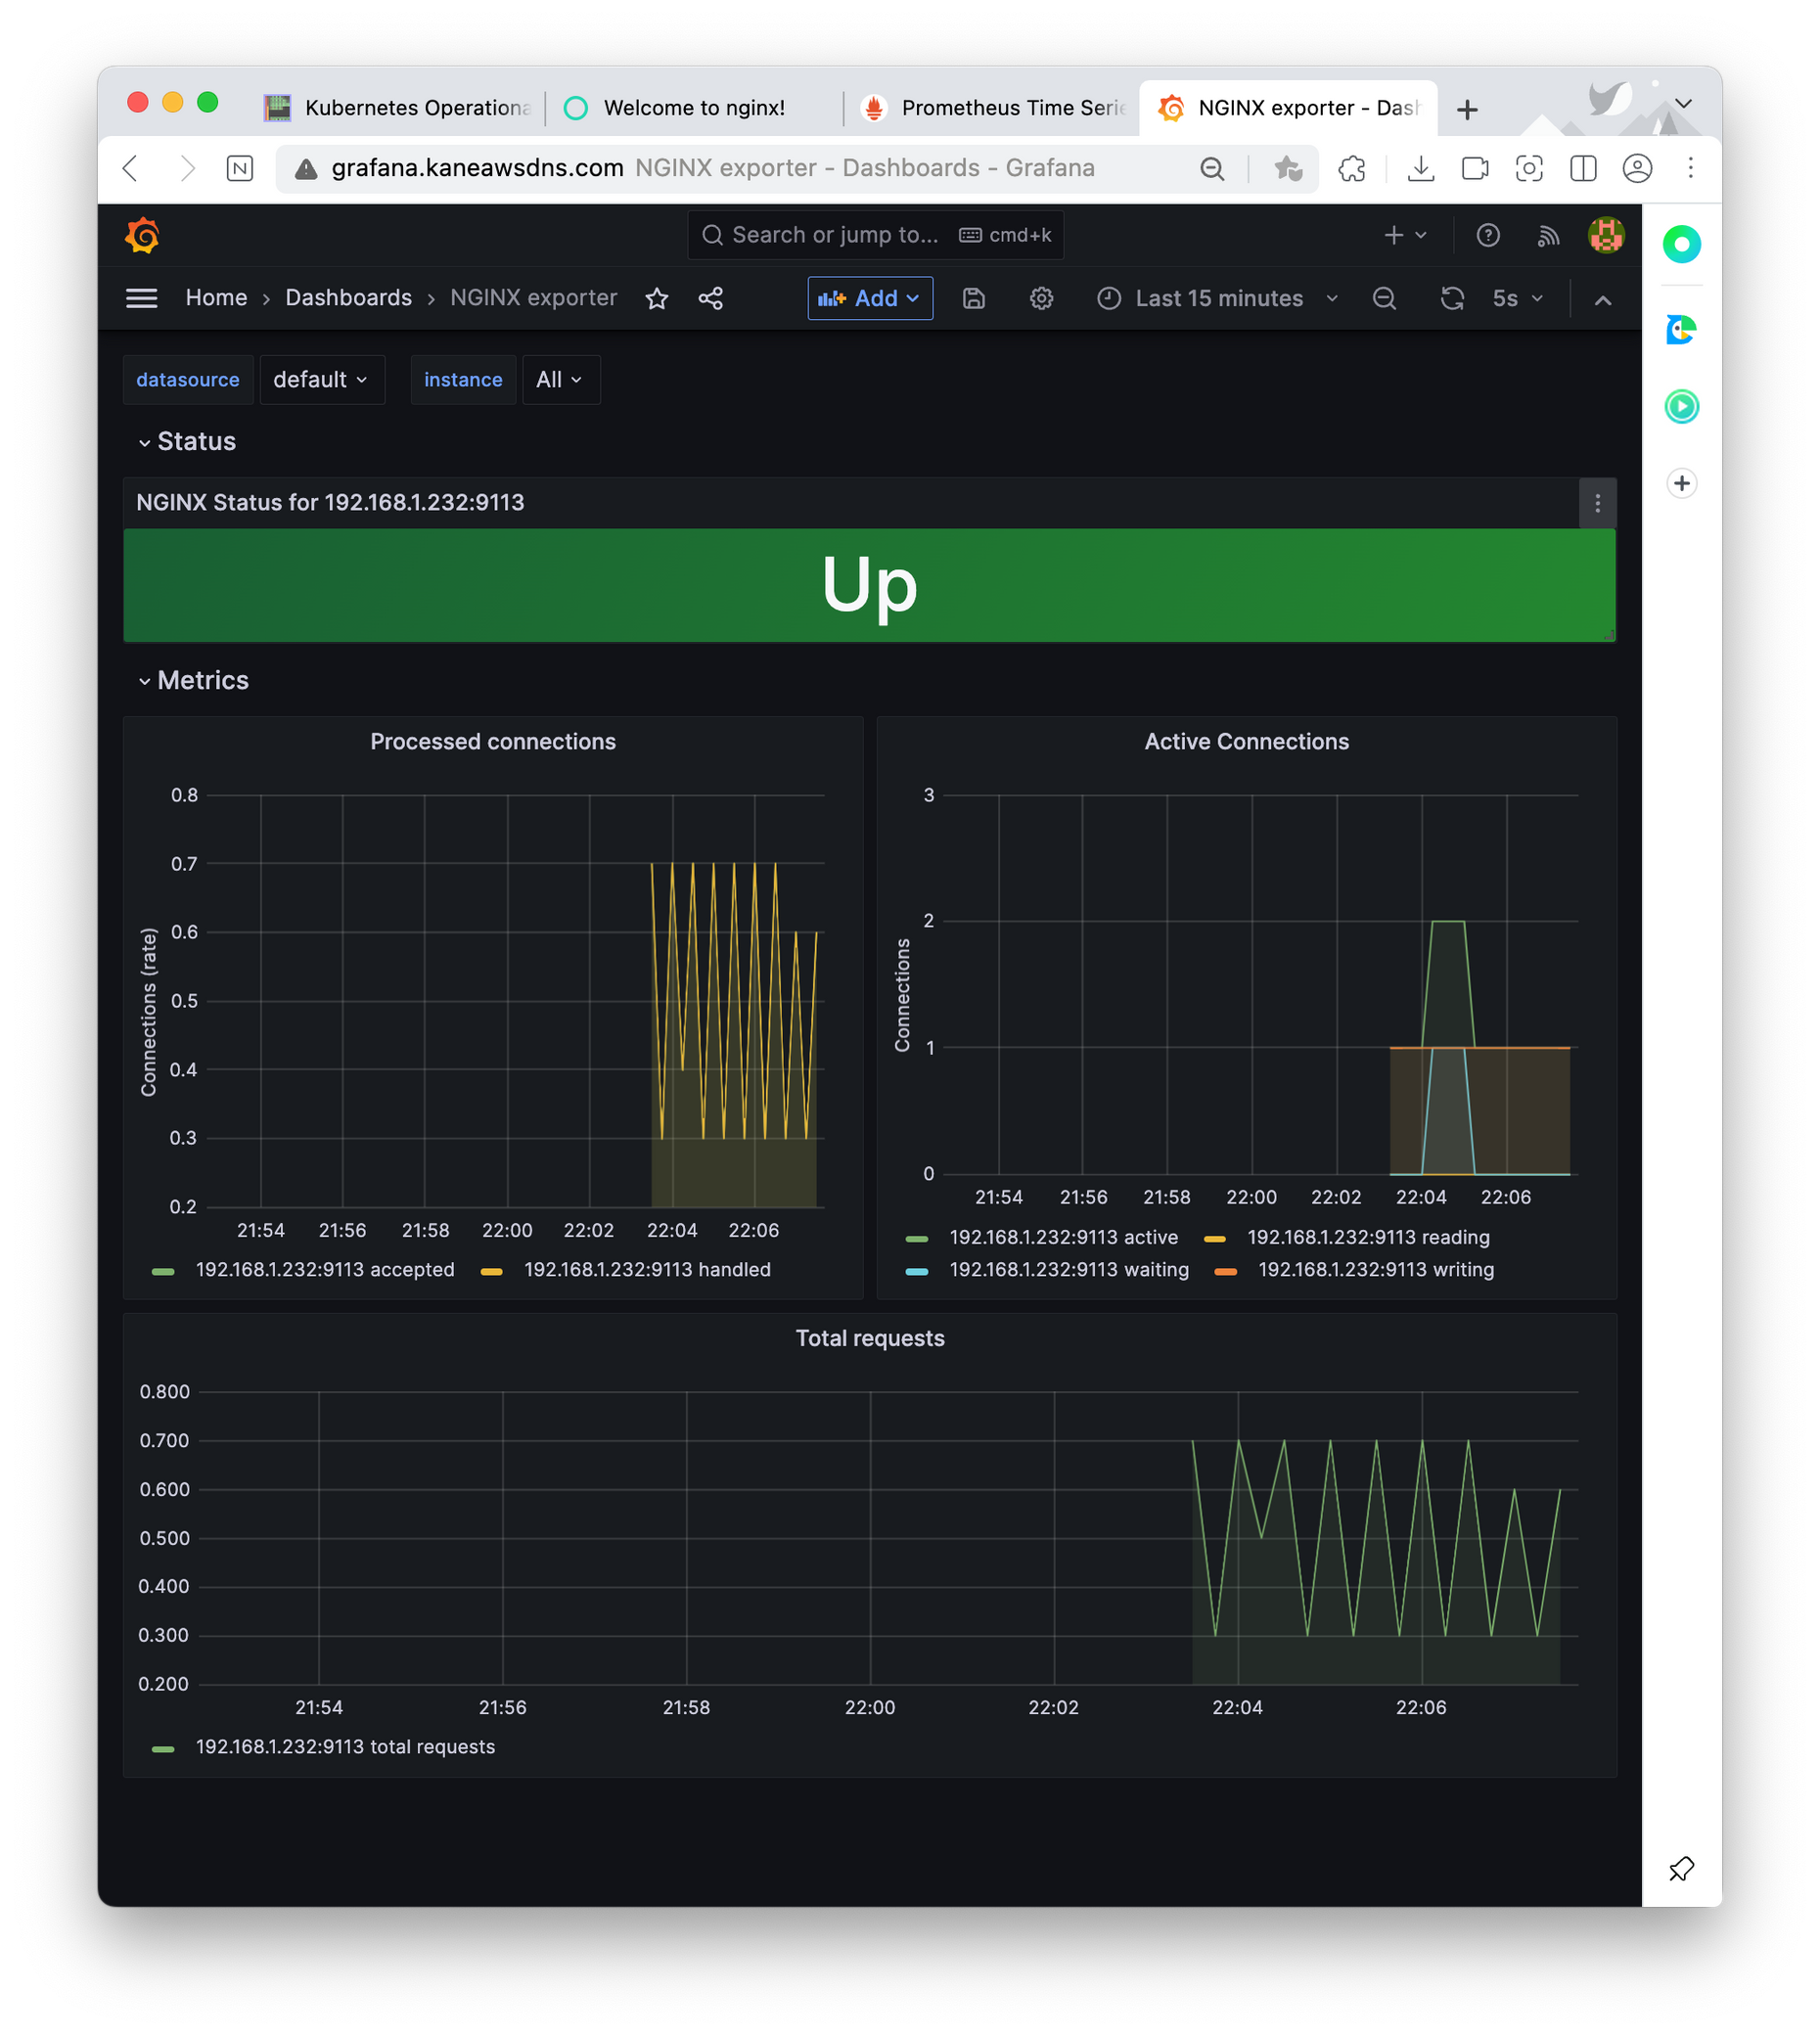
오래는 NGINX에 대한 대시보드
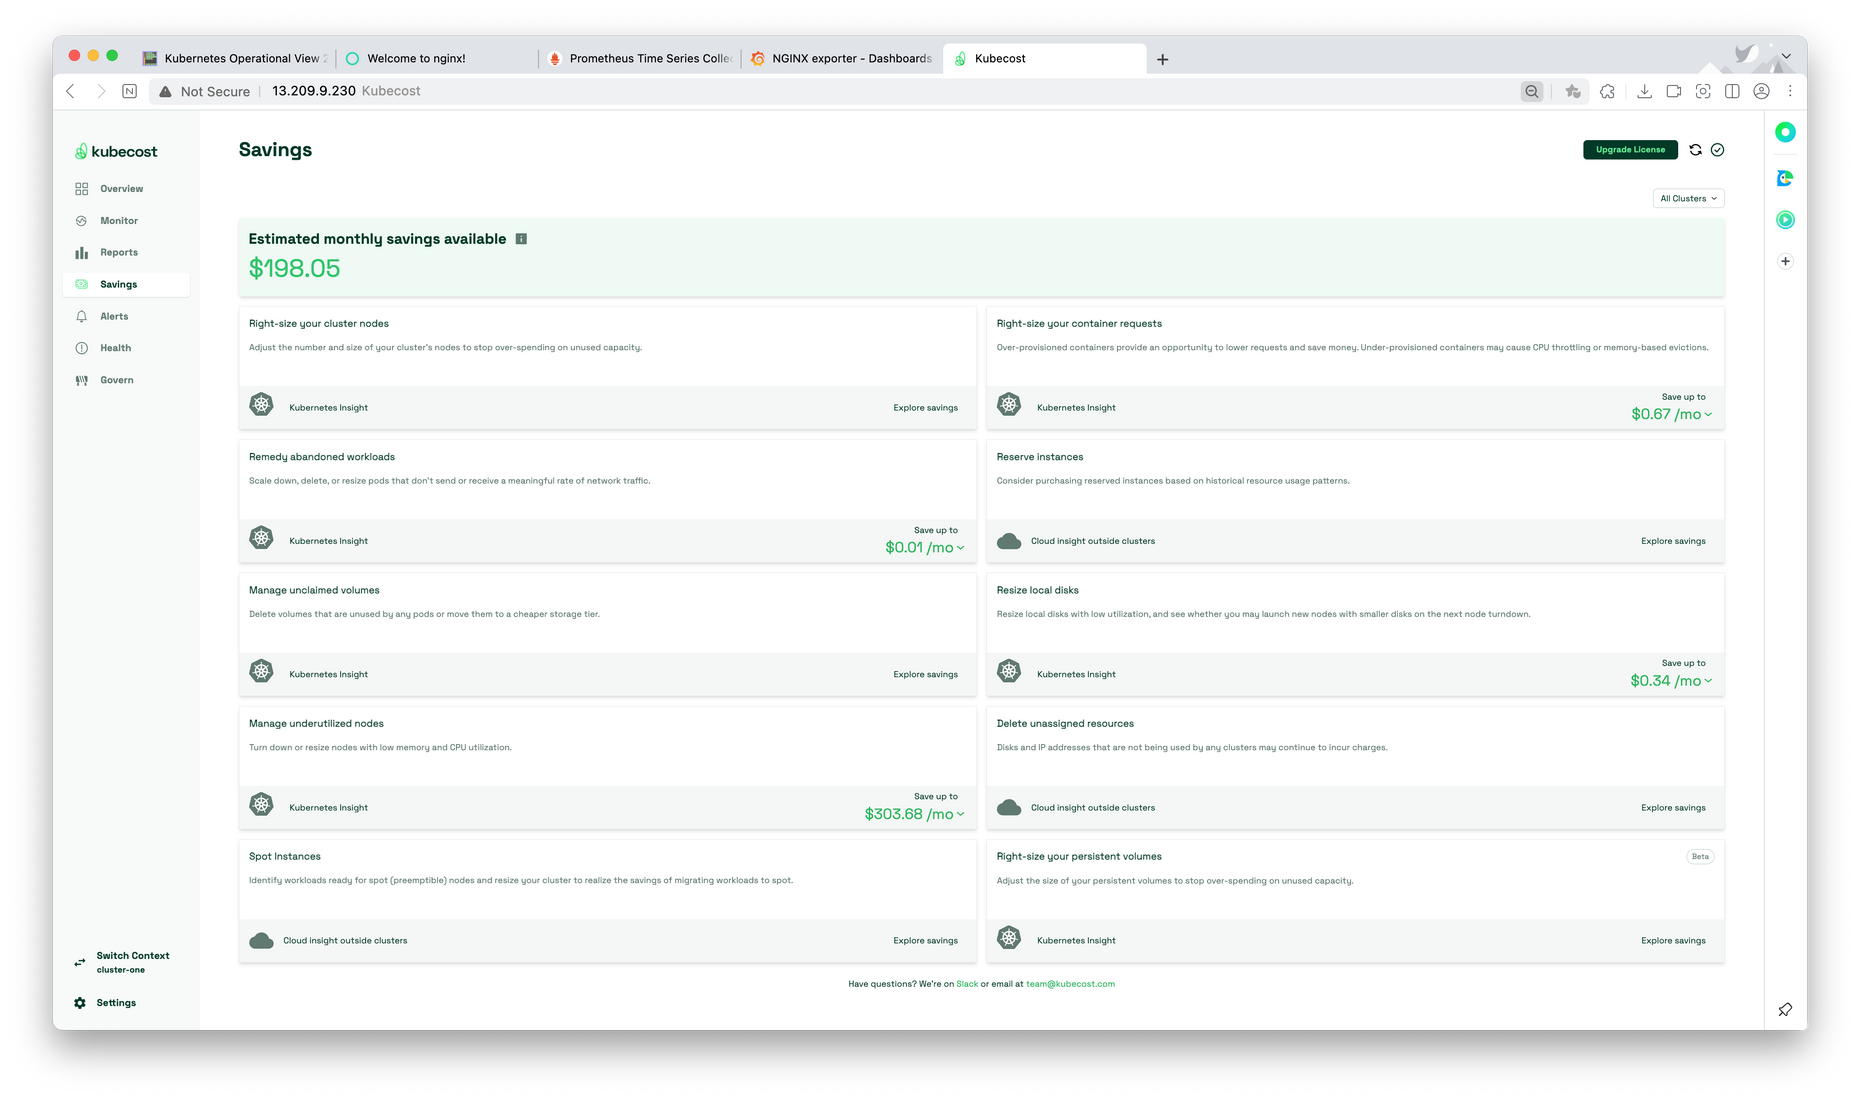
kubecost
kubecost는 OpenCost를 기반으로 구축되었으며 쿠버네티스 용량과 비용에 대한 모니터링 및 시각화를 제공해준다. AWS에서 적극지원한다고 하니, 호환성이 높을 듯 하다.
아래는 설치와 관련된 실습이다.
$cat cost-values.yaml
global:
  grafana:
    enabled: true
    proxy: false

priority:
  enabled: false
networkPolicy:
  enabled: false
podSecurityPolicy:
  enabled: false

persistentVolume:
    storageClass: "gp3"

prometheus:
  kube-state-metrics:
    disabled: false
  nodeExporter:
    enabled: true

reporting:
  productAnalytics: true
$helm uninstall -n monitoring kube-prometheus-stack

$kubectl create ns kubecost

$helm install kubecost oci://public.ecr.aws/kubecost/cost-analyzer --version 1.103.2 --namespace kubecost -f cost-values.yaml
Pulled: public.ecr.aws/kubecost/cost-analyzer:1.103.2
Digest: sha256:26d0d364d8763a142a6d52c8e5fc0ceecb1131862e7405d71d2273d8ddb45a9e
W0518 22:14:24.188018   18612 warnings.go:70] policy/v1beta1 PodSecurityPolicy is deprecated in v1.21+, unavailable in v1.25+
W0518 22:14:24.603042   18612 warnings.go:70] policy/v1beta1 PodSecurityPolicy is deprecated in v1.21+, unavailable in v1.25+
NAME: kubecost
LAST DEPLOYED: Thu May 18 22:14:22 2023
NAMESPACE: kubecost
STATUS: deployed
REVISION: 1
TEST SUITE: None
NOTES:
--------------------------------------------------Kubecost has been successfully installed.

WARNING: ON EKS v1.23+ INSTALLATION OF EBS-CSI DRIVER IS REQUIRED TO MANAGE PERSISTENT VOLUMES. LEARN MORE HERE: https://docs.kubecost.com/install-and-configure/install/provider-installations/aws-eks-cost-monitoring#prerequisites

Please allow 5-10 minutes for Kubecost to gather metrics.

If you have configured cloud-integrations, it can take up to 48 hours for cost reconciliation to occur.

When using Durable storage (Enterprise Edition), please allow up to 4 hours for data to be collected and the UI to be healthy.

When pods are Ready, you can enable port-forwarding with the following command:

    kubectl port-forward --namespace kubecost deployment/kubecost-cost-analyzer 9090

Next, navigate to http://localhost:9090 in a web browser.

Having installation issues? View our Troubleshooting Guide at http://docs.kubecost.com/troubleshoot-install

$curl http://localhost:9090

$kubectl get all -n kubecost
NAME                                              READY   STATUS    RESTARTS   AGE
pod/kubecost-cost-analyzer-996544d88-vktft        2/2     Running   0          69s
pod/kubecost-grafana-867bbf59c7-n7978             2/2     Running   0          69s
pod/kubecost-kube-state-metrics-d6d9b7594-5k6wj   1/1     Running   0          69s
pod/kubecost-prometheus-node-exporter-74vxw       1/1     Running   0          69s
pod/kubecost-prometheus-node-exporter-bf22q       1/1     Running   0          69s
pod/kubecost-prometheus-node-exporter-vwj72       1/1     Running   0          69s
pod/kubecost-prometheus-server-77bd8b8d6f-dpn62   2/2     Running   0          69s

NAME                                        TYPE        CLUSTER-IP      EXTERNAL-IP   PORT(S)             AGE
service/kubecost-cost-analyzer              ClusterIP   10.100.135.82   <none>        9003/TCP,9090/TCP   69s
service/kubecost-grafana                    ClusterIP   10.100.2.134    <none>        80/TCP              69s
service/kubecost-kube-state-metrics         ClusterIP   10.100.86.120   <none>        8080/TCP            69s
service/kubecost-prometheus-node-exporter   ClusterIP   None            <none>        9100/TCP            69s
service/kubecost-prometheus-server          ClusterIP   10.100.72.137   <none>        80/TCP              69s

NAME                                               DESIRED   CURRENT   READY   UP-TO-DATE   AVAILABLE   NODE SELECTOR   AGE
daemonset.apps/kubecost-prometheus-node-exporter   3         3         3       3            3           <none>          69s

NAME                                          READY   UP-TO-DATE   AVAILABLE   AGE
deployment.apps/kubecost-cost-analyzer        1/1     1            1           69s
deployment.apps/kubecost-grafana              1/1     1            1           69s
deployment.apps/kubecost-kube-state-metrics   1/1     1            1           69s
deployment.apps/kubecost-prometheus-server    1/1     1            1           69s

NAME                                                    DESIRED   CURRENT   READY   AGE
replicaset.apps/kubecost-cost-analyzer-996544d88        1         1         1       69s
replicaset.apps/kubecost-grafana-867bbf59c7             1         1         1       69s
replicaset.apps/kubecost-kube-state-metrics-d6d9b7594   1         1         1       69s
replicaset.apps/kubecost-prometheus-server-77bd8b8d6f   1         1         1       69s

# 테스트
CAIP=$(kubectl get pod -n kubecost -l app=cost-analyzer -o jsonpath={.items[0].status.podIP})

$echo $CAIP
192.168.2.167

$curl -s $CAIP:9090
<!DOCTYPE html>
<html lang="en">
  <head>
    <meta charset="UTF-8" />
    <meta name="viewport" content="width=device-width, initial-scale=1.0" />
    <meta
      name="description"
      content="Monitor and reduce Kubernetes spend"
    />
    <link rel="icon" href="./favicon.ico" />
    <link rel="apple-touch-icon" href="./logo196.png" />
    <!--
      manifest.json provides metadata used when your web app is installed on a
      user's mobile device or desktop. See https://developers.google.com/web/fundamentals/web-app-manifest/
    -->
    <link rel="manifest" href="./manifest.json" />
    <script type="text/javascript">window.global ||= window</script>
    <script type="text/javascript" src="./jquery.min.3.6.0.js"></script>
    <script type="text/javascript" src="./helper.js"></script>
    <title>Kubecost</title>
    <script type="module" crossorigin src="./static/index-04613a22.js"></script>
    <link rel="stylesheet" href="./static/index-d798bf65.css">
  </head>
  <body>
    <noscript>You need to enable JavaScript to run this app.</noscript>
    <div id="root"></div>
    <div id="portal-root"></div>

  </body>
</html>

$socat TCP-LISTEN:80,fork TCP:$CAIP:9090
아래는 실제 접속한 사이트
마치며
이번 주차에서는 개념적인 내용보다, 배포와 확인하는 내용이 많았다. 실제 옵저버빌리티를 구축을 하면서 다양한 툴을 직접 사용해봤다. 최근에 핫하다는 opentelmetry도 추후 한번 배포해볼 생각이다.