번역기 사용 유무 : 有
사용 변역 툴 : DeepL, 구글 번역기
DeepL
https://www.deepl.com/ko/translator
설치 후 사용 방법
번역할 문장 드래그 후Cmd + C꾹 누르기
첫 영어 세미나라 전체 슬라이드 스크립트를 한글로 전부 작성한 후, 번역기를 사용했다. 번역기를 사용하다보니 다소 영어 표현이 어색한 것 같아 자체 피드백을 해보려합니다.
Slide 1
I'd like to start the presentation for the 21 March group meeting.
그룹미팅 발표를(세미나) 시작하겠습니다를 번역기로 돌린걸 그대로 사용했는데, I'd like to ~가 ~를 하고싶다.의 느낌이라 다음 세미나에는 인사말(Good Afternoon) + Let's begin the Group Meeting presentation.으로 간결하게 시작할 것 같다.
Slide 2
The presentation consists of two parts.
The first part is about WandB, a machine learning experiment tracking tool.
In the second part, I will explain what I studied before studying Pathology Image Compression: what is pathology, what are pathology images, viewer tool for opening pathology images, and python libraries for handling data.
슬라이드 2는 개요에 관한 슬라이드였다.
The presentation consists of two parts.는 '프레젠테이션은 두 부분으로 구성되어 있다.'로 해석할 수 있는데, 다음 세미나에는 What I'm going to talk about today is A, B and C. 이렇게 두괄식으로 발표할 Main Topic을 언급하고 Detail에 대해 간략하게 서술하는 방식으로 변경할 것이다.
Slide 3
WandB is a platform that we use to track and visualise ML experiments.
It is called Weights and Biases, but Korean users call it '완디비'.
WandB's core features include hyperparameter and model tracking, an efficient experiment management UI, and visualise experiment result metrics and images on a dashboard.
슬라이드 3은 WandB 플랫폼에 대해 설명하고, 주요 제공 기능 3가지에 대해 언급하였다.
Slide 4
Why do we need a platform like WandB?
The image on the left is a model tuning record I wrote in notebooks when I participated in a competition as an undergraduate.
While handwriting is convenient for some people, it makes it difficult to reproduce experiments.
It's also easy to make mistakes, and image is hard to manage.
슬라이드 4는 해당 플랫폼을 사용하지 않았을 때의 단점을 언급하며, 필요성에 대해 말하였다.
Slide 5
Here is a comparison between WandB and MLflow, an MLOps platform.
I have experience using MLflow to create ML pipelines at former company.
This table summarises the feature differences between two platforms.
For AI research, WandB was a more efficient tool because deployment features are unnecessary and should be as easy to use as possible.
두 플랫폼 간의 차이를 경험에 근거하여 언급했다. 여기서 former라는 표현을 사용했다. 그 이유는 두 곳의 회사 중 제일 처음 다녔던 회사에서 해당 툴을 사용했기 떄문에 previous 대신에 former를 사용했습니다. 만약 직전 회사였다면 previous를 사용했을 것이다.
Slide 6
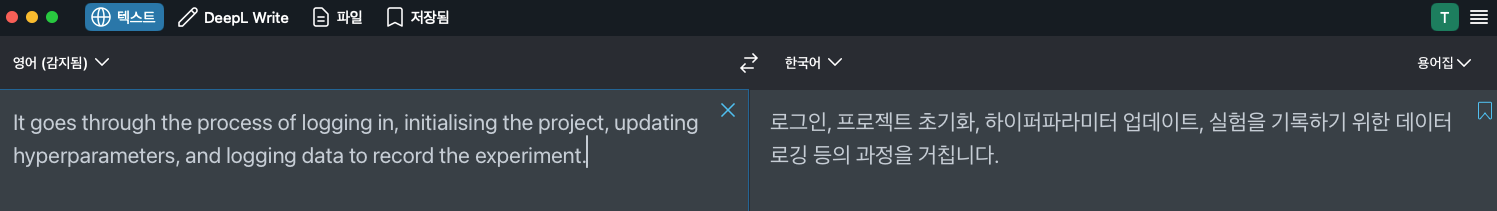
Next Slide is Process in WandB.
It goes through the process of logging in, initialising the project, updating hyperparameters, and logging data to record the experiment. The code below the process is sample code using the WandB API.
슬라이드 6은 WandB의 간략한 프로세스에 대해 설명헀다.
goes through 뜻이 너무 많아서 조금 어색해보였는데 DeepL은 ~을 거치다로 해석한 것같다.
Slide 7
Login and project initialisation step creates a project with the string variable that you declared for the account you are logged into.
슬라이드 7~9는 세 프로세스에 따른 결과에 대해 설명했다.
Slide 8
Here is the result of recording hyperparameters.
You can log hyperparameters such as batch size, learning rate, epoch, etc.
etc는 라틴어 et cetera의 준말이다. ~ 등을 의미한다.
다른 표현으로는 and so on이나 and other things이 있었다.
Slide 9
This is the result of visualising the resulting values saved using the log method in a dashboard.
As an example, we ran three GAN experiments, and we can track and visualise the changing values of metrics like PSNR during training and compare them across experiments.
I personally recommend adding the WandB code after the model code has stable.
슬라이드 9는 시각화된 실험결과를 대시보드에 저장한 이미지에 대해 설명했다. 여기서 번역기를 사용하다보니 주어가 we가 되어 있었다. 번역기를 돌려보니 맞는 표현같아보이는데 발표에서 우리라는 표현이 조금 어색하여 There are~ 로 '~가 있다.'로 설명하지 싶다.
Slide 10
The second topic is the pathology domain.
Pathology is a word that combines patho, meaning disease, and logy, meaning discipline.
The definition of pathology is "The study of the cause and effect of disease through direct observation and examination".
The two images are a microscope looking at a pathology image and the image you observed. Traditionally, a camera was attached to the microscope, but nowadays, a digital scanner is used to get pathology images.
두 번째 주제를 시작하는 슬라이드였다.
병리학의 정의에 대해 언급하고, 과거와 현재의 디지털 병리 이미지를 얻는 방법에 대해 이미지를 통해 간략히 설명했다.
Slide 11
There are three main characteristics of pathology images.
First, it is stained for accurate observation. Typically, we use the H&E stain.
The blue colour is haematoxylin, which reacts with DNA and RNA and stains the nucleus. The red colour is eosin, which mainly stains the cytoplasm and microfilaments.
The second has a whole slide image pyramid structure. WSI images are typically 4GB or more in size, uncompressed images exceeding 10GB.
This makes it difficult to access and process the data, so the image is downsampled by a certain percentage to save it.
Users can select the resolution as needed to quickly view specific parts of the image.
Third, there are different file formats for different scanner companies.
슬라이드 11은 한 슬라이드에 너무 많은 내용이 압축되어 있어 스크립드가 가장 길었던 파트였다. 그래서 발표 중 가장 많이 절었던 슬라이드였고, 중간에 한 문장을 뛰어 넘어 발표의 흐름이 끊기는 일이 있었다.
다음 발표에는 스크립트에 구분선이나 문단 구분을 해서 눈에 잘 들어오게 해야겠다라고 생각했다.
olour 찾아보니 olor 뜻은 동일했다. color는 미국식, colour는 영국식 영어에 주로 사용되는 표현이었다.
Slide 12
QuPath is a pathology image viewer tool. Qupath can open a variety of pathology image formats.
By clicking on the Image button, you can see the information and metadata of the pathology image.
The coordinates of the image are not in the Cartesian coordinate system, but in the Graphics coordinate system, with the top left corner at (0,0).
슬라이드 12는 QuPath를 사용하여 병리 이미지를 불러오는 방법과 좌표 시스템에 대해 설명했다.
By clicking on the Image button,에서 By ~ing는 ~함으로써, ~하여 라는 의미이다.
Slide 13
To process pathology images in Python, we use a library called Openslide.
We can use the OpenSlide methods to store information from the svs file in variables.
After printing out the information of the pathology image, we can see that it has four pyramid structure, and the image is stored downsampled by 1/4x 1/16x 1/64x.
If we want to get the image information of the desired size at specific coordinates, we can extract it using the read_region method.
desired : 원하는
분수 읽는 방법이 생각이 안났었는데 해당 블로그 참고해서 기수/서수로 발표했었다.
Slide 14
The four images are the result of changing the value of the level parameter in the read_region method.
You can see that as the level increases, the number of cells we can observe increases, but the detail decreases.
Slide 15,16
Our future learning plan is to learn about the process of image compression, classical and deep learning methods.
Thank you.
여기서도 번역기를 돌리니 Our로 시작을 해서 번역 후 한 번더 검수해야곘다.
그리고 한 달동안 비즈니스 영어 공부도 틈틈이 해서 다음 세미나 잘 준비해봐야겠다..