ELk와 GitLab의 경우 회사에서 운영 도구로써 사용해 보기만 했지, 초기 구축을 해본 적이 없었는데 이번 기회로 구축해보게 되었다.
Grafana와 Prometheus의 경우 사용해보지도 못하여 이번 구축 기회는 조금 남다를 것 같다.
0. kubectl 설치 (링크)
1. Helm 설치 (링크)
2. EKS 클러스터 생성
root@gphost:~# cat cluster.yml
apiVersion: eksctl.io/v1alpha5
kind: ClusterConfig
metadata:
  name: gp-test
  region: ap-southeast-1
nodeGroups:
  - name: ng-1
    instanceType: t3.medium
    desiredCapacity: 2
    volumeSize: 10
root@gphost:~# eksctl create cluster -f cluster.yml
2022-12-18 10:28:12 [ℹ]  eksctl version 0.122.0
2022-12-18 10:28:12 [ℹ]  using region ap-southeast-1
2022-12-18 10:28:12 [ℹ]  setting availability zones to [ap-southeast-1b ap-southeast-1c ap-southeast-1a]
2022-12-18 10:28:12 [ℹ]  subnets for ap-southeast-1b - public:192.168.0.0/19 private:192.168.96.0/19
2022-12-18 10:28:12 [ℹ]  subnets for ap-southeast-1c - public:192.168.32.0/19 private:192.168.128.0/19
2022-12-18 10:28:12 [ℹ]  subnets for ap-southeast-1a - public:192.168.64.0/19 private:192.168.160.0/19
...
...
2022-12-18 10:46:58 [ℹ]  nodegroup "ng-1" has 0 node(s)
2022-12-18 10:46:58 [ℹ]  waiting for at least 2 node(s) to become ready in "ng-1"
2022-12-18 10:48:11 [ℹ]  nodegroup "ng-1" has 2 node(s)
2022-12-18 10:48:11 [ℹ]  node "ip-192-168-20-2.ap-southeast-1.compute.internal" is ready
2022-12-18 10:48:11 [ℹ]  node "ip-192-168-87-227.ap-southeast-1.compute.internal" is ready
2022-12-18 10:48:13 [ℹ]  kubectl command should work with "/root/.kube/config", try 'kubectl get nodes'
2022-12-18 10:48:13 [✔]  EKS cluster "gp-test" in "ap-southeast-1" region is ready
3. 서비스 계정에 대한 Amazon EBS CSI 드라이버 IAM 역할 생성 (링크)
4. Amazon EKS 추가 기능으로 Amazon EBS CSI 드라이버 관리 (링크)
5. grafana, prometheus-server, alertmanager에서 사용할 persistent volume 생성
6. Helm repository 추가
root@gphost:~# helm repo add prometheus-community https://prometheus-community.github.io/helm-charts
"prometheus-community" has been added to your repositories
root@gphost:~# helm repo add grafana https://grafana.github.io/helm-charts
"grafana" has been added to your repositories
root@gphost:~# helm repo update
Hang tight while we grab the latest from your chart repositories...
...Successfully got an update from the "grafana" chart repository
...Successfully got an update from the "prometheus-community" chart repository
Update Complete. ⎈Happy Helming!⎈
root@gphost:~#
root@gphost:~#
root@gphost:~# helm repo list
root@gphost:~#
NAME                    URL
prometheus-community    https://prometheus-community.github.io/helm-charts
grafana                 https://grafana.github.io/helm-charts
root@gphost:~#
root@gphost:~# kubectl create ns prometheus
namespace/prometheus created
6. Prometheus 배포
root@gphost:~# helm install prometheus prometheus-community/prometheus -f values-prometheus.yaml -n prometheus
NAME: prometheus
LAST DEPLOYED: Sun Dec 18 12:59:38 2022
NAMESPACE: prometheus
STATUS: deployed
REVISION: 1
NOTES:
The Prometheus server can be accessed via port 80 on the following DNS name from within your cluster:
prometheus-server.prometheus.svc.cluster.local


Get the Prometheus server URL by running these commands in the same shell:
  export POD_NAME=$(kubectl get pods --namespace prometheus -l "app=prometheus,component=server" -o jsonpath="{.items[0].metadata.name}")
  kubectl --namespace prometheus port-forward $POD_NAME 9090


The Prometheus alertmanager can be accessed via port  on the following DNS name from within your cluster:
prometheus-%!s(<nil>).prometheus.svc.cluster.local


Get the Alertmanager URL by running these commands in the same shell:
  export POD_NAME=$(kubectl get pods --namespace prometheus -l "app=prometheus,component=" -o jsonpath="{.items[0].metadata.name}")
  kubectl --namespace prometheus port-forward $POD_NAME 9093
#################################################################################
######   WARNING: Pod Security Policy has been disabled by default since    #####
######            it deprecated after k8s 1.25+. use                        #####
######            (index .Values "prometheus-node-exporter" "rbac"          #####
###### .          "pspEnabled") with (index .Values                         #####
######            "prometheus-node-exporter" "rbac" "pspAnnotations")       #####
######            in case you still need it.                                #####
#################################################################################


The Prometheus PushGateway can be accessed via port 9091 on the following DNS name from within your cluster:
prometheus-prometheus-pushgateway.prometheus.svc.cluster.local


Get the PushGateway URL by running these commands in the same shell:
  export POD_NAME=$(kubectl get pods --namespace prometheus -l "app=prometheus-pushgateway,component=pushgateway" -o jsonpath="{.items[0].metadata.name}")
  kubectl --namespace prometheus port-forward $POD_NAME 9091

For more information on running Prometheus, visit:
https://prometheus.io/
7. Grafana 배포
root@gphost:~# helm install grafana grafana/grafana -f values-grafana.yaml -n prometheus
W1218 13:01:12.502934 6566 warnings.go:70] policy/v1beta1 PodSecurityPolicy is deprecated in v1.21+, unavailable in v1.25+
W1218 13:01:13.777265 6566 warnings.go:70] policy/v1beta1 PodSecurityPolicy is deprecated in v1.21+, unavailable in v1.25+
NAME: grafana
LAST DEPLOYED: Sun Dec 18 13:01:11 2022
NAMESPACE: prometheus
STATUS: deployed
REVISION: 1
NOTES:
1. Get your 'admin' user password by running:
kubectl get secret --namespace prometheus grafana -o jsonpath="{.data.admin-password}" | base64 --decode ; echo
2. The Grafana server can be accessed via port 80 on the following DNS name from within your cluster:
grafana.prometheus.svc.cluster.local
Get the Grafana URL to visit by running these commands in the same shell:
export NODE_PORT=$(kubectl get --namespace prometheus -o jsonpath="{.spec.ports[0].nodePort}" services grafana)
export NODE_IP=$(kubectl get nodes --namespace prometheus -o jsonpath="{.items[0].status.addresses[0].address}")
echo http://$NODE_IP:$NODE_PORT
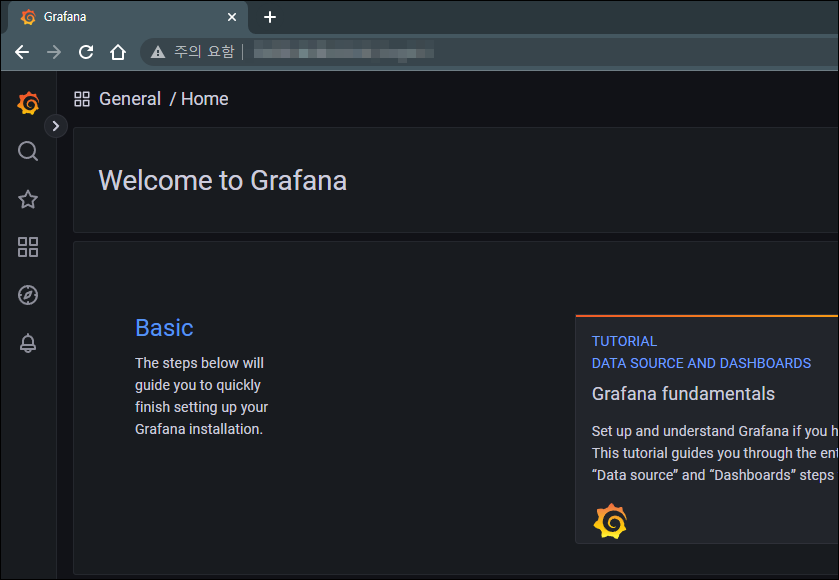
3. Login with the password from step 1 and the username: admin8. 접속 테스트
9. 트러블슈팅
EBS 볼륨을 만드는 게 귀찮에서 가용영역을 한 곳으로만 정해서 리소스를 만들었는데, 클러스터 단위에서 알아서 마운트를 시켜주지는 않았다. 그래서 노드가 위치한 가용 영역에 맞춰서 EBS 볼륨을 넉넉하게 생성하였다. 또한 서비스 별로 요구하는 볼륨 크기가 달랐다. grafana의 경우 100GiB 크기 볼륨이 필요했던 것 같은데, 내가 만든 EBS 볼륨들의 크기는 10GiB로 만들었더니 올라오지 않았던 것 같다. 아무쪼록 EBS 볼륨 문제만 해결해서 조치 완료되었다.
10. 레퍼런스

DevOps 엔지니어 / 열심히 해서 잘하자