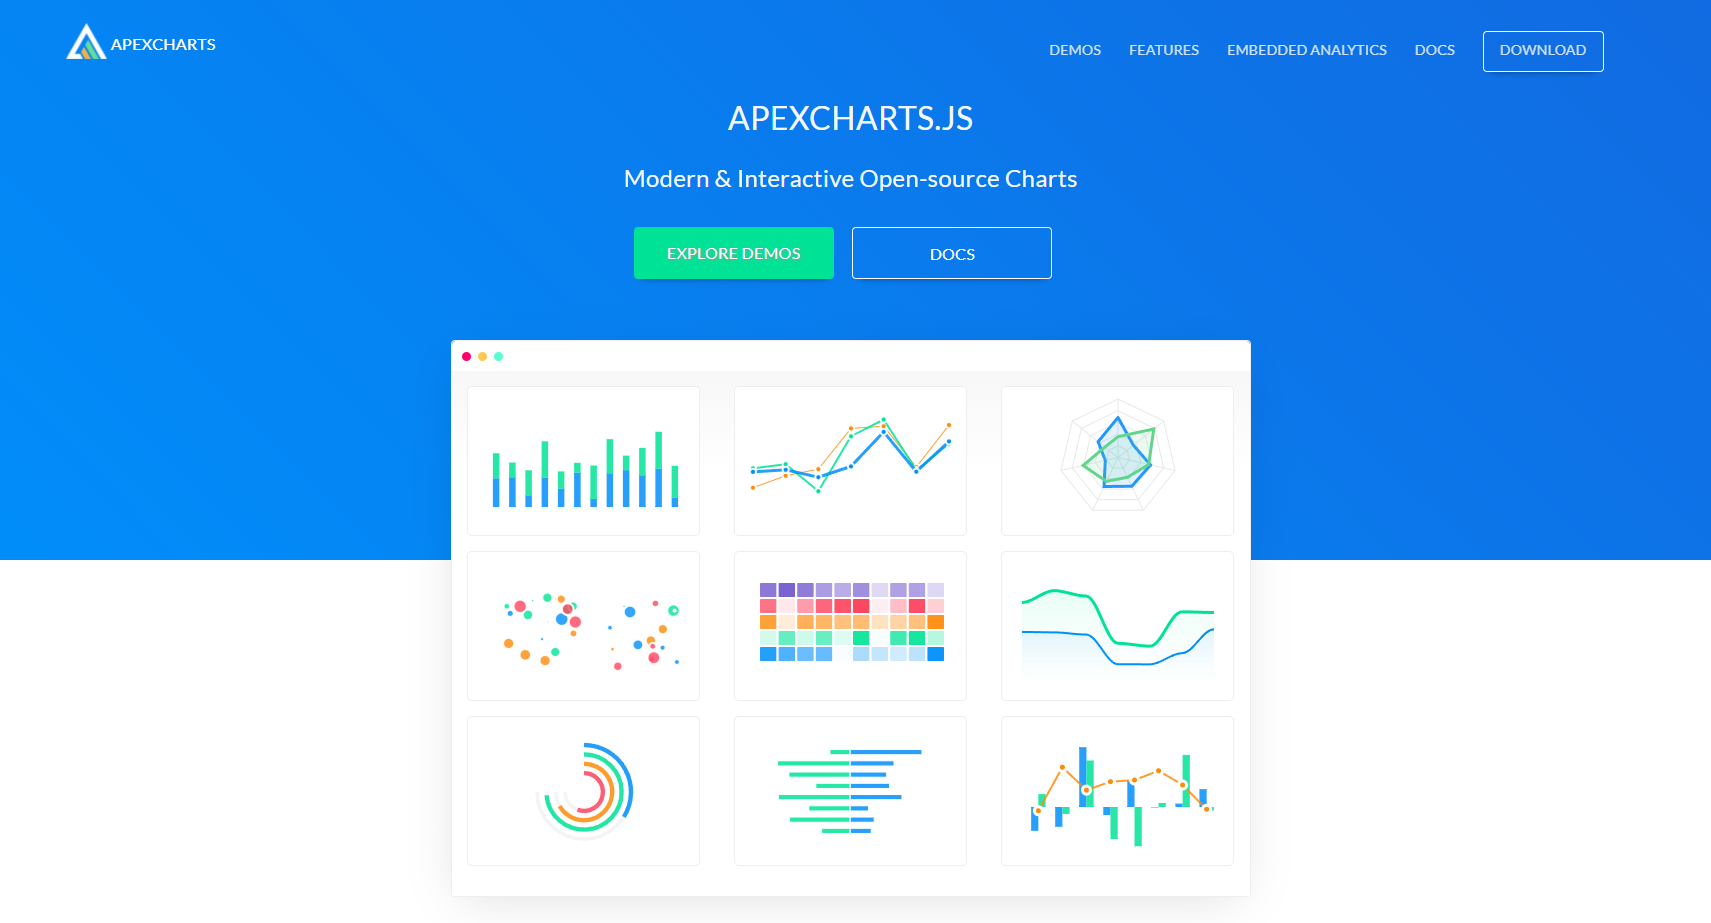
APEXCHARTS
- Modern & Interactive Open-source Charts
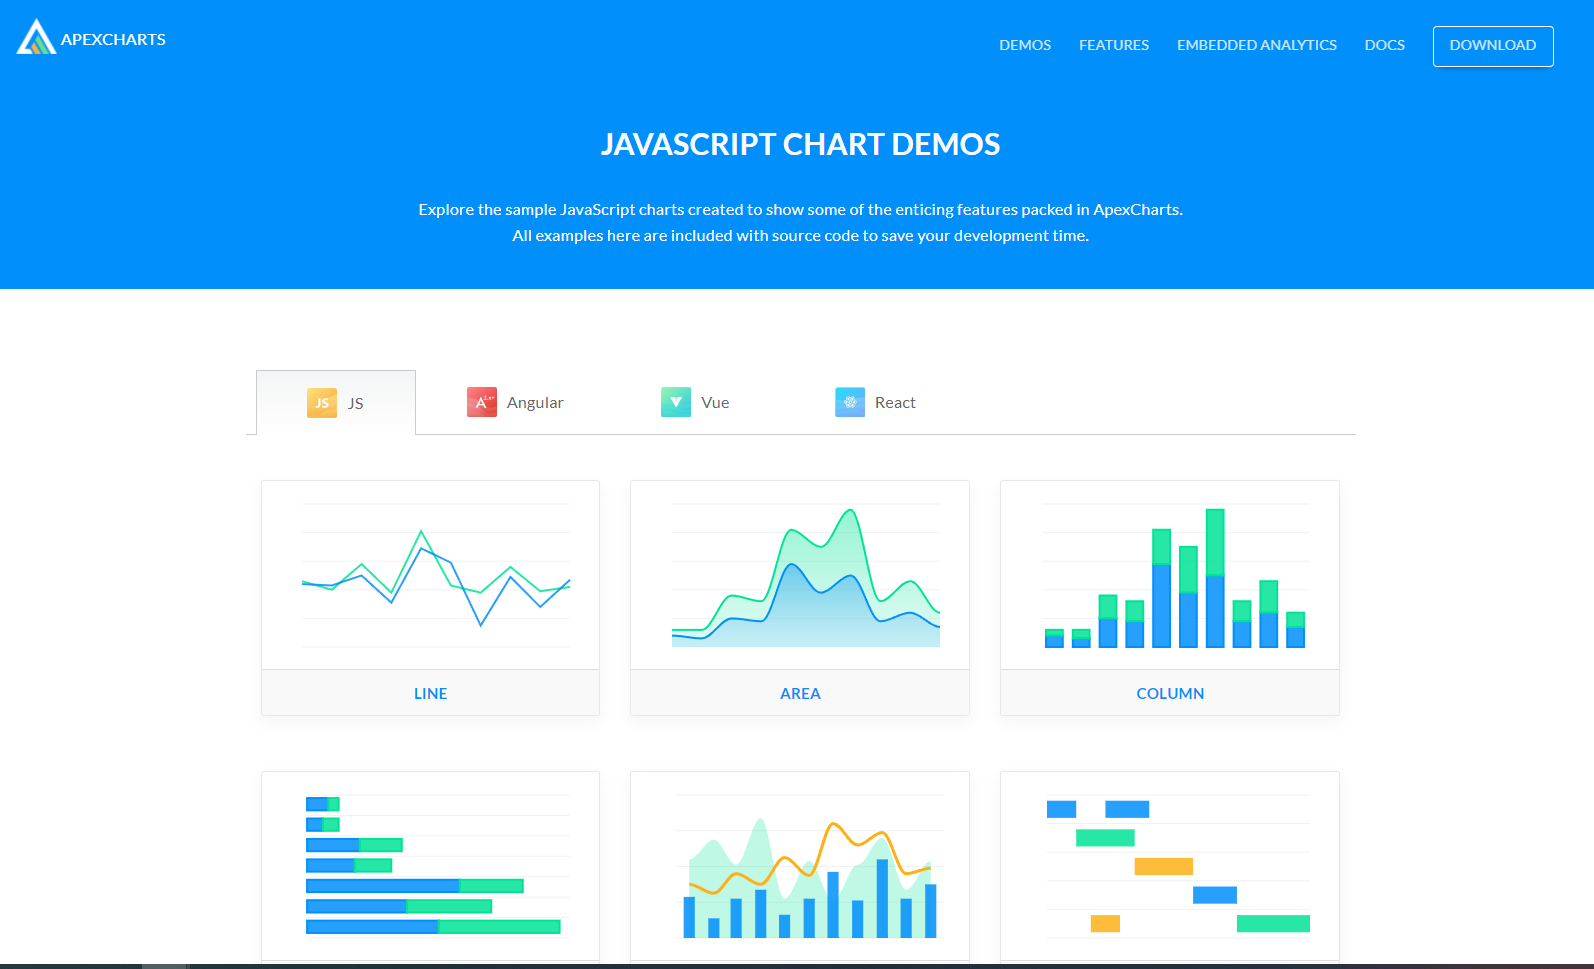
- js 기반 차트 라이브러리.
- JS, Angular, Vue, React를 지원함.
- install
npm install apexcharts --save
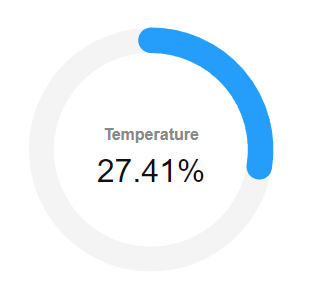
Basic Radial Charts
import React from 'react';
import Chart from 'react-apexcharts';

// props: dataAvg(number), dataLabel(string)

const RadialBarChart = (props) => {
    const { dataAvg, dataLabel } = props;

    const options = {
        chart: {
            height: 350,
            type: 'radialBar'
        },
        plotOptions: {
            radialBar: {
                hollow: {
                    margin: 15,
                    size: '60%' // bar 굵기
                },
                dataLabels: {
                    showOn: 'always',
                    name: {
                        offsetY: -10,
                        show: true,
                        color: '#888',
                        fontSize: '16px'
                    },
                    value: {
                        color: '#111',
                        fontSize: '32px',
                        show: true
                    }
                }
            }
        },
        stroke: {
            lineCap: 'round'
        },
        labels: [dataLabel]
    };
    const series = [dataAvg]; // %

    return (
        <div className="radialbar">
            <Chart options={options} series={series} type="radialBar" height="350" />
        </div>
    );
};

export default RadialBarChart;
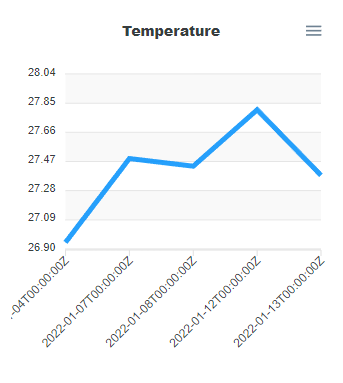
Basic Line Chart
import React from 'react';
import Chart from 'react-apexcharts';

// props: title-text(string), xaxis-categories(array), series-name(string), series-data(array)

const BasicLineChart = (props) => {
    const { titleText, category, seriesName, seriesData } = props;

    const options = {
        chart: {
            height: 350,
            type: 'line',
            zoom: {
                enabled: false
            }
        },
        dataLabels: {
            enabled: false
        },
        stroke: {
            curve: 'straight'
        },
        title: {
            text: titleText,
            align: 'center'
        },
        grid: {
            row: {
                colors: ['#f3f3f3', 'transparent'], // takes an array which will be repeated on columns
                opacity: 0.5
            }
        },
        xaxis: {
            categories: category
        },
        noData: {
            text: 'No Data',
            align: 'center',
            verticalAlign: 'middle'
        }
    };
    const series = [
        {
            name: seriesName,
            data: seriesData
        }
    ];

    return (
        <div className="linechart">
            <Chart options={options} series={series} type="line" height="350" />
        </div>
    );
};

export default BasicLineChart;
No Data 표시
noData: {
  text: undefined,
  align: 'center',
  verticalAlign: 'middle',
  offsetX: 0,
  offsetY: 0,
  style: {
    color: undefined,
    fontSize: '14px',
    fontFamily: undefined
  }
}
Web Developer