
📊 밀도 기반 클러스터
📌 밀도 기반 클러스터란?
- 정의
- 데이터가 비선형인 경우 일반적인 계층적, 비계층적 클러스터링이 불가
- 이를 해결하기 위한 방안
📊 밀도 기반 클러스터 실습
📌 밀도 기반 클러스터 DBSCAN 실습
- 1. 라이브러리 Import
import matplotlib.pylab as plt
from matplotlib import style
import numpy as np
from sklearn.datasets import make_moons
from sklearn.cluster import KMeans, DBSCAN
- 2. 데이터 준비
x, y = make_moons(n_samples=200, noise=0.05, random_state=0)
print(x[:3])
# [[ 0.81680544  0.5216447 ]
#  [ 1.61859642 -0.37982927]
#  [-0.02126953  0.27372826]]
- 3. 데이터 분포도 확인
plt.scatter(x[:, 0], x[:, 1])
plt.show()
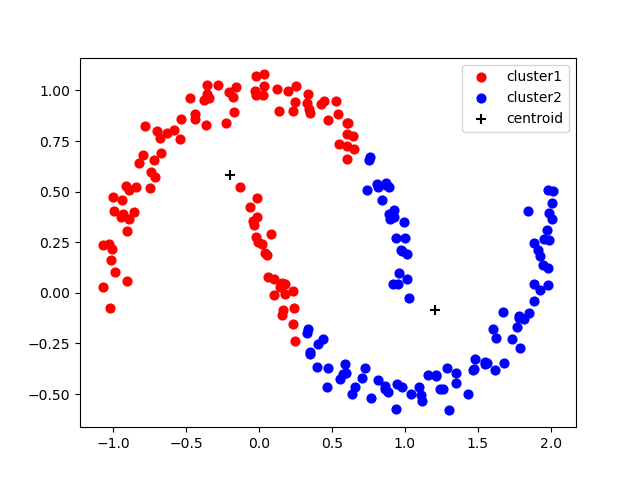
- 4. K-Means로 군집분류
km = KMeans(n_clusters=2, random_state=0)
km.fit(x)

pred1 = km.predict(x)
print('예측 군집 : ', pred1[:10])
- 5. K-Means 군집결과 시각화
def plotFunc(x, pred):
    plt.scatter(x[pred==0, 0], x[pred==0, 1], s=40, c='r', marker='o', label='cluster1')
    plt.scatter(x[pred==1, 0], x[pred==1, 1], s=40, c='b', marker='o', label='cluster2')
    plt.scatter(km.cluster_centers_[:, 0], km.cluster_centers_[:, 1], s=60, c='black', marker='+', label='centroid')
    plt.legend()
    plt.show()

plotFunc(x, pred1)
- 6. 밀도 기반 클러스터링 DBSCAN으로 군집화
- eps 속성 : 두 샘플간의 최대 거리
- min_samples 속성 : 하나의 데이터 반경 안에 있는 샘플 개수 지정
- metric 속성 : 거리 계산 방법 지정ds = DBSCAN(eps=0.2, min_samples=5, metric='euclidean') pred2 = ds.fit_predict(x) plotFunc(x, pred2)


데이터 사이언티스트를 목표로 하는 개발자