
블로그를 이전 중이라 완료되기 전까지는 벨로그에 작성할 계획입니다.
이후 모든 글은 https://weekwith.me 에 작성 예정이니 다른 글이 궁금하시다면 해당 링크를 통해 방문해주세요.또한 본 글의 모든 내용은 Coursera IBM AI Engineering Professional Certificate 과정의 강의를 참고했음을 알립니다.
Introduction to Regression
What is regression?
- Regression is the process of predicting a continuous value.
Depedent Variable
- Can be seen as state, target, or final goal we study and try to predict.
- It is notated by Y.
- It should be continuous and not discrete value.
Independent Varaible
- Also known as explanatory variables, can be seen as the causes of those states.
- It is shown conventionally by X.
- Can be measured on either a categorical or continous measurement scale.
Types of regression models
Simple Regression
- Using a single dependent variable.
- Simple Linear Regression
- Simpe Non-linear Regression
Multiple Regression
- Using multiple depedent variables.
- Multiple Linear Regression
- Multiple Non-linear Regression
Section Quiz
Question 1
- Which one is a sample application of regression?
Answer
- Forecasting rainfall amount for next day.
Simple Linear Regression
Using linear regression to predict continuous values
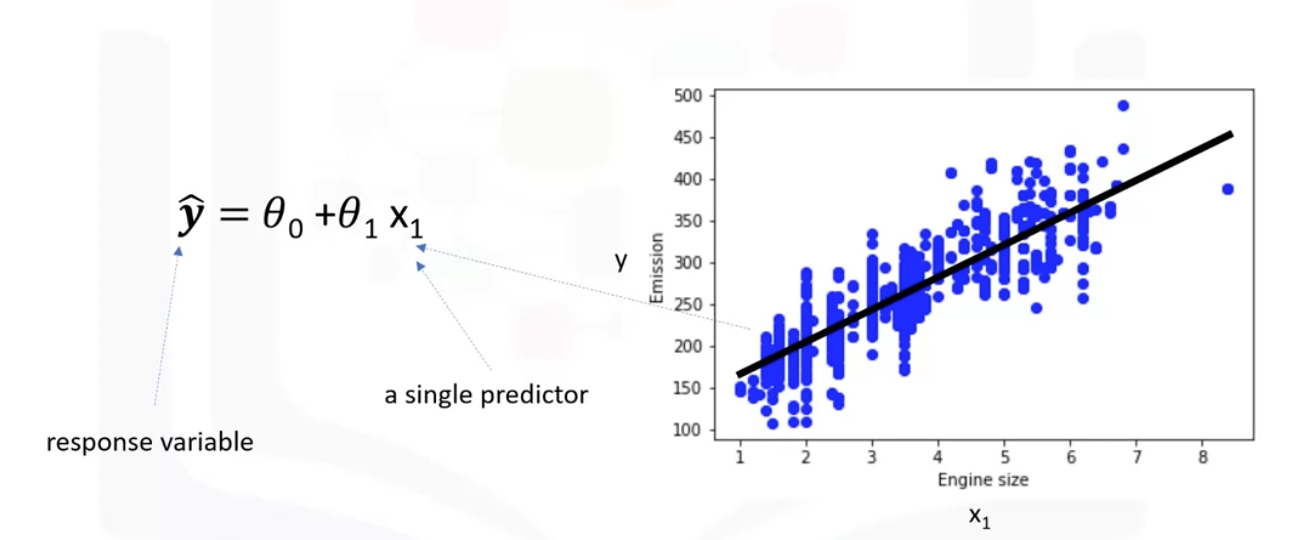
- Linear regression is the approximate of a linear model used to describe the relationship between two or more varaibles.
- In simple linear regression, there are two variables, a depedent variable and an independent variable.
- The key point is that our dependent values should be continuous and cannot be a discrete value.
- The independent variables can be measured on either a categorical or continuous measurement scale.
Linear regression topology
Simple Linear Regression
- One independent varaible is used to estimate a dependent variable.
Multiple Linear Regression
- More than one independent variable is present the process.
How does linear regression work?
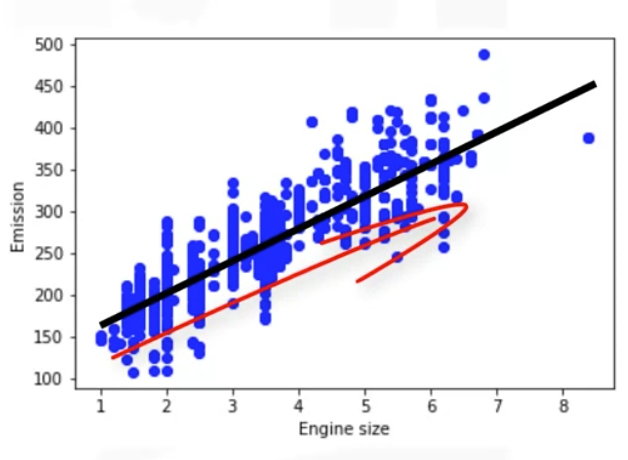
- It shows Engine size as an independent variable and Emission as the target value to predict.
- A scatter plot clearly shows the relation between variables where changes in on variable explain or possibly cause changes in the other variable.
- It indicates that theses variables are linearly related. Thus, if Engine size increases, so do the Emssion.
- With linear regression you can model the relationship of theses variables. A good model can be used to predict what the approximate emission of each car is.
- Draw a line through the points with the above equation.
- Must calculate theta 0 and theta 1 to find the best line to fit the data. This line would best estimate the Emission (y) of the unknown data points.
How to find the best fit?
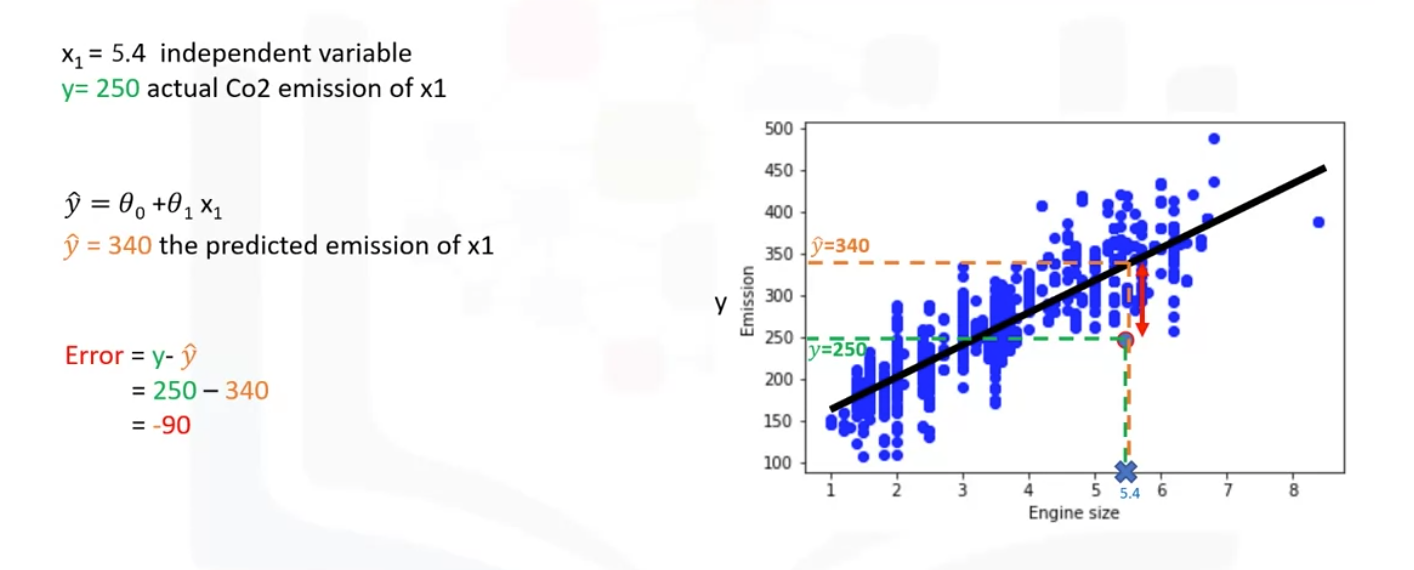
- The 90 unit error is also called the residual error
- The residual error is the distance from the data point to the fitted regression line. It shows how poorly the line fits with the whole data set.
- It can be calculated by MSE(Mean Squared Error) and it should be minimized to predict.
- Thus, the objective of linear regression is to minimize this MSE equation. For minimizing, we should find the best parameters theta 0 and theta 1.
- We can find the best parameters with using mathematic approach or optimization approach.
Estimating the parameters
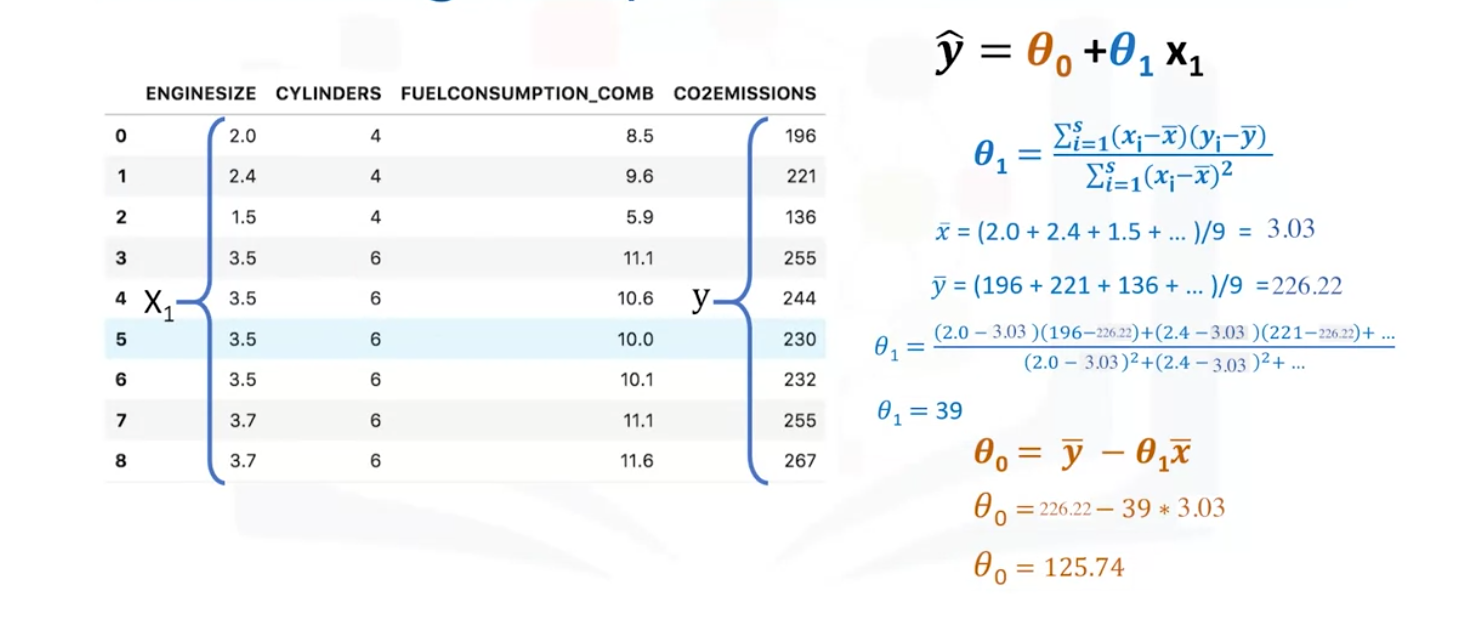
- Theta 0 and theata 1 in the simple regression are the coefficients of the fit line.
- It's a simple linear regression with only two parameters, and knowing that theta 0 and theta 1 are the itercept and slope of the line, we can estimate them directly from the data.
- We can find the theta 1 to calculate the slope of a line with the average value for the x and y, and find the theta 0 with based on the theata 1, the average of x, and y.
- Theta 0 is also called the bias coefficient and theta 1 is the coefficient for the depedent variable.
Pros of linear regression
- Very fast
- No parameter tuning
- Easy to understand, and highly interpretable
Section Quiz
Question 1
- What is the predicted value for "Co2Emission" of the car in row 9, given X1 is the number of cylinders, Intercept=100, and Coefficient=30?
Answer
- 220
Model Evaluation in Regression Models
Model evaluation approaches
- We have to perform regression evaluation after building the model.
- There are two types of evluation approaches, train and test on the same data set and split the training and testing.
Best approach for most accurate results?
Train and test on the same data set
- Select a portion of our data set for testing.
- Use the entire data set for training and build a model. Afther this, select a small portion of the data set called a test set which has the labels without being used for prediction, only as ground truth.
- Pass the portiong of the data set to test built model and compare the predicted values by the model with the actual values in the test set.
- This evaluation approach would most likely have a high training accuracy and the low out-of-sample accuracy since the model knows all of the testing data points from the training.
Conclusion
- Test-set is a portion of the train-set.
- High training accuracy
- Low out-of-sample accuracy
Train/Test split evaluation approach
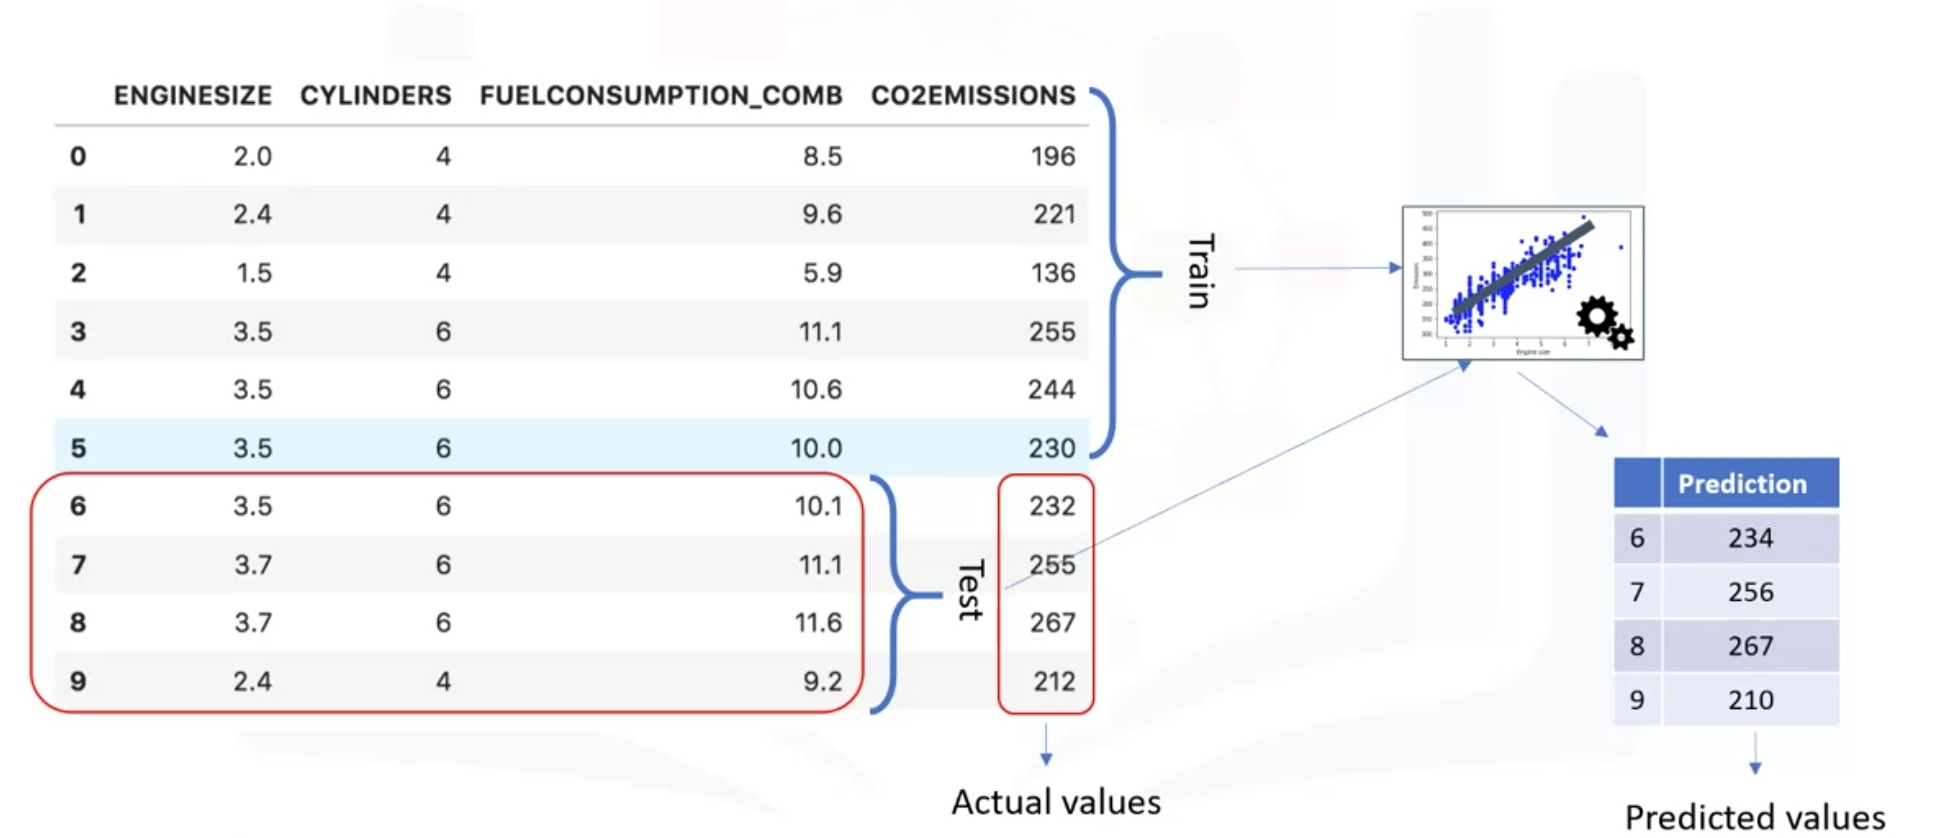
- Select row zero to five for training and select row six to nine for testing. They are exclusive.
- Compare the result of test with the actual value.
- Train the model with the testing set afterwards not to lose potentially valuable data.
- The issue of it is that it's highly dependent on the data sets on which the data was trained and tested.
Conclusion
- Mutually exclusive
- More accurate evaluation on out-of-sample accuracy
K-fold cross-validation
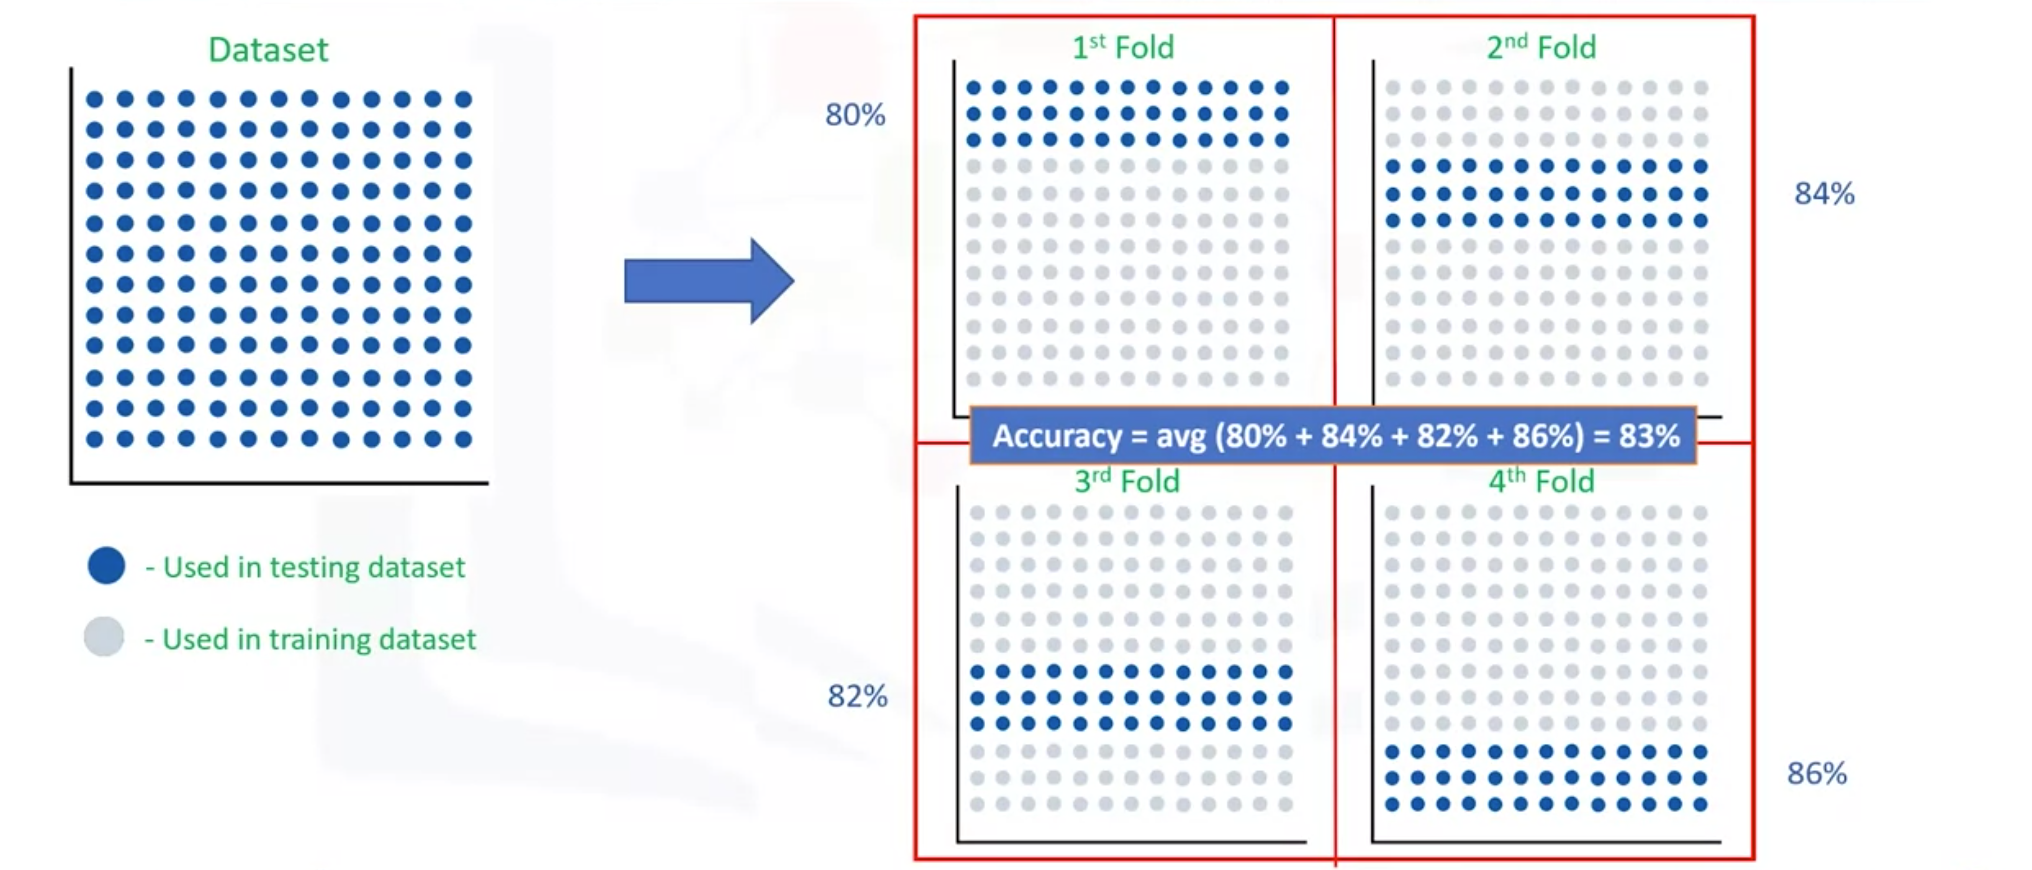
- It can resolves of the problem of the spliting train and test data set by average.
- Each fold is distinct, where no training data in one fold is used in another.
- It is the simplest form performs multiple spliting traing and testing data set with the same data set where each split is different.
- The result is average to produce a more consistent out-of-sample accuracy.
What is training & out-of-sample accuracy?
Training Accuracy
- It is the percentage of correct predictions that the model makes when using the test data set.
- High traning accuracy isn't necessarily a good thing because of the over-fit.
- Over-fit is the model is overly trained to the data set, which may capture noise and produce a non-generalized model.
Out-of-Sample Accuracy
- It is the percentage of correct predictions that the model makes on data that the model has not been trained on.
- It is important that our models have a high, out-of-sample accuracy because doing a train and test on the same data set will most likely have low out-of-sample accuracy due to the likelihood of being over-fit.
- Thus, split the training and testing evaluation to havg high out-of-sample accuracy.
Section Quiz
Question 1
- Which sentence is NOT TRUE about model accuracy?
Answer
- Doing a train and test on the same data set will cause very high out-of-sample accuracy.
Evaluation Metrics in Regression Models
What is an error of the model?
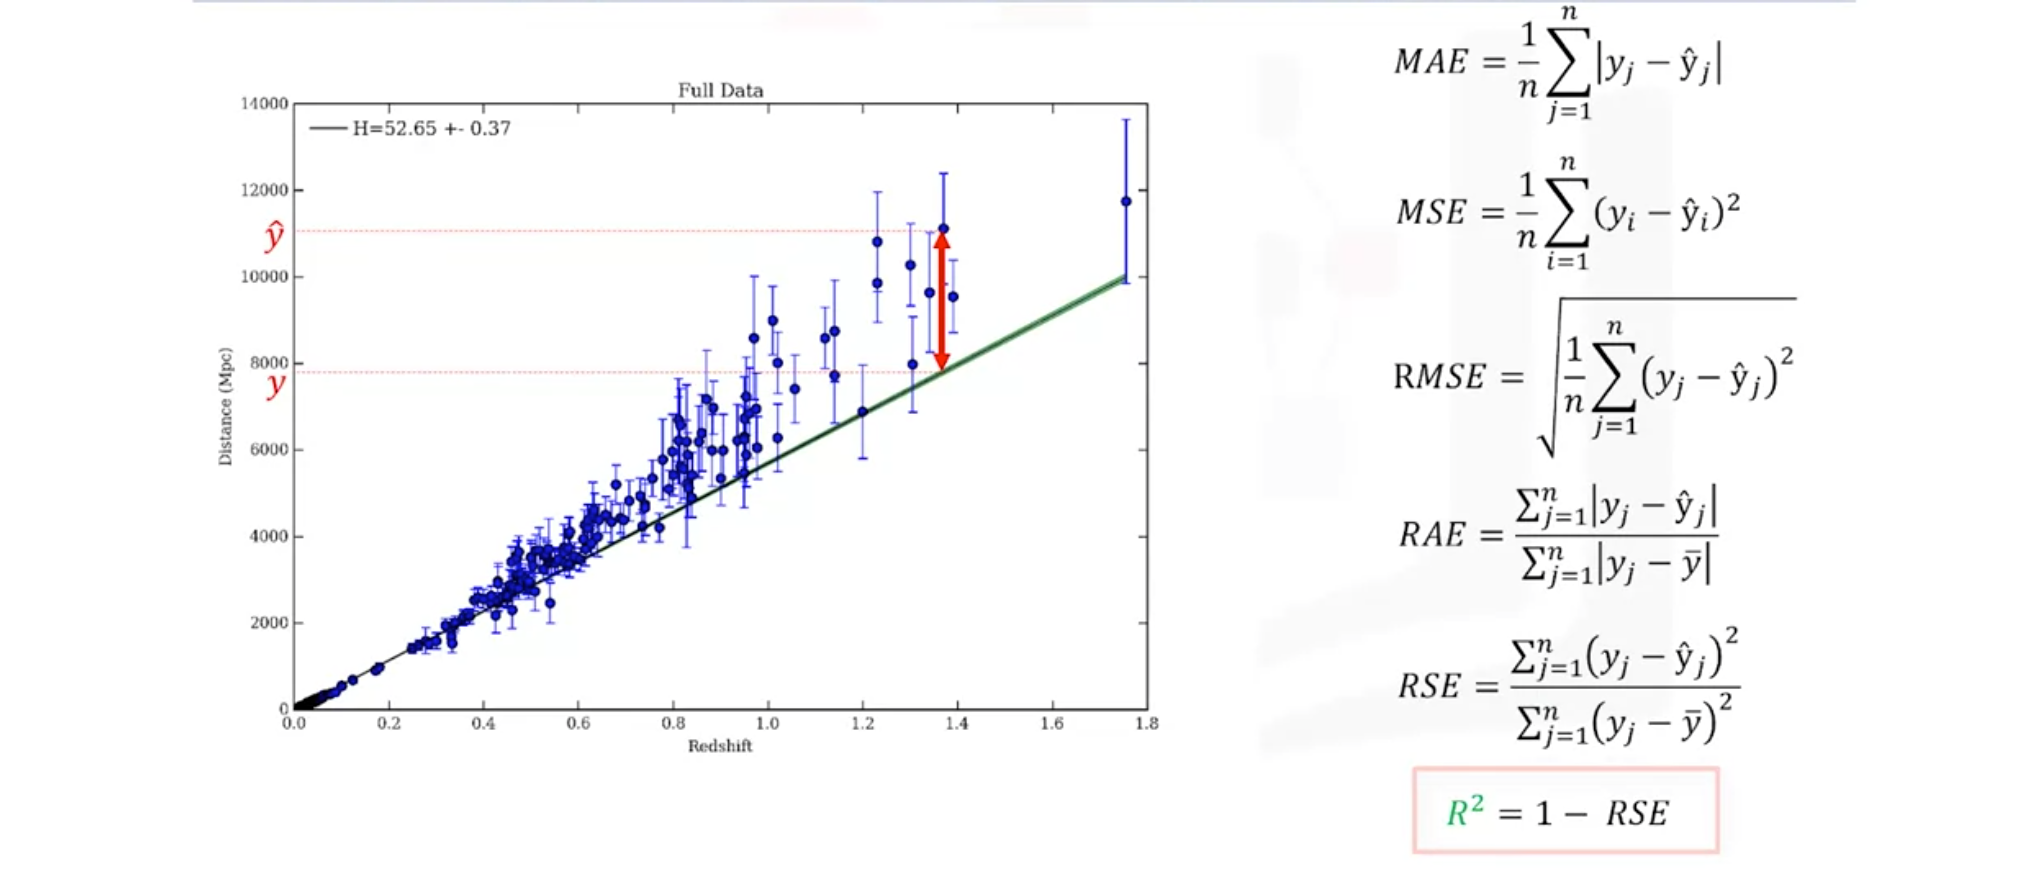
- It measures of how far the data is from the fitted regression line.
Mean Absolute Error (MAE)
- It is just the average of the error.
Mean Squared Error (MSE)
- It is more popular than MAE because the focus is geared more towards large errors because of the squared term, which makes expotentially increasing larger errors in comparison to smaller ones.
Root Mean Squared Error (RMSE)
- It is one of the most popular of the evaluation metrics because it is interpretable in the same units as the response vector or Y units, making it easy to relate its information.
Relative Absolute Error (RAE)
- It is also known as residual sum of square, where Y bar is a mean value of Y.
- It takes the total absolute errors and normalizes it.
Relative Squared Error (RSE)
- It is similar to RAE, but it is widely adopted by the data science community as it is used for calculating R-squared.
R-squared
- It is not an error but it is a popular metric for the accuracy of the model.
- It represents how close the data values are to the fitted regression line.
- The higher thre R-squared, the better to model fits the model.
Conclusion
- The choice of metric completely depends on the type of model your data type and domain of knowledge.
Section Quiz
Question 1
- In the context of regression, what is the error of a model?
Answer
- The difference between the data points and the trend line generated by the algorithm
Multiple Linear Regression
Examples of multiple linear regression
Indenpendent variables effectiveness on prediction
- Does revision time, test anxiety, lecture attendance and gender have any effect on the exam performance of students?
Predicting impacts of changes
- How much does blood pressure go up (or down) for every unit increase (or decrease) in the BMI of a patient?
Predicting continuous values with multiple linear regression
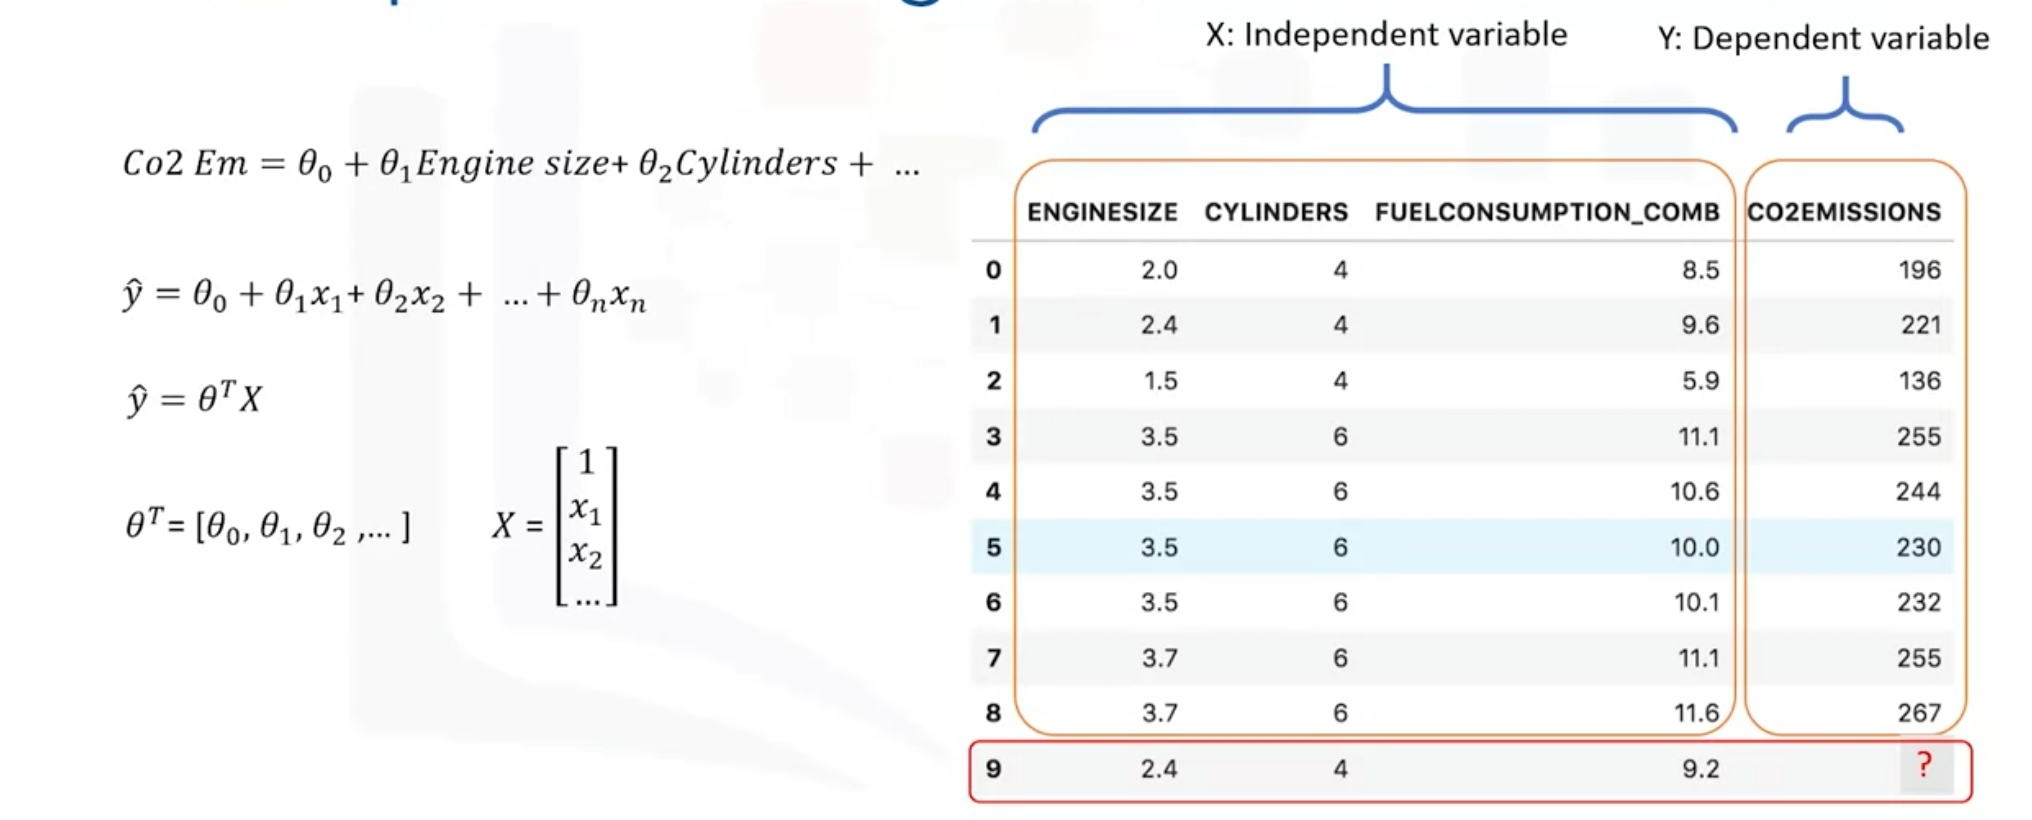
- The target value, also called indenpendent variable, Y is a linear combinations of independent variables x.
- Mathmetically, we can show it as a vector form as a dop product of two vectors; the parameters vector and the featured set vector.
- Generally, we can show the equation for a multi-dimensional space as theta transpose x, where theta is an n by one vector of unkown parameters in a multi-dimenstional space.
- x is the vector of the featured sets, as theta is a vector of coefficients and is supported to be mutiplied by x. Theta is also called the parameters or weight vector of the regression equation.
- The first element of the feature set woul be set to one because it turns that theta zero into toe intercept or biased parameter when the vector is mutiplied by the parameter vector.
- The line is called a plane or a hyperplane in higher dimensions, and this is what we use for multiple linear regression.
- Thus, the whole idea is to find the best fit hyperplane for the data by estimating the values for theta vector that best predict the value fo the target field in each row with minimizing the errors of the prediction.
Using MSE to expose the errors in the model
Opimized parameters
- Optimzed parameters are the ones which lead to a model with the fewest errors. Thus, the best model for the data set is the one with minimum error for all prediction values.
- There are many ways to expose the error of a multiple linear regression model, but on of the most popular way is using MSE. Thus, the objective of multiple linear regression is to minimize the MSE equation.
Estimating multiple linear regression parameters
How to estimate theta?
- The most common methods are the ordinary least squares and optimization algorithm.
Ordinary least squares
- It tries to estimate the values of the coefficient by minimizing the MSE.
- It uses the data set as a matrix an linear algebra operations to estimate the optimal values for the theta.
- The problem is the time complexity of calculating matrix operations as it can take a very long time to finish. Thus, if it the number of rows in the data set is less than 10,000, you can optinoally think this method.
Optimization algorithm
- Iteratively minimizing the error of the model on the training data.
- For example, using gradient descent which starts optimization with random values for each coefficient, then calculates the erros and tries to minimize it through y's chaning of the coefficients in multiple iterations. Gradient descent is a proper approach if you have a large data set.
Making predictions with multiple linear regression
- Multiple linear regression estimates the relative importance of predictors. Thus, if Cylinder has higher theta value than Enigne Size, it means it has higher impact on CO2 Emission Amounts in comparison with Engine Size.
- It is recommended to avoid using many variables for prediction because of the over-fit.
Section Quiz
Question 1
- What is the best approach to find the parameter or coefficients for multiple linear regression, when we have very large data set?
Answer
- Using an optimization approach
Non-Linear Regression
Should we use linear regression?
- Linear regression would not produce very accurate results when compared to a non-linear regression if the data shows a curvy trend because the linear regression presumes that the data is linear.
Different types of regression
- There are many different regressions exists that can be used to fit whaever data set looks like such as a quadratic, or cubic regression. These are called polynomial regression, where the relationship between the independent variable X and the dependent variable Y is modeled as an Nth degree polynomial in X.
- It is important to pick a regression that fits the data the best.
What is polynomial regression?
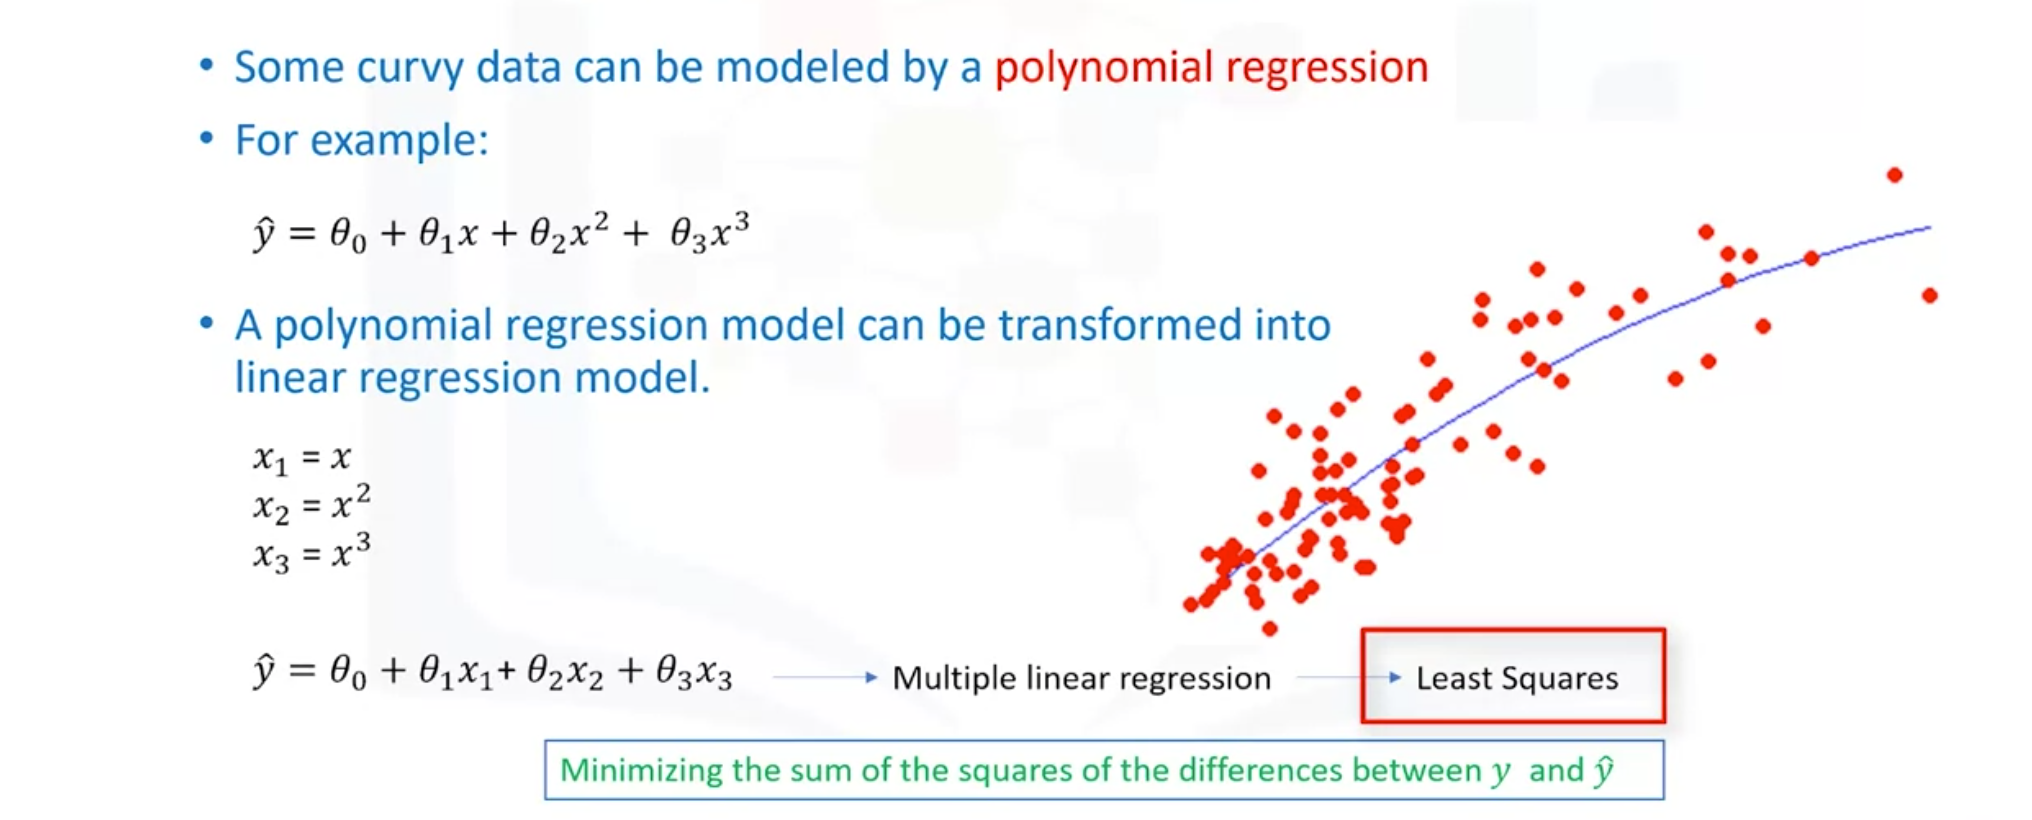
- Some curvy data can be modeled byu a polynomial regression.
- Event though the relationship between X and Y is non-linear and polynomial regression can't fit them, a polynomial still can be transformed into linear regression model.
- Polynomial regression models can fit using the model of least squares to make non-linear model be linear model.
- Least squares is a method for estimating the unkwon parameters in a linear regression model by minimizing the sum of the squares of the differences between the observed dependent variable in the given data set and those predicted by the linear function.
What is non-linear regression?
- To model non-linear relationship between the dependent variable and a set of independent variables.
- Y must be a non-linear function of the parameters theta, not necessarily the features x. Thus, it can be the shape of exponential, logarithmic, and logistic, or many other types.
- We can't use the ordinary least squares method to fit the data in non-linear regression. It is not easy to estimate the parameters.
Linear vs non-linear regression
How can I know if a problem is a linear or non-linear in an easy way?
- Inspect visually
- Based on accuracy
How should I model my data, if it displays non-linear on a scatter plot?
- Polynomial regression
- Non-linear regression model
- Transform your data
Section Quiz
Question 1
- Which sentence is NOT TRUE about "Polynomial Regression"?
Answer
- A polynomial regression model cannot be exposed as linear regression
Quiz
Question 1
- Which of the following is the meaning of "**Out of Sample Accuracy" in the context of evaluation of models?
Answer
- "Out of Sample Accuracy" is the percentage of correct predictions that the model makes on data that the model has NOT been trained on.
Question 2
- When should we use Multiple Linear Regression?
Answer
- When we would like to identify the strength of the effect that the independet variables have on a dependent variable.
- When we would like to predict impacts of changes in independent variables on a dependent variable.
Question 3
- Which sentence is NOT TRUE about Non-linear Regression?
Answer
- Non-linear regression must have more than one dependent variable.

Be Happy 😆
who need help improving their coding skills bubble slides, daily game solve cross