📔설명
Performance 스키마와 Sys 스키마에 대해 알아보자
🎐Performance 스키마란?
Performance 스키마 : MySQL 서버가 기본적으로 제공하는 시스템 데이터베이스 중 하나
=> MySQL 서버 내부 동작 및 쿼리 처리와 관련된 정보 저장
=> PERFORMANCE_SCHEMA 스토리지 엔진
=> 서버 상태 및 처리 성능 관련 정보 확인
show databases;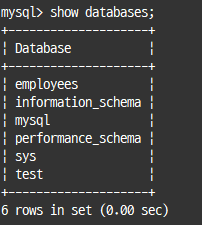
PERFORMANCE_SCHEMA 스토리지 엔진 : MySQL 서버가 동작 중인 상태에서 실시간으로 정보 수집, 메모리에 저장
🎑Performance 스키마 구성
Performance 스키마 설정과 관련된 테이블, Performance 스키마가 수집한 데이터가 저장되는 테이블로 나뉨
1. Setup 테이블
Setup 테이블 : Performance 스키마의 데이터 수집 및 저장과 관련된 설정 정보 저장
=> Performance 스키마 설정 동적으로 변경 가능
2. Instance 테이블
Instance 테이블 : Performance 스키마가 데이터를 수집하는 대상인 실체화된 객체들, 즉 인스턴스들에 대한 정보 제공
3. Connection 테이블
Connection 테이블 : MySQL에서 생성된 커넥션들에 대한 통계 및 속성 정보 제공
4. Variable 테이블
Variable 테이블 : MySQL 서버의 시스템 변수 및 사용자 정의 변수, 상태 변수에 대한 정보 제공
5. Event 테이블
Event 테이블 : Wait, Stage, Statement, Transaction 이벤트 테이블로 구성
=> 스레드에서 실행된 쿼리 처리 관련 이벤트
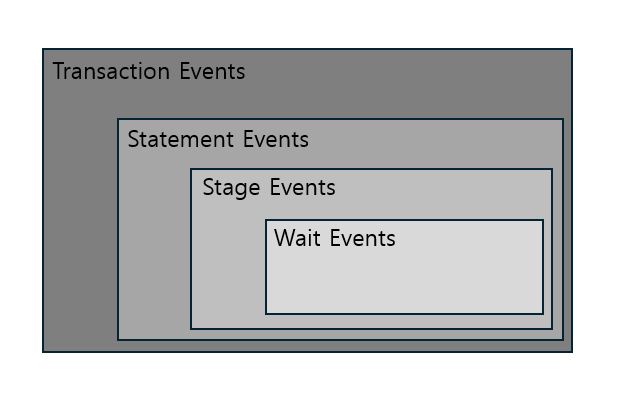
Wait Event 테이블
각 스레드에서 대기하고 있는 이벤트들에 대한 정보 확인
Stage Event 테이블
각 스레드에서 실행한 쿼리들의 처리 단계에 대한 정보 확인
=> 구문 분석, 테이블 열기, 정렬 등 어느 단계 수행하는지 보여줌
Statement Event 테이블
각 스레드에서 실행한 쿼리들에 대한 정보 확인
Transaction Event 테이블
각 스레드에서 실행한 트랜잭션에 대한 정보 확인
6. Summary 테이블
Summary 테이블 : Performance 스키마가 수집한 이벤트들을 특정 기준별로 집계한 후 요약한 정보 제공
7. Lock 테이블
Lock 테이블 : MySQL에서 발생한 잠금 관련 정보 제공
8. Replication 테이블
Replication 테이블 : show replica status 보다 더 상세한 복제 관련 정보 제공
9. Clone 테이블
Clone 테이블 : Clone 플러그인을 통해 수행되는 복제 작업에 대한 정보 제공
10. 기타 테이블
error_log : MySQL 에러 로그 파일 내용 저장
host_cache : MySQL의 호스트 캐시 정보 저장
keyring_keys : Keyring 플러그인에서 사용되는 키에 대한 정보 저장
log_status : 로그 파일들의 포지션 정보 저장
performance_timers : 사용 가능한 이벤트 타이머들과 그 특성에 대한 정보 저장
processlist : 세션 목록, 상태, 실행 중인 쿼리 정보 등
threads : 백그라운드 스레드 및 포그라운드 스레드들에 대한 정보 저장
tls_channel_status : TLS(SSL) 속성 정보 저장
user_defined_functions : 사용자 정의 함수들에 대한 정보 저장
🧧Performance 스키마 설정
show global variables like 'performance_schema';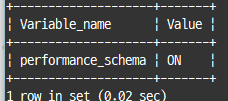
메모리 사용량설정- 데이터
수집및저장설정
1. 메모리 사용량 설정
Performance 스키마는 수집한 데이터를 모두 메모리에 저장
=> 얼마만큼의 데이터를 저장할 것인가 설정
2. 데이터 수집 및 저장 설정
Performance 스키마가 어떤 대상에 대해 모니터링 하며 어떤 이벤트들에 대한 데이터를 수집하고 어느 정도 상세한 수준으로 저장하게 할 것인지 제어
생산자(Producer)-소비자(Consumer)로 구현되어 데이터 수집 부분과 저장 부분으로 나뉘어 동작
설정 적용 방식
- 서버
구동 중적용하는런타임 적용 방식 설정 파일을 통해 영구적으로 적용하는 방식
런타임 설정 적용
Performance 스키마에 존재하는 설정 테이블을 통해 이뤄지며, setup_이라는 접두사로 시작
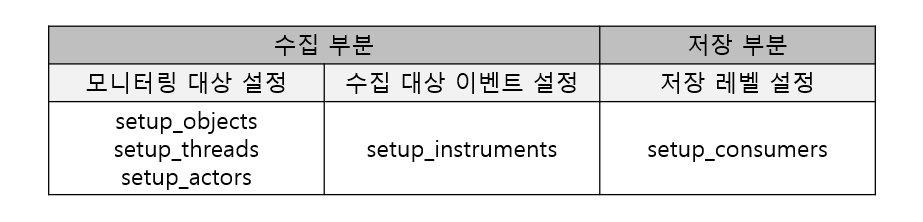
저장 레벨 설정
select * from setup_consumers;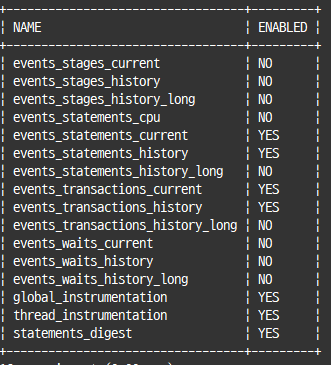
수집 대상 이벤트 설정
select * from setup_instruments \G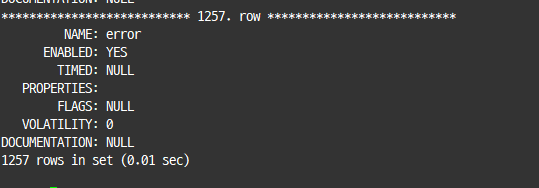
모니터링 대상 설정
select * from setup_objects;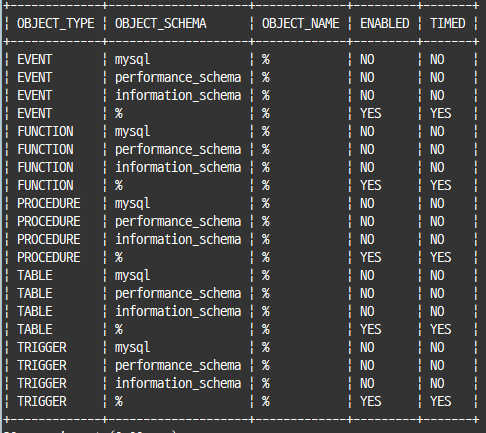
select * from setup_threads \G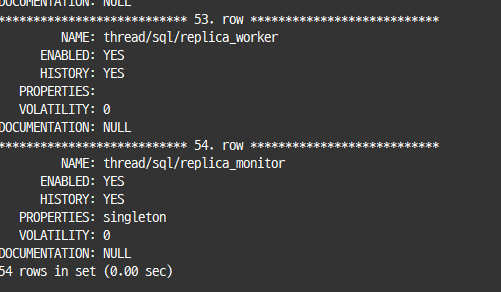
#모니터링 대상 DB 계정 설정
select * from setup_actors;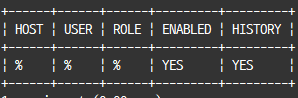
Performance 스키마 설정의 영구 적용
스키마 수집 대상 이벤트 및 데이터 저장 레벨에 대해서만 가능
#스키마 수집 대상 이벤트
performance_schema_instrument='instrument_name=value'
#데이터 저장 레벨
performance_schema_consumer_consumer_name=value🎀Sys 스키마란?
Performance 스키마의 어려운 사용법을 해결해주는 솔루션
=> 사용자들이 더욱 쉽게 이해할 수 있는 형태로 출력하는 뷰와 스토어드 프로시저, 함수 제공
🎁Sys 스키마 사용을 위한 사전 설정
Performance 스키마에 저장된 데이터를 참조하므로Performance 스키마기능이 활성화
#DB 계정에 Sys스키마 사용시
grant process on *.* to 'user'@'host';
grant system_variables_admin on *.* to 'user'@'host';
grant all privileges on 'sys'.* to 'user'@'host';
grant select, insert, update, delete, drop on 'performance_schema'.* to 'user'@'host';
🎫Sys 스키마 구성
Sys스키마는 테이블, 뷰, 프로시저, 함수로 구성
1. 테이블
Sys 스키마의 데이터베이스 객체에서 사용되는 옵션의 정보가 저장
sys_config: Sys 스키마의함수및프로시저에서 참조되는옵션들이 저장된 테이블
select * from sys_config;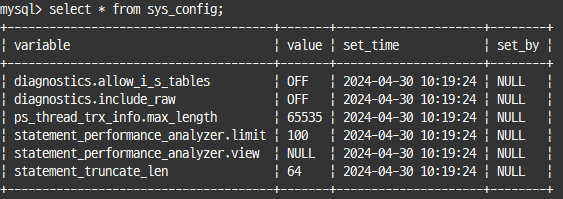
2. 뷰
Formatted-View : 출력되는 결과에서 시간이나 용량이 사람이 쉽게 읽을 수 있는 수치로 변환해서 보여줌
Raw-View : x$로 시작하며, 데이터를 저장된 원본 형태 그대로 출력해서 보여줌
3. 스토어드 프로시저
Performance 스키마의 설정을 손쉽게 확인 및 변경 가능
4. 함수
값의 단위를 변환하고, Performance 스키마의 설정 및 데이터를 조회
🎠Performance 스키마 및 Sys 스키마 활용 예제
1. 호스트 접속 이력 확인
hosts 테이블 : MySQL 서버가 구동된 시점부터 현재까지 MySQL에 접속했던 호스트들의 전체 목록 얻을 때
select * from performance_schema.hosts;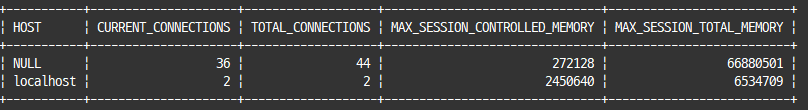
2. 미사용 DB 계정 확인
구동된 시점 부터 현재 까지 사용되지 않은 DB 계정 확인시
select distinct m_u.user, m_u.host
from mysql.user m_u
left join performance_schema.accounts ps_a on m_u.user=ps_a.user and ps_a.host=m_u.host
left join information_schema.views is_v on is_v.definer=concat(m_u.user,'@',m_u.host)
and is_v.security_type='DEFINER'
left join information_schema.routines is_r on is_r.definer=concat(m_u.user,'@',m_u.host)
and is_r.security_type='DEFINER'
left join information_schema.events is_e on is_e.definer=concat(m_u.user,'@',m_u.host)
left join information_schema.triggers is_t on is_t.definer=concat(m_u.user,'@',m_u.host)
where ps_a.user is null
and is_v.definer is null
and is_r.definer is null
and is_e.definer is null
and is_t.definer is null
order by m_u.user, m_u.host;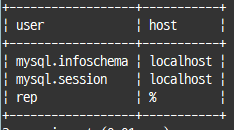
3. MySQL 총 메모리 사용량 확인
select * from sys.memory_global_total;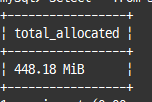
4. 스레드별 메모리 사용량 확인
select thread_id, user, current_allocated
from sys.memory_by_thread_by_current_bytes
limit 10;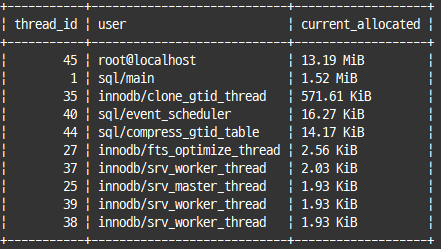
5. 미사용 인덱스 확인
select * from sys.schema_unused_indexes;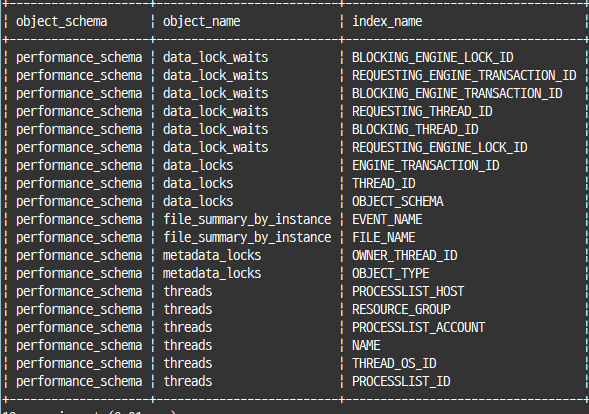
6. 중복된 인덱스 확인
select * from sys.schema_redundant_indexes limit 1 \G7. 변경이 없는 테이블 목록 확인
SELECT T.TABLE_SCHEMA, T.TABLE_NAME, T.TABLE_ROWS, TIO.COUNT_READ, TIO.COUNT_WRITE
  FROM information_schema.TABLES T
  JOIN performance_schema.table_io_waits_summary_by_table TIO
    ON TIO.OBJECT_SCHEMA = T.TABLE_SCHEMA AND TIO.OBJECT_NAME = T.TABLE_NAME
 WHERE T.TABLE_SCHEMA NOT IN ('mysql','performance_schema','sys')
   AND TIO.COUNT_WRITE = 0
 ORDER BY T.TABLE_SCHEMA
        , T.TABLE_NAME;
8. I/O 요청이 많은 테이블 목록 확인
select * from sys.io_global_by_file_by_bytes where file like '%ibd' \G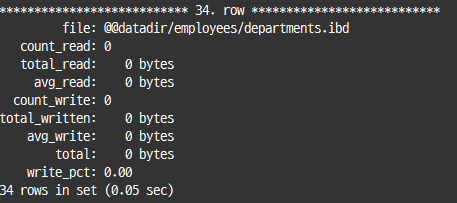
9. 테이블별 작업량 통계 확인
select table_schema, table_name, rows_fetched, rows_inserted, rows_updated, rows_deleted,
	io_read, io_write
from sys.schema_table_statistics
where table_schema not in ('mysql', 'performance_schema','sys') \G
10. 테이블의 Auto-Increment 칼럼 사용량 확인
select table_schema, table_name, column_name,
	auto_increment as "current_value", max_value,
	round(auto_increment_ratio*100,2) as "usage_ratio"
from sys.schema_auto_increment_columns;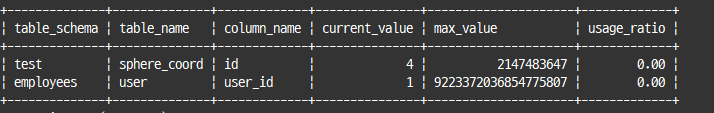
11. 풀 테이블 스캔 쿼리 확인
SELECT A.db
     , A.query
     , A.exec_count
     , sys.format_time(A.total_latency) AS FORMATTED_TOTAL_LATENCY
     , rows_sent_avg
     , rows_examined_avg
     , last_seen
  FROM sys.`x$statements_with_full_table_scans` A
 ORDER BY A.total_latency DESC \G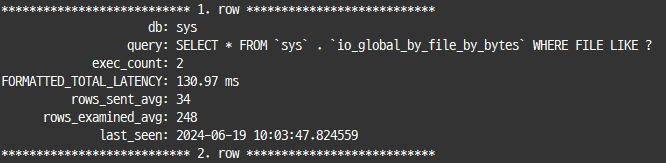
12. 자주 실행되는 쿼리 목록 확인
select db, exec_count, query
from sys.statement_analysis
order by exec_count desc;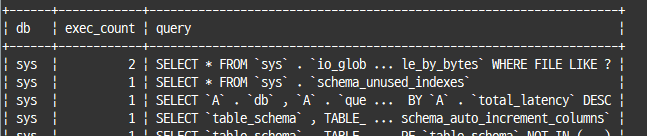
13. 실행 시간이 긴 쿼리 목록 확인
select query, exec_count, sys.format_time(avg_latency) as "formatted_avg_latency",
	rows_sent_avg, rows_examined_avg, last_seen
from sys.x$statement_analysis
order by avg_latency desc \G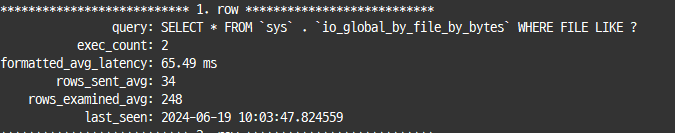
14. 정렬 작업을 수행한 쿼리 목록 확인
select * from sys.statements_with_sorting
order by last_seen desc
limit 1 \G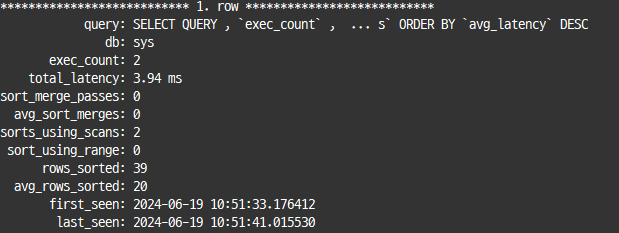
15. 임시 테이블을 생성하는 쿼리 목록 확인
select * from sys.statements_with_temp_tables
limit 10 \G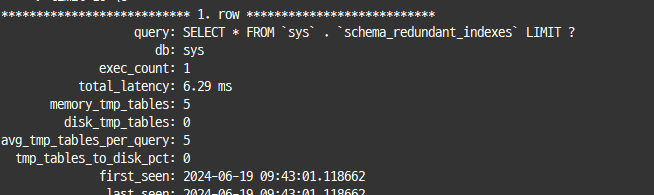
16. 트랜잭션이 활성 상태인 커넥션에서 실행한 쿼리 내역 확인
SELECT A.PROCESSLIST_ID
     , C.THREAD_ID
     , CONCAT(A.PROCESSLIST_USER,'@',A.PROCESSLIST_HOST) AS DB_ACCOUNT
     , C.EVENT_NAME
     , C.SQL_TEXT
     , sys.format_time(C.TIMER_WAIT) AS DURATION
     , DATE_SUB(NOW(), INTERVAL (SELECT VARIABLE_VALUE FROM performance_schema.global_status SQ WHERE SQ.VARIABLE_NAME ='UPTIME') -C.TIMER_START *10e-13 SECOND ) AS START_TIME
     , DATE_SUB(NOW(), INTERVAL (SELECT VARIABLE_VALUE FROM performance_schema.global_status SQ WHERE SQ.VARIABLE_NAME ='UPTIME') -C.TIMER_END *10e-13 SECOND ) AS END_TIME
  FROM performance_schema.threads A
 INNER JOIN performance_schema.events_transactions_current B
 		 ON B.THREAD_ID=A.THREAD_ID
 INNER JOIN performance_schema.events_statements_history C
         ON C.NESTING_EVENT_ID = B.EVENT_ID
 WHERE B.STATE = 'ACTIVE'
   AND C.MYSQL_ERRNO = 0
 ORDER BY A.PROCESSLIST_ID , B.TIMER_START \G
17. 쿼리 프로파일링
쿼리 프로파일링 : 처리 단계별로 시간이 어느 정도 소요됐는지 확인
select event_name as "Stage", sys.format_time(TIMER_WAIT) as "Duration"
from performance_schema.events_stages_history_long
where nesting_event_id=이벤트ID값
order by timer_start;
18. ALTER 작업 진행률 확인
select ps_estc.nesting_event_id, ps_esmc.sql_text, ps_estc.event_name,
	ps_estc.work_completed, ps_estc.work_estimated,
    round((work_completed/work_estimated)*100,2) as "PROGRESS(%)"
from performance_schema.events_stages_current ps_estc
inner join performance_schema.events_statements_current ps_esmc
on ps_estc.nesting_event_id=ps_esmc.event_id
where ps_estc.event_name like 'stage/innodb/alter%' \G
19. 메타데이터 락 대기 확인
#대기하게 만든 세션 정보 확인
select *
from sys.schema_table_lock_waits
where waiting_thread_id !=blocking_thread_id \G
#메타데이터 락을 오랫동안 점유하는 세션 확인
select *
from performance_schema.metadata_locks \G20. 데이터 락 대기 확인
select * from sys.innodb_lock_waits \G