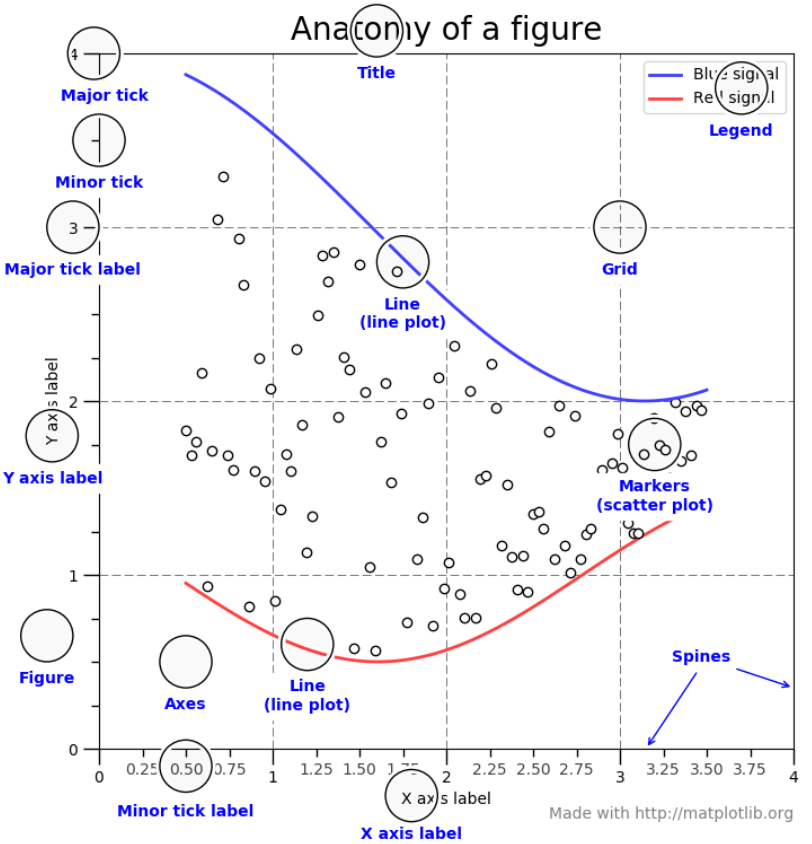
[matplotlib 해부도]
figure와 ax 객체를 생성하는 방법
-
fig = plt.figure(): ax 없는 빈 figure 생성 -
fig, ax = plt.subplots(): 하나의 ax 가지는 figure 생성 -
fig, axes = plt.subplots(nrows=2,ncols=2): 2 by 2 axes를 가지는 하나의 figure 생성
- axes안에는 nested list, 또는 numpy array와 같이 matrix 형태를 갖고 있음
- 그래프가 그려질 각각의 칸을 indexing 하고 싶으면, [0][0] 의 list 중첩 indexing과 같이도 가능하고 아니면 [0,0] 과 같이 numpy array indexing 형태로도 가능함
Reference

romantic ai developer